Classical Novae in Andromeda: Light Curves from the Palomar Transient Factory and GALEX
Abstract
We present optical light curves of twenty-nine novae in M31 during the 2009 and 2010 observing seasons of the Palomar Transient Factory (PTF). The dynamic and rapid cadences in PTF monitoring of M31, from one day to even ten minutes, provide excellent temporal coverage of nova light curves, enabling us to record the photometric evolution of M31 novae in unprecedented detail. We also detect eight of these novae in the near ultraviolet (UV) band with the Galaxy Evolution Explorer (GALEX) satellite. Novae M31N 2009-10b and 2010-11a show prominent UV emission peaking a few days prior to their optical maxima, possibly implying aspherical outbursts. Additionally, our blue-shifted spectrum of the recent outburst of PT And (M31N 2010-12a) indicates that it is a recurrent nova in M31 and not a dwarf nova in the Milky Way as was previously assumed. Finally, we systematically searched for novae in all confirmed globular clusters of M31 and found only M31N 2010-10f associated with Bol 126. The specific nova rate in the M31 globular cluster system is thus about one per year which is not enhanced relative to the rate outside the globular cluster system.
Subject headings:
surveys – nova, cataclysmic variables1. INTRODUCTION
Classical novae (CNe) are interesting to study for at least two reasons: first, they provide a laboratory to investigate thermonuclear runaways in semidegenerate conditions (e.g., Bode & Evans, 2008); second, they have been proposed as progenitors of type Ia supernovae (e.g., Starrfield et al., 1988). Observations of Galactic novae are limited due to extinction and distance determination. CNe are frequent but faint relative to supernovae. Hence, people pursue novae in the nearest galaxies.
CNe in M31 (The Andromeda Galaxy) have been observed for nearly a century (Hubble, 1929; Arp, 1956; Rosino, 1964, 1973; Ciardullo et al., 1987; Sharov & Alksnis, 1991; Tomaney & Shafter, 1992; Rector et al., 1999; Cassatella et al., 2004; Shafter & Irby, 2001; Darnley et al., 2004, 2006; Kasliwal et al., 2010; Shafter et al., 2011a). The published nova rates for M31 range between 24 yr-1 (Arp, 1956) and 65 yr-1 (Darnley et al., 2004).
The Palomar Transient Factory (PTF) (Law et al., 2009; Rau et al., 2009) acquired nearly daily monitoring of M31 in the R band during the 2009 and 2010 observing seasons. It provides three advantages for the study of novae in M31: first, the large field of view (FoV) of 7.2 square degrees covers the main region of M31 in one snapshot and with a spatial resolution of . Second, PTF has fast and dynamic cadences from one day to as short as ten minutes. This temporal coverage gives unprecedentedly detailed light curves. Third, the limiting magnitude is deeper than 20 mag (a little worse near the center of M31 where the background is strong and varies quickly). Hence, given the mean distance modulus of 24.36 for M31 (Vilardell et al., 2010), unless some very faint novae are extincted heavily by local dust, PTF should see nearly all of the novae (weather-permitting) in M31 and follow them up down to a magnitude of M.
These data also afford the opportunity to explore known recurrent novae (RNe) in M31 and perhaps discover new ones. According to the catalog maintained by Pietsch (2010), about thirteen recurrent novae have been discovered in M31. RNe are possible progenitors of Type Ia supernovae, since their white dwarf mass is thought to be closer to the Chandrasekhar mass limit than ordinary CNe (Starrfield et al., 1988)
Another issue related to novae that can be assessed with PTF archives is whether the nova rate in the globular cluster (GC) system is enhanced relative to that outside the globular cluster system. Ciardullo et al. (1990b) did a search for novae in fifty-four M31 GCs based on the H survey of Ciardullo et al. (1987) and Ciardullo et al. (1990a). In a mean effective survey time of approximate two years, they did not find any nova outbursts in any of the M31 GCs. Tomaney et al. (1992) reported another one-year search of over two hundred M31 GCs with H emission but did not find any nova outbursts, providing an upper limit on the rate of 0.005 nova yr-1 GC-1. The only GC nova found in M31 is M31N 2007-06b (Shafter & Quimby, 2007). Henze et al. (2009e) then derived a rate of 1.1 nova yr-1 for the M31 GC system, which is comparable to the rate (per unit mass) outside the globulars. A systematic search for novae in M31 GCs using the PTF archives is presented here and also supported this conclusion.
In a nova outburst, except for a short “fireball” phase where radiation is given out by the thermal emission of the photosphere, UV photons are thought to originate at the surface of the white dwarf (WD), deep within the nova envelope, while optical photons are released near the surface of the envelope and result from absorption and re-emission of relatively low ionization species such as Cr II, Fe II and other heavy metals generated during the outburst. Nova shells therefore serve as passive photon converters whose spectra reflect the reprocessing of incident UV light to longer wavebands. Eventually, the expansion decreases the temperature and dilutes absorbing species to finally reveal the UV photons (Kato & Hachisu, 1994; González-Riestra & Krautter, 1998). Therefore, to explore the UV light powering the nova emission, we searched in parallel for any contemporaneous ultra-violet observations of CNe in M31 with the GALEX satellite (Martin et al., 2005). Finally, we obtained near UV-optical light curves for eight novae in M31.
This paper is arranged as follows. Section 2 describes PTF and GALEX observation and data reduction as well as data from other sources. Section 3 presents light curves of classical novae and describes their morphology. Section 4 discusses novae in globular clusters. Section 5 focuses on recurrent novae. Section 6 discusses ordinary and bizarre novae observed in UV band. Section 7 revisits the MMRD relation with our novae sample. Finally we conclude this paper in Section 8.
2. OBSERVATION
2.1. Nova Sample
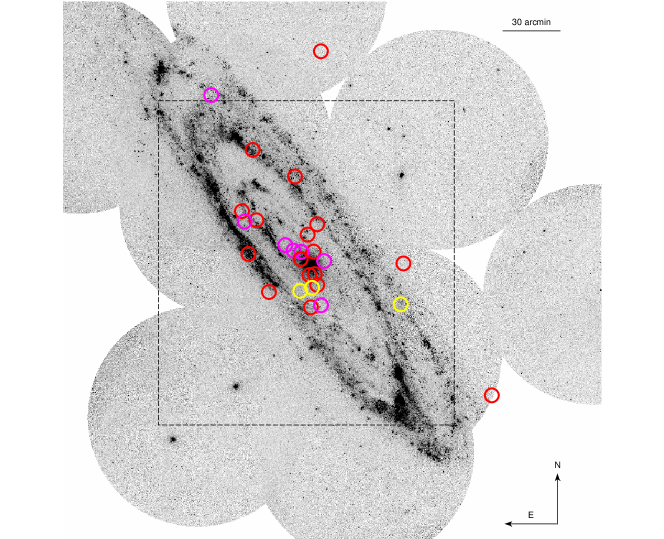
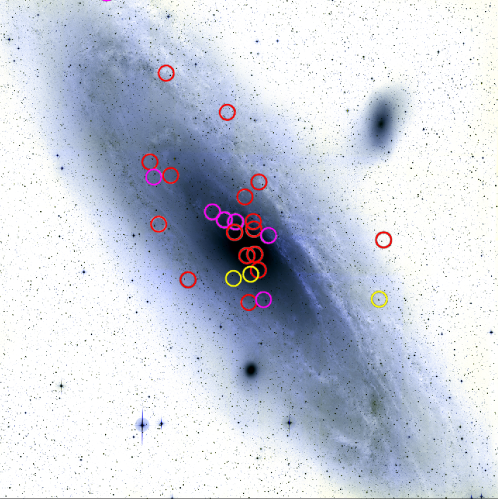
We examined all novae as reported by Pietsch (2010)111http://www.mpe.mpg.de/m31novae/opt/m31/index.php. This site maintains a comprehensive catalog of novae in M31. in the PTF image archives and obtained the light curves of twenty-nine novae. Among them, eight novae also have UV light curves from GALEX. Table 1 gives main parameters of PTF and GALEX observations. Table 2.1 describes the nova sample and Figure 1 illustrates their spatial distribution.
| PTF | GALEX | |
|---|---|---|
| Filter | Mould R | NUV |
| (Å) | 6581 | 2316 |
| (Å) | 1251 | 1060 |
| (s) | 60 | 740-1703 |
| FoV (deg2) | 7.2 | 1.2 |
| Cadence | 10min to days | 1-2 days |
| Epoch | 726 | 51 (the center field) |
| 22-27 (outskirt fields) |
| Discovery Date | Magnitude | PTF First Detection | Spectral | ||||
|---|---|---|---|---|---|---|---|
| Nova Name | (J2000) | (J2000) | by Others | at Discovery | Date | Type | Reference |
| M31N 2009-08b | 2009/08/09.780 | 17.2(U)11The bracket following the magnitude indicates the observation band and U represents unfiltered observation. | 2009/08/18.423 | … | 1 | ||
| M31N 2009-08e | 2009/08/25.896 | 17.9(R) | 2009/08/26.400 | FeII | 2 | ||
| M31N 2009-09a | 2009/09/02.078 | 17.1(U) | 2009/08/18.454 | FeII | 3 | ||
| M31N 2009-10a | 2009/10/03.619 | 17.1(U) | 2009/09/30.494 | FeII | 4 | ||
| M31N 2009-10b | 2009/10/11.414 | 18.8(R) | 2009/10/10.376 | FeII | 5 | ||
| M31N 2009-11a | 2009/11/03.559 | 17.8(U) | 2009/10/31.321 | FeII | 6 | ||
| M31N 2009-11b22RN; 1997-11k=2001-12b=2009-11b. | 2009/11/06.523 | 18.6(R) | 2009/11/07.199 | … | 7 | ||
| M31N 2009-11d | 2009/11/19.194 | 18.1(R) | 2009/12/01.201 | FeII | 8 | ||
| M31N 2009-11e | 2009/11/21.138 | 18.8(Swift uvw2) | 2009/12/01.201 | FeII | 9 | ||
| M31N 2009-12a | 2009/12/22.488 | 16.6(U) | 2009/12/10.109 | … | 10 | ||
| M31N 2010-01a33According to CBET 2610, 2010-01a and 2010-12c are two different objects within . | 2010/01/11.13 | 17.6(R) | 2010/01/11.130 | FeII | 11 | ||
| M31N 2010-06a | 2010/06/28.014 | 18.1(R) | 2010/06/30.397 | FeII | 12 | ||
| M31N 2010-06b | 2010/06/28.014 | 19.1(R) | 2010/06/30.353 | FeII | 13 | ||
| M31N 2010-06c | 2010/06/26.084 | 17.8(R) | 2010/06/30.353 | … | 14 | ||
| M31N 2010-06d | 2010/06/24.02 | 19.5(Swift uvw1) | 2010/07/04.397 | FeII | 15 | ||
| M31N 2010-07a | 2010/07/07.036 | 20.6(Swift uvw1) | 2010/07/07.328 | FeII | 16 | ||
| M31N 2010-09a | 2010/09/04.552 | 17.2(U) | 2010/09/01.372 | FeII | 17 | ||
| M31N 2010-09b | 2010/09/30.412 | 17.7(R) | 2010/09/30.230 | FeII | 18 | ||
| M31N 2010-09c | 2010/09/03.30 | 18.7(U) | 2010/08/13.235 | FeII | 19 | ||
| M31N 2010-10a | 2010/10/05.551 | 17.6(R) | 2010/10/08.163 | FeII | 20 | ||
| M31N 2010-10b | 2010/08/19.055 | 18.9(R) | 2010/10/08.163 | FeII | 21 | ||
| M31N 2010-10c | 2010/10/13.557 | 17.8(U) | 2010/10/13.113 | FeII | 22 | ||
| M31N 2010-10d | 2010/10/29.478 | 17.8(U) | 2010/10/29.213 | FeII | 23 | ||
| M31N 2010-10e44RN; 1963-09c=1968-09a=2001-07b=2010-10e. | 2010/10/31.727 | 18.1(R) | 2010/11/01.158 | He/N | 24 | ||
| M31N 2010-10f55The nova 2010-10f is probably inside the Globular Cluster Bol 126. | 2010/10/11.10 | … | 2010/10/11.110 | … | 25 | ||
| M31N 2010-11a | 2010/11/23.05 | 18.2(Swift uvw1) | 2010/12/01.250 | He/N | 26 | ||
| M31N 2010-12a66Another recurrent burst of PT And. | 2010/10/01.15 | 16.7(U) | 2010/12/01.270 | FeII | 27 | ||
| M31N 2010-12b | 2010/12/11.095 | 16.7(U) | 2010/12/10.115 | … | 28 | ||
| M31N 2010-12c33According to CBET 2610, 2010-01a and 2010-12c are two different objects within . | 2010/12/11.095 | 17.2(U) | 2010/12/15.093 | He/N | 29 |
References. — (1) Rodríguez-Gil et al., 2009; Ovcharov et al., 2009; (2) Ovcharov et al., 2009; Henze et al., 2009b; Medvedev et al., 2009; (3) Henze et al., 2009a; Barsukova et al., 2009b; (4) Fabrika et al., 2009b; (5) Nakano & Yusa, 2009; Podigachoski et al., 2009b; Hornoch & Kusnirak, 2009; Fabrika et al., 2009a; Hornoch et al., 2009a; Nakano et al., 2009; Nakano & Itagaki, 2009; Yamaoka et al., 2009; Martignoni et al., 2009; Di Mille et al., 2009; Barsukova et al., 2009a; Henze et al., 2009b; (6) Nishiyama & Kabashima, 2009a; Burwitz et al., 2009; Hornoch et al., 2009c; (7) Nishiyama et al., 2009a; Henze et al., 2009d; Kasliwal, 2009; Henze et al., 2009c; Kasliwal et al., 2009; (8) Nishiyama & Kabashima, 2009b; Podigachoski et al., 2009d; Hornoch et al., 2009b; Podigachoski et al., 2009c; (9) Green, 2009; Pietsch et al., 2009b; Cagas, 2009; Kusnirak et al., 2009; Hornoch & Pejcha, 2009; Pietsch et al., 2009a; (10) Nishiyama et al., 2009b; (11) Burwitz et al., 2010c; Hornoch et al., 2010h, g; Green, 2010e; Pietsch & Henze, 2010a; Hornoch et al., 2010f; Burwitz et al., 2010d; Pietsch & Henze, 2010b; (12) Hornoch et al., 2010c, l, a, i, e; Henze et al., 2010c; Pietsch et al., 2010j; (13) Hornoch et al., 2010b, a, i; (14) Burwitz et al., 2010a; Pietsch et al., 2010d; Hornoch, 2010; Hornoch et al., 2010a, e; Burwitz et al., 2010b; (15) Pietsch et al., 2010e; Hornoch et al., 2010j; Pietsch et al., 2010f; Henze et al., 2010c; Barsukova et al., 2010; Pietsch et al., 2010j; (16) Hornoch & Zasche, 2010; Henze et al., 2010a; Hornoch et al., 2010a, i; Henze et al., 2010b, c; Pietsch et al., 2010j; (17) Yusa, 2010a; Shafter et al., 2010d; (18) Yusa, 2010b; Pietsch et al., 2010k; Shafter et al., 2010f, h; (19) Romadan et al., 2010; Shafter et al., 2010c; Krushinski et al., 2010; (20) Yusa, 2010c; Shafter et al., 2010h; Pietsch et al., 2010j; (21) Corral-Santana et al., 2010; Shafter et al., 2010i; (22) Nakano & Yusa, 2010; Shafter et al., 2010g; (23) Nishiyama & Kabashima, 2010; Sun et al., 2010; Hornoch et al., 2010d; Hornochova & Wolf, 2010; Shafter et al., 2010b; (24) Hornochova et al., 2010; Pietsch et al., 2010b; Shafter et al., 2010a; Pietsch et al., 2010g (25) Pietsch et al., 2010i; Henze et al., 2010d; Shafter et al., 2010e; (26) Pietsch et al., 2010h; Cao et al., 2010; Fabrika et al., 2010; (27) Zheng et al., 2010; (28) Green, 2010a; Koishikawa, 2010; Pietsch et al., 2010a; Green, 2010b, c; Yusa, 2010d; Koishikawa et al., 2010; Pietsch et al., 2010c; (29) Prieto et al., 2010a; Yusa, 2010e; Green, 2010d, f; Prieto et al., 2010b;
| Name | Epochs | UT start | UT end |
|---|---|---|---|
| M31N 2009-09a | 63 | 2009/08/20.429 | 2009/10/15.707 |
| M31N 2009-10a | 13 | 2009/10/02.629 | 2009/10/21.457 |
| M31N 2009-10b | 22 | 2009/10/08.587 | 2009/11/15.725 |
| M31N 2009-11b | 63 | 2009/08/20.429 | 2009/11/15.725 |
| M31N 2010-06a | 13 | 2010/08/12.894 | 2010/08/21.998 |
| M31N 2010-06b | 13 | 2010/08/12.894 | 2010/08/21.998 |
| M31N 2010-06d | 13 | 2010/08/12.894 | 2010/08/21.998 |
| M31N 2010-07a | 13 | 2010/08/12.894 | 2010/08/21.998 |
| Observation UT | |||
|---|---|---|---|
| Novae | Spectrum | X-Ray | Reference |
| M31N 2009-08e | 2009/09/18.014 | Medvedev et al.,2009 | |
| M31N 2009-09a | 2009/09/18.18 | Barsukova et al.,2009b | |
| M31N 2009-10a | 2009/10/09.91 | Fabrika et al.,2009b | |
| M31N 2009-10b | 2009/10/09.820 | Fabrika et al.,2009a | |
| 2009/10/15.5 | Yamaoka et al.,2009 | ||
| 2009/10/19.936 | Barsukova et al.,2009a | ||
| M31N 2009-11a | 2009/11/25.32 | Hornoch et al.,2009c | |
| M31N 2009-11b | 2009/11/08.35 | Kasliwal,2009 | |
| 2009/11/09.82 | Kasliwal et al.,2009 | ||
| M31N 2009-11d | 2009/11/21.31 | Hornoch et al.,2009b | |
| M31N 2009-11e | 2009/11/22.19 | Hornoch & Pejcha,2009 | |
| M31N 2010-01a | 2010/01/13.08 | Hornoch et al.,2010h | |
| 2010/01/15.09 | Hornoch et al.,2010g | ||
| M31N 2010-06a | 2010/07/19 | Hornoch et al.,2010e | |
| M31N 2010-06b | 2010/07/19 | Hornoch et al.,2010e | |
| M31N 2010-06d | 2010/08/08.86 | Barsukova et al.,2010 | |
| M31N 2010-07a | 2010/07/19 | Hornoch et al.,2010e | |
| M31N 2010-09a | 2010/09/07.23 | Shafter et al.,2010d | |
| M31N 2010-09b | 2010/10/01.39 | Shafter et al.,2010f | |
| 2010/10/06.40 | Shafter et al.,2010h | ||
| M31N 2010-09c | 2010/09/14.23 | Shafter et al.,2010c | |
| M31N 2010-10a | 2010/10/06.38 | Shafter et al.,2010h | |
| M31N 2010-10b | 2010/10/28.31 | Shafter et al.,2010i | |
| 2010/11/03.31 | Shafter et al.,2010i | ||
| 2010/11/11.28 | Shafter et al.,2010i | ||
| M31N 2010-10c | 2010/10/17.35 | Shafter et al.,2010g | |
| M31N 2010-10d | 2010/10/30.31 | Shafter et al.,2010b | |
| M31N 2010-10e | 2010/11/04.32 | Shafter et al.,2010a | |
| 2010/11/15.16 | Pietsch et al.,2010g | ||
| 2010/11/17.09 | Pietsch et al.,2010g | ||
| M31N 2010-10f | 2010/11/13.285 | Shafter et al.,2010e | |
| 2010/11/03.04 | Pietsch et al.,2010i | ||
| 2010/11/06.20 | Pietsch et al.,2010i | ||
| 2010/11/07.06 | Pietsch et al.,2010i | ||
| M31N 2010-11a | 2010/12/05.74 | Fabrika et al.,2010 | |
| M31N 2010-12a | 2010/12/30.24 | this paper | |
| M31N 2010-12c | 2010/12/30.25 | this paper | |
2.2. PTF
PTF (Law et al., 2009) employs the 1.2-m Oschin Telescope at Palomar Observatory with an array of twelve CCD chips, each having 4K2K pixels. One of the chips is dead for unknown reasons. The pixel size is /pixel and thus the total FoV is 7.2 square degree.
2.2.1 Survey Observation
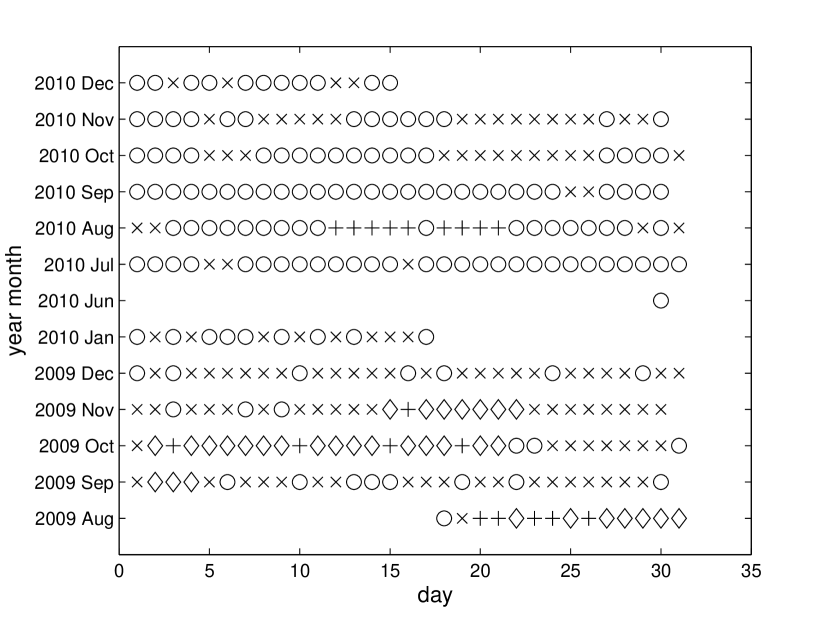
The time coverage of PTF observations of M31 during the 2009 and 2010 seasons is shown in Figure 2. The first observing season is from 2009 August 18 to 2010 January 17 and the second is from 2010 June 30 to 2010 December 15. From 2010 August 28 to 2010 September 7, PTF observed M31 with a fast cadence of about ten minutes. All PTF images were taken with a R-band filter. The average seeing during the two seasons is with a median value of . We removed less than of the images with seeing worse than , because the high stellar density in M31 leads to strong overlaps among adjacent objects under bad seeing conditions. Our final image database samples over seven hundred epochs on 7987 individual CCD images.
2.2.2 Data Reduction and Photometry
All images were processed through the PTF LBL pipeline (see Law et al., 2009),
obtaining astrometric solutions of accuracy. The calibration of
relative photometry proceeded as follows. We first use SExtractor to
make a source catalog for each image. We then choose the catalog with the largest number of
sources as reference. Then, other non-reference catalogs are
spatially matched to the reference using source positions and forced to
agree with the reference photometry after non-constant sources are removed
with a standard outlier procedure222NIST/SMATCH e-Handbook of
Statistical Methods at
http://www.itl.nist.gov/div898/handbook/. The
resulting photometric uncertainty is usually around mag. The absolute
calibration is achieved by matching the reference sources to sources in the
catalog presented in Massey et al. (2006).
Photometry is also done with SExtractor. Background is estimated in a region of 2020 centered at each target. Fluxes are measured within a Kron-like elliptical aperture. The first order moment of each object determines the Kron radius (Kron, 1980) and the second order moment determines ellipticity and position angle. The aperture has an area of . For a null detection, a 3- limiting magnitude is estimated.
In order to assess the quality of photometric results from SExtractor, we constructed light curves of three novae (M31N 2009-09a, M31N 2009-10a and M31N 2009-11a) with three methods: 1) the one we described above; 2) aperture photometry with an aperture radius of seeing and with constant local background; 3) aperture photometry with an aperture radius of seeing and with local background estimation by linear regression. All three methods show consistent magnitude measurements. Hence we adopt the first method.
2.2.3 Photometric and Spectroscopic Follow-up
Photometric follow-up of M31N 2010-11a was triggered for the Palomar 60-inch telescope (Cenko et al., 2006) on 2010 December 4. On 2010 December 30, we also used the Low Resolution Imaging Spectrometer (LRIS; Oke et al., 1995) mounted on the Keck I telescope to obtain spectra of M31N 2010-12a and 2010-12c. These spectra were obtained with a configuration of the 560 dichroic, the 400/3400 grating in the blue side and the 400/8500 grating in the red side with a central wavelength of .
2.3. GALEX
GALEX is a wide-field imaging UV space telescope that was originally launched with near-UV (NUV and far-UV (FUV) detectors. Unfortunately, the FUV detector failed before the start of the PTF survey of M31 The NV detector effective wavelength is Å and the band width is Å (Martin et al., 2005; Morrissey et al., 2007). This channel has a FoV of square degree (Morrissey et al., 2007).
2.3.1 GALEX Observation Summary
The visibility of M31 for GALEX is defined by the Sun, Moon and Earth-limb constraints that limit the observations more than for ground-based observatories. The result is that GALEX was able to intensively monitor M31 in several campaigns that overlap with the PTF campaigns of 2009 and 2010 (2009 August 08 to 2009 September 04; 2009 October 02 to 2009 October 21; 2009 November 15 to 2009 November 22; 2010 August 12 to 2010 August 21). Figure 2 illustrates GALEX temporal coverage and its overlap with PTF. A field centered in M31 is monitored daily, while ten outskirt fields in M31 are observed every other day. So we have fifty-one epochs of the center field while about 2227 epochs of the outskirt fields. The exposures were all taken during single orbit pointings and thus have durations close to 1500 seconds with a range from 740 seconds to 1703 seconds. Table 1 summarizes parameters of observations.
2.3.2 Photometry
2.4. Data from Other Sources
For completeness in optical and UV bands, we incorporate photometric measurements of novae from ATel and CBET reports (see the reference column in Table 2.1). This includes optical photometry in R, B, V, r’, i’ and H bands as well as unfiltered data. We also include data published in Shafter et al. (2011a) where several novae in 2009 are well-sampled. The UV data in ATel reports are mainly obtained by Swift (Gehrels et al., 2004). For consistency of data between GALEX and Swift, all Swift data are calibrated onto the AB magnitude system (Siegel et al., 2010). When data from different sources are used, due to difference of filters, data may have systematical errors among different projects.
In addition, we include X-ray and spectroscopic information of novae in M31 from Swift from either ATel reports or our own analysis (see Table 4).
2.5. Missed Novae
During the two seasons presented here, we did not find three announced novae in the PTF archive: M31N 2009-10c, M31N 2009-11c and M31N 2010-07b.
M31N 2009-10c took place at , (J2000), less than thirty arcseconds from the center of M31. This nova reached maximum light, i.e., , on Oct 9, 2009 (Podigachoski et al., 2009a). PTF observed M31 on Oct 10, 2009. In the vicinity of the nova position, if we fit a constant background, the mean count of with a standard deviation of . Given that the seeing then was about three arcseconds and that the zeropoint is , the 3- limiting magnitude is . If the background is fit with a plane, the standard deviation is roughly and the limiting magnitude is . Thus we did not detect this nova in the images. In the subtraction image, the circle of thirty arcseconds in radius in the center of M31 is excluded in the subtraction algorithm where the algorithm does not work well. As a result, we missed this nova in our PTF data.
There are gaps of forty arcseconds between adjacent CCDs. M31N 2009-11c unfortunately fell in the gap between two adjacent CCDs.
M31N 2010-07b had a peak luminosity of mag on 2010/06/04.135 and slowly decayed (Hornoch et al., 2010k), which is below the single-image detection threshold of PTF. The second observing season of PTF started at the end of June (see Figure 1), so we do not have enough images to co-add for detection of this nova.
Admittedly, we did not carry out a real-time search of novae in M31 in the first two seasons of PTF. Our nova sample inherits the sensitivity and incompleteness of those projects that discovered these novae.
2.6. Special Novae
2.6.1 M31 2010-09c
This nova has a faint and close neighbor with R within two arcseconds. In SDSS Data Release 8, we found two nearby sources within two arcseconds. After color transformation (Jordi et al., 2006), the neighbors have R and R, giving a total magnitude of that is consistent with our measurements. The uncertainty caused by the neighbors has been included in the nova light curve. The spectroscopic confirmation in (Shafter et al., 2010c) identified the M31N 2010-09c as a real nova of Fe II type.
2.6.2 M31 2010-10f
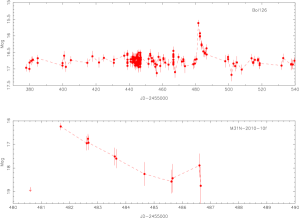
This nova is spatially associated with the M31 globular cluster Bol 126 (Wirth et al., 1985). In Figure 4, we clearly see a brightening of the globular cluster by about one magnitude on around 2010 October 10 (Julian Date: 2455480). The luminosity of the globular cluster before the nova is . The light curve of the nova is obtained by subtracting the globular cluster brightness. One possible reason for the large uncertainty in the photometry measurements is that the nova is only a few pixels away from the edge of the CCD.
2.6.3 M31N 2010-01a and M31N 2010-12c
These two novae occurred within one arcsecond of each other, a separation which is less than the typical spatial resolution of PTF (10). A highly accurate astrometric solution shows that they are indeed two separate objects (Green, 2010f).
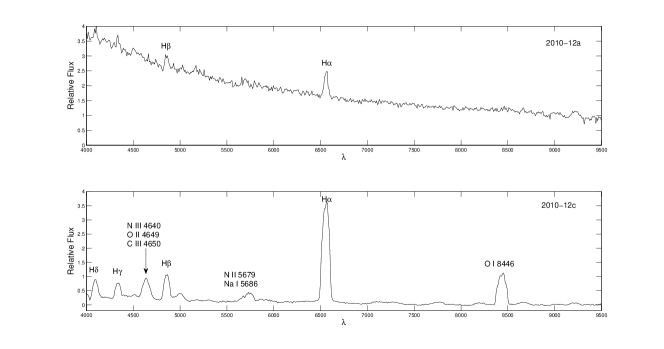
We obtained a spectrum of 2010-12c with LRIS on 2010 December 30 (Figure 3, bottom panel). The spectrum shows a weak continuum superposed with many emission lines, illustrating that the nova has already entered the nebular phase. We identified H, H, H, H, OI 8446 and several He and N lines. H has a slight P Cygni profile. The emission lines suggest the nova is of the He/N type. After fitting the emission lines with a Gaussian profile, we find that H is centered at Å, H at Å, H at Å, and OI 8446 at Å, suggesting a blueshifted velocity in the range from to km s-1. On the other hand, the systemic velocity of M31 is km s-1. The nova lies about northeast of the center of M31. The HI 21 cm line (Chemin et al., 2009; Corbelli et al., 2010) suggests a rotation velocity of km s-1 receding from us. However, the nova is apparently close to the center of the galaxy, and therefore may not share the motion of the disk measured by the HI 21cm line. Another measurement of a nearby planetary nebula (Merrett et al., 2006) at and (J2000) suggests a radial velocity of km s-1 along the line of sight. Consequently, we conclude that 2010-12c is a real nova in M31.
Additionally, these two novae have two more historical neighboring novae within : nova 30 (discovered in 1986) from Ciardullo et al. (1987) and M31N 2009-08a. Generally speaking, we observed more novae in the central region of M31 than in outskirts. This might result from the high stellar density in the center of the galaxy.
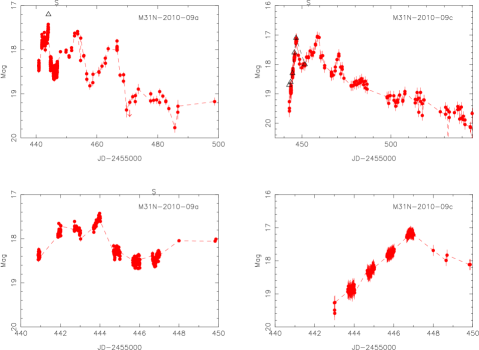
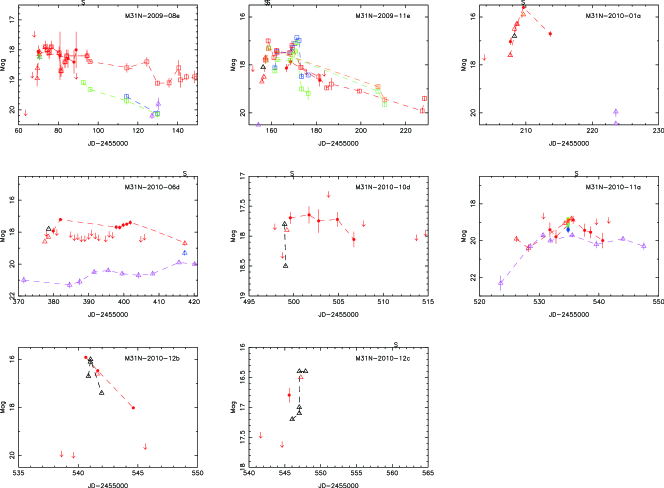
3. Light Curves of Classical Novae
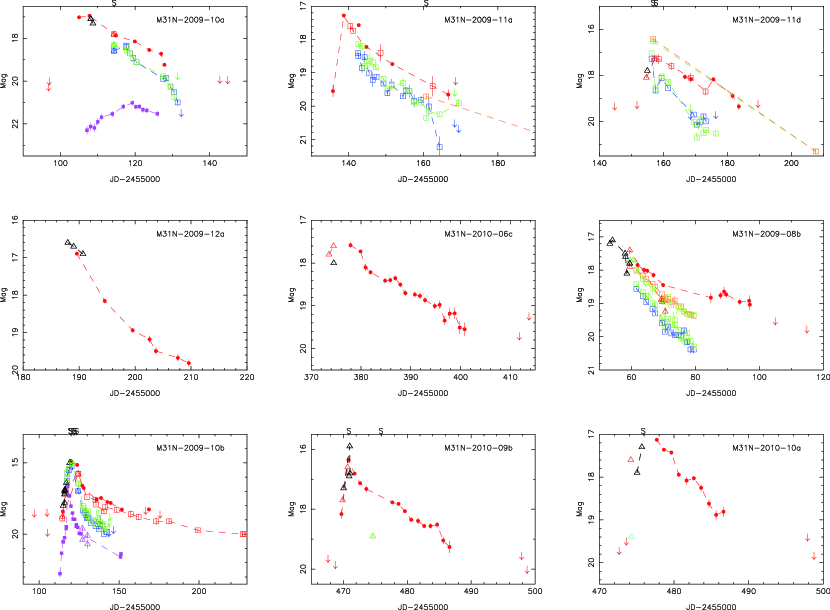
Except three recurrent events, light curves of twenty-six classical novae are presented in Figure 5 to 9. An electronic version of the PTF and GALEX data can be found online333http://www.astro.caltech.edu/ycao/m31novae/index.html in a machine-readable format. An example of M31N 2010-12a is illustrated in Table 5.
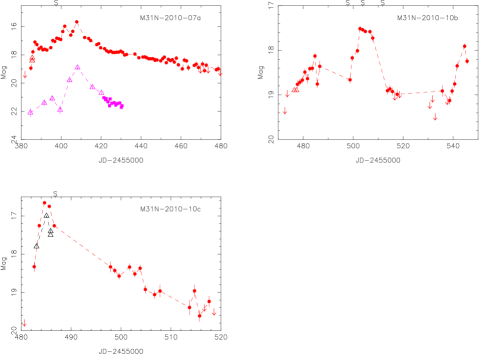
The nova light curves are presented in groups based on their features described below. Figures 5 presents novae with smooth decline. Figure 6 illustrates novae with jittery decline. Novae with well-sampled rise stages appear in Figure 7. Figure 8 highlights two novae recorded during the PTF 10min-cadence observations where their rise histories were recorded in great detail. Figure 4 shows the light curves of the only globular cluster nova M31N 2010-10f and its host Bol 126. All other under-sampled light curves are collected in Figure 9.
Table 6 summarizes the photometric and morphological features of the novae.
| Julian Date | Magnitude | Magnitude Error1199.000 in Magnitude Error indicates that a 3 upper limit is given in Magnitude. |
|---|---|---|
| 2455530.702 | 20.190 | 99.000 |
| 2455531.770 | 16.763 | 0.030 |
| 2455532.780 | 15.581 | 0.023 |
| 2455532.825 | 15.561 | 0.025 |
| 2455535.681 | 16.013 | 0.024 |
| 2455537.578 | 16.325 | 0.024 |
| 2455537.622 | 16.346 | 0.025 |
| 2455538.577 | 16.526 | 0.024 |
| 2455538.621 | 16.496 | 0.025 |
| 2455539.577 | 16.636 | 0.026 |
| 2455539.620 | 16.638 | 0.025 |
| 2455540.615 | 16.721 | 0.027 |
| 2455540.659 | 16.776 | 0.026 |
| 2455541.613 | 16.817 | 0.027 |
| 2455541.656 | 16.899 | 0.031 |
| 2455544.593 | 17.243 | 0.029 |
| 2455544.639 | 17.175 | 0.032 |
| 2455545.593 | 17.283 | 0.038 |
| 2455545.637 | 17.303 | 0.034 |
3.1. Morphological classification
The shape of each light curve can be characterized by several parameters: the rise rate, the rise time to the maximum magnitude, the rise behavior, the maximum magnitude, the decline rate that is represented by defined as the time interval during which a nova decays from its maximum by magnitudes, and the decline behavior. Since PTF samples the M31 nova luminosity distribution down to M (see §1) and the peak absolute magnitude of a nova can range from to , we use to indicate the decline rate. In our measurements, is estimated by linear interpolation between adjacent measurements. Other parameters are defined as follows: the rise rate is the mean rate from the first detection to the first local maximum; the rise time is the interval from first detection in PTF to its global maximum. All measurements are done with PTF R-band data.
For novae inside our Galaxy, Strope et al. (2010) classified the diverse light curves morphologically according to their evolution of decline. With a median coverage extending to 8.0 mag below peak, the authors grouped nova light curves into seven classes. In their sample of 93 nova light curves, decline smoothly, have plateau phase, show dust dips, rebrighten with a cusp-shaped secondary maxima, oscillate quasi-sinusoidally on smooth decline, are flat-topped and have irregular jitters or flared during decline. However, PTF is unable to follow M31 novae to such late times in the light curve evolution. We, instead, roughly classify our M31 novae into two major classes: S-class for smooth light curves and J-class for jittery light curves or for light curves with flares superposed on the decline. Statistically in our nova sample, show S-class decline and belong to the J-class. Given that our sample is quite small, this result is roughly consistent with the Galactic population. We do not see any flat-topped nova.
Similarly, due to the high cadences, PTF sampled the rising stages of several novae very well. This enables us to employ the same S-J classification to describe the rising parts of the light curves (see Table 6). We find that the S-class novae rise very fast (e.g., M31N 2010-09b rose within two days) while the J-class novae rise more slowly (e.g., M31N 2010-10b took thirty days to reach its maximum). But we do not see any relation between the rise time and peak magnitudes. Luminous M31N 2010-09b and subluminous M31N 2009-11a rose rapidly while luminous M31N 2010-07a and subluminous M31N 2009-09a both rose very slowly.
During a very-high-cadence (tens of minutes) experiment in PTF, we observed the rising stages of M31N 2010-09a and M31N 2010-09c in unprecedented detail, as shown in the bottom panels of Figure 8. The rise of both novae is smooth over a timescale of tens of minutes.
3.2. Super-Eddington Phase
Some novae around maximum exhibit a super-Eddington phase. Theorists (e.g., Shaviv, 2001) model this phase with a porous structure in the nova wind that reduces the effective opacity and raises the Eddington luminosity. Kato & Hachisu (2005) produced a light-curve model based on this idea that successfully matched the super-Eddington phase of Nova V1974 Cyg, and demonstrated the importance of the relationship between the optical and UV light curves. They isolated a portion of the UV continuum near 1455 Å that had a duration that was well correlated with the decline rate of the nova in the optical. This continuum UV light curve combined with the model of how the UV light is reprocessed into the optical light curve allows an estimate of the precursor WD mass and distance to be made, based on certain assumptions about the chemical composition of the envelope (Kato & Hachisu, 2007).
One might assume that the clumpy wind responsible for the lower opacity and higher Eddington luminosities of the brightest novae might produce other observable signatures. Small-scale structure in the rising light curve could be observed as the clumps are non-uniformly heated and accelerated by the ongoing eruption and as radiation is diffused through them. We have very high-cadence observations of the rising phases of two novae (2010-09a and 2010-09c), both of which have a peak brightness fainter than -7.5 and thus are probably not super-Eddington novae. Nonetheless, while 2010-09c exhibits a very smooth and steady rise and a smooth decline, consistent with a uniform nova wind, 2010-09a has considerable structure in its light curve with multiple peaks both near and after the maximum light. Our observations of 2009-09a, 2010-07a, 2009-09a and 2009-09c also show several peaks around maxima. The multiple peaks could arise when different winds are blown out from the center successively during an outburst. Each peak is formed when the pseudo-photosphere meets the shock wave at the head of the corresponding wind. We conclude that structures in the nova wind and thus in the light curve can arise regardless of the luminosity of the outburst.
4. NOVAE IN GLOBULAR CLUSTERS
M31N 2010-10f was spatially associated with the globular cluster (GC) Bol 126 to within one arcsecond. A supersoft X-ray source (SSS) was also reported in the vicinity by Henze et al. (2010d). This event is similar to M31N 2007-06b (Shafter & Quimby, 2007) in Bol 111 which was confirmed spectroscopically during the outburst. A SSS counterpart was also found for this object (Henze et al., 2009e). They are the only two events in M31 that are associated with GCs.
Several previous searches for GC novae obtained null results (Ciardullo et al., 1990b; Tomaney et al., 1992). We examined our PTF image database at the positions of all confirmed M31 GCs from the Revised Bologna Catalog (V.4, Dec 2009, Galleti et al., 2004). Magnitudes of these GCs range from R13 mag to R20 mag. We do not find any other GC novae candidates. Given an effective survey time of M31 in PTF approximating one year, we obtain a GC nova rate of about 1 yr-1.
Is the nova rate enhanced in GCs? The total stellar mass of M31 is (Tamm et al., 2007). Using the highest published nova rate for M31 of 65 yr-1 from Darnley et al. (2006), we estimate a maximum global specific nova rate of yr-1 in M31. Given a typical GC mass of and about seven hundred confirmed M31 GCs, the nova rate in the M31 GC system is yr-1. We conclude that the M31 GC specific nova rate is not significantly higher than the M31 galaxy specific nova rate.
LMXBs – mass transferring binaries with a neutron star receiving matter from a companion – can be viewed, in some ways, as surrogates for CNe and RNe. Since the early days of X-ray astronomy it has been known that at least in our Galaxy that the brightest LMXBs (per unit mass) are nearly two orders of magnitude larger than that for the disk of the Milky Way. This trend appears to be even more acute for M31 (Trudolyubov & Priedhorsky, 2004). In part this may be because M31 possesses a more extensive cluster system than our own Galaxy. Thus, naively, we would expect far more CNe and RNe in the globular cluster system of M31. Over the period of investigation (2009-2010), a total of three RNe were found in the disk/bulge of M31. If we assume the mass fraction of globular clusters is , we would have expected to see a similar number in the cluster system. Within small number systems, the detection of RN associated with the cluster would be consistent with this expectation. Separately, given that seven hundred CNe are known, over 2009 and 2010 we should have seen many tens of CNe in the globular clusters. but only one was found. Indeed, over the last hundred years only one CN that has been associated with a globular cluster of M31 has been spectroscopically confirmed (Shafter & Quimby, 2007). In summary we cannot arrive at a sensible conclusion with the presently available data.
5. Recurrent Novae
| Rising rate | Rising Time | Rising | Decline | R-Band Peak | ||
|---|---|---|---|---|---|---|
| Nova | (mag/day) | (days) | Morphology | (days) | Morphology | Magnitude |
| 2009-08b | … | … | … | 35 | J | 17.76 |
| 2009-09a | … | 26 | J | 79 | J | 17.26 |
| 2009-10a | … | … | … | 20 | S | 16.95 |
| 2009-10b | 0.6 | 5 | S | 8 | S | 14.84 |
| 2009-11a | 0.8 | 3 | S | 22 | S | 17.23 |
| 2009-11b | … | … | … | 37 | J | 18.25 |
| 2009-11d | … | … | … | 17 | J | 17.7211The maximum magnitude is from ATel reports because PTF missed the peak magnitude. |
| 2009-12a | … | … | … | 10 | S | 16.88 |
| 2010-06a | … | … | … | 31 | J | 16.88 |
| 2010-06b | 0.4 | … | … | 8 | J | 17.62 |
| 2010-06c | … | … | … | 19 | S | 17.57 |
| 2010-07a | 0.7 | 26 | J | 15 | S | 15.65 |
| 2010-09a | 0.5 | 14 | J | 40 | J | 17.42 |
| 2010-09b | 1.6 | 2 | S | 10 | S | 16.36 |
| 2010-09c | 0.4 | 18 | J | 57 | J | 17.04 |
| 2010-10a | … | … | … | 9 | S | 17.03 |
| 2010-10b | … | 30 | … | 41 | … | 17.44 |
| 2010-10c | 1.0 | 3 | S | 20 | S | 16.65 |
| 2010-10e | … | … | … | 5 | S | 17.84 |
| 2010-12a | 1.0 | 3 | S | 13 | S | 15.56 |
| 2010-12b | … | … | … | 3 | S | 15.70 |
According to the catalog maintained by Pietsch (2010), 26 RNe in M31 are known. During the two seasons we report on, three recurrent events were reported: M31N 2009-11b, M31N 2010-10e and M31N 2010-12a. Figure 10 presents their light curves. Besides these, we examined the PTF archive at the positions of more than 800 old novae in M31 from the list of Pietsch (2010) in order to find more recurrent events. None were found. Therefore, given an effective observing time of roughly one year in PTF, the recurrent nova rate in M31 is novae per year.
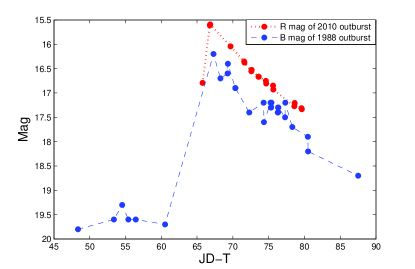
We examined M31N 2010-12a in some detail, as another outburst of PT And. This object has recorded outbursts in 1957, 1983, 1986, 1988 and 1998. Alksnis & Zharova (2000) collected its previous outbursts and found that all light curves can be fit by one template. The average decline rate of previous outbursts is 0.09 to 0.11 mag per day. The light curve of this most recent outburst (M31N 2010-12a) can also be fit by the template. Figure 11 shows the similarity between light curves of the recent and 1988 outbursts. The decline rate of the recent outburst is around 0.10 mag per day consistent with previous ones. This invariance property is also observed in Galactic RNe (Schaefer, 2010). Such characteristics of RNe suggests that RN outbursts only depend on system parameters like the WD mass and its composition.
Because of its luminous and frequent outbursts, PT And was assumed to be a dwarf nova inside the Milky Way (Alksnis & Zharova, 2000). However, no direct evidence of this object’s nature was available until we obtained a spectrum of its most recent outburst with LRIS in Keck-I telescope. This spectrum (see the top panel of Figure 3) shows a very blue continuum superposed with prominent H and H lines as well as several weak Fe lines. Fitting the red part of the spectrum with a Planck function yields a temperature of . We fit the H and H lines with Gaussian profiles and obtained the following observed wavelengths: H is centered at Åand H at Å. These correspond to blue-shifts with radial velocities of km s-1 and km s-1. The systemic velocity of M31 is km s-1. We assume that this object is not located in the disk of M31, thus we do not take the rotation velocity of M31 disk into account. We conclude that the blue-shifts are roughly consistent with the motion of M31. Our spectrum evidently supports the conclusion that PT And resides in M31 instead of in the Milky Way. This can also be tested by observing its proper motion. It is of only galactic sources that we may observe proper motion. In addition, the existence of weak Fe lines suggests the nova is of Fe II type.
The association of PT And with M31 leads to a peak absolute magnitude of about -9, which makes it the brightest RN ever known.
The decline rates of RNe vary over a large range in M31. M31N 2009-11b has days and M31N 2010-10e has days. Consider that 2010-12a has a decline rate of mag/day, so its is possibly around twenty days. The values of Galactic RNe also range from one day to fifty days (Schaefer, 2010).
6. UV Light Curves of Novae
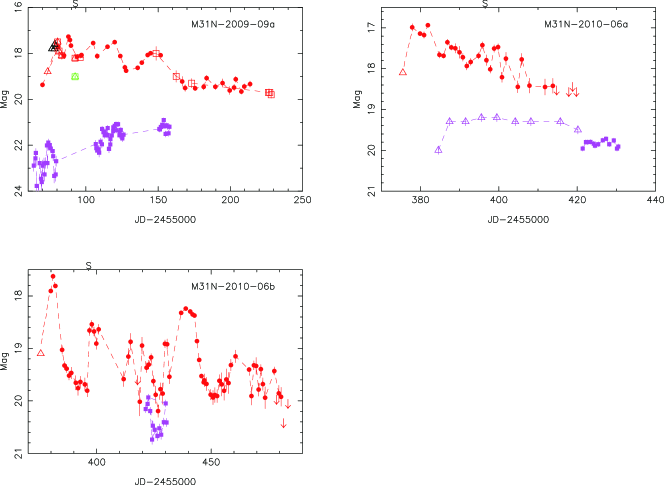
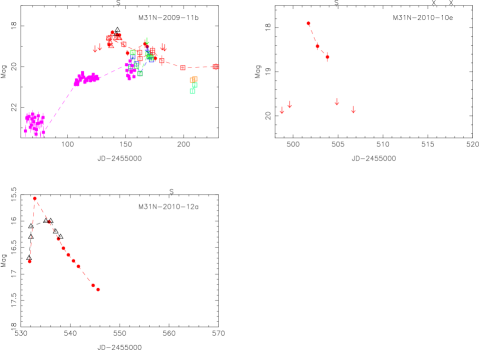
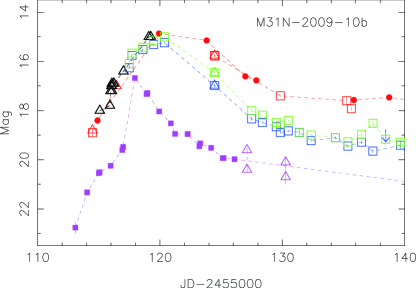
Theoretically, the UV emission after the optical maximum light is characterized by a delayed UV peak after the optical peak, because most UV photons are absorbed and re-emitted in the optical in the outer envelope (Kato & Hachisu, 1994; González-Riestra & Krautter, 1998; Cassatella et al., 2002). However in our sample, we see some deviation from this general picture: 2009-10b has a peak in the GALEX NUV over two days prior to its peak in the optical (see Figure 12). The recurrent nova 2009-11b was seen in the GALEX NUV about forty days before it was visible in optical bands (although this could be due to cadence and weather, see Figure 10). The nova 2010-06d was detected in Swift (Pietsch et al., 2010f) about six days before optical detection (see Figure 9). Swift also detected 2010-11a several days before optical detection (Pietsch et al., 2010h; Cao et al., 2010, ; also Figure 9). For 2010-07a, the optical and UV maxima were nearly simultaneous as measured by PTF and by Swift (Henze et al., 2010b, see Figure 7).
Admittedly the detection in the optical and UV involves many factors like survey sensitivities, temporal coverage and observing weather. In a few cases, however, it is clear that the UV peak coincides with or precedes the optical peak. These cases demonstrate that not all UV photons are re-processed and that the absorption in the UV will vary considerably depending on factors such as physical geometry or chemical abundances in the envelope. These variations will produce a range of optical/UV peak offsets and luminosity ratios. We also point out that multi-band optical data show that three of these UV novae have red colors: 2009-10b has at decline (Shafter et al., 2011b); 2009-11b has at decline (Shafter et al., 2011b); 2010-11a has around its optical peak from our photometric follow-up.
6.1. M31N 2009-10b and M31N 2010-11a
The novae 2009-10b and 2010-11a are two peculiar cases in that their UV peaks lead the optical maxima by a few days. Moreover, at the early decay stage of UV emission, the optical colors of both novae look quite red.
Of the two, 2009-10b is brighter, has better light curve coverage in PTF, GALEX and other bands, and is thus a better case for further examination. Figure 12 zooms in on the early multi-band light curve. Table 8 lists the rise rate, maximum magnitudes, dates and decline rates by and in the NUV, B, V and R bands. The NUV data are from GALEX. Part of R band data are from PTF. B, V and part of R band data are published in Shafter et al. (2011b). We can see clearly that the NUV peak is two-to-three days earlier than the B, V and R peaks. The rise rates in B, V and R band are consistent while NUV emission rises swiftly. The decline rates of NUV, B and V are similar while R band emission decays slower.
2010-11a is possibly the faintest nova in our sample with a peak observed magnitude of R (see Figure 9). It was first detected by SWIFT (Pietsch et al., 2010h) and then we reported its optical counterpart (Cao et al., 2010). The strong UV emission peaked several days prior to its optical maximum. Near its optical maximum, we carried out a photometric follow-up in i’, r’, g’ and B bands with the Palomar 60-inch telescope and observed that this nova had red optical colors, as shown in Table 7.
The UV observations and the color information suggest that UV and optical emission originates from different radiative regions because they cannot be simply interpreted as the thermal radiation of a receding spherical photosphere which has a large optical depth in local thermal equilibrium. Because UV emission is only generated deep inside the envelope, the result may suggest that the envelope has holes from which we can see deep inside.
The models of Shaviv (2001); Kato & Hachisu (2005, 2007) propose a reduced effective opacity of the nova envelope to explain the super-Eddington phase, resulting from a porous structure of the envelope caused by its fluid instability. We may use a similar scenario of asphericity of nova outbursts to qualitatively explain the red UV novae. UV photons are generated deep under the envelope at the surface of the WD. In the envelope, the bottom is heated to very high temperatures by thermonuclear runaway, and thus instabilities like Rayleigh-Bnard convection are likely to occur. This instability causes the mass distribution in the nova envelope to deviate from a spherical distribution. Thus, along some lines of sight to the center of the outburst, the mass is less and so is the opacity. The UV photons then escape from these directions and are observed by us if we are observing along one of these lines of sight. The red optical emission still comes from the reprocessing of the envelope in the other directions. The ratio between the UV and optical fluxes reflects the angular size of the cone. If the instability produces an extreme feature with very low mass and very low opacity along the line of sight, we can observe the central UV photons directly. This may be what we are observing in 2009-10b and 2010-11a. Another possible explanation could be very low abundances of chemical species that absorb in the UV, although this may not explain the red optical colors.
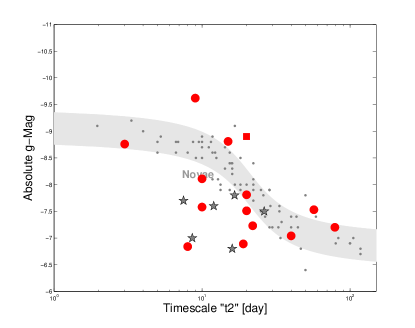
The uniqueness of the UV-optical light curves of 2009-10b and 2010-11a suggest either their super-Eddington phases or their chemical abundances (or both) are very different from the majority of novae (Cassatella et al., 2002). They may possibly represent a population that deviates from any empirical relation derived from large nova samples, such as MMRD relation. In fact, 2009-10b is a luminous outlier of the MMRD relation (see Figure 13). Unfortunately, due to its faintness, we were unable to measure the decline rate for the nova 2010-11a.
| JD-2455500(days) | Bands | Magnitude | Magnitude Error |
|---|---|---|---|
| 34.817 | i’ | 18.80 | 0.10 |
| 34.819 | i’ | 18.84 | 0.09 |
| 34.822 | i’ | 18.89 | 0.09 |
| 34.824 | r’ | 18.91 | 0.08 |
| 34.826 | r’ | 19.04 | 0.09 |
| 34.838 | r’ | 18.96 | 0.08 |
| 34.831 | r’ | 18.89 | 0.09 |
| 34.833 | r’ | 19.04 | 0.11 |
| 34.835 | g’ | 19.20 | 0.09 |
| 34.838 | g’ | 19.32 | 0.11 |
| 34.840 | g’ | 19.12 | 0.09 |
| 34.842 | B | 19.40 | 0.13 |
| 34.844 | B | 19.37 | 0.16 |
| 34.847 | B | 19.43 | 0.15 |
| Bands | NUV11GALEX observations; | B22data from Shafter et al. (2011b); | V22data from Shafter et al. (2011b); | R33data from PTF and Shafter et al. (2011b). |
| rise rate (mag/day) | 1.2 | 0.4 | 0.4 | 0.7 |
| peak magnitude | 16.68 | 15.24 | 15.00 | 14.84 |
| peak date (JD-2455110) | 7.95 | 10.37 | 10.37 | 9.95 |
| (days) | 3 | 5 | 5 | 8 |
| (days) | 7 | 7 | 7 | 17 |
7. MMRD Revisited
Novae exhibit a relation between the maximum magnitude and the rate of decline (MMRD della Valle & Livio, 1995; Kasliwal et al., 2010). We can assess this relation with our nova sample in M31.
One of main issues in evaluating the MMRD relation is estimating the dust extinction. A multitude of methods using color and Balmer decrement have been used in literature to estimate the extinction (Darnley et al., 2006; Kogure, 1961; Kasliwal et al., 2010). The PTF nova observations, however, provide no color information, being done only in the R band. Thus, we apply a mean foreground dust extinction. The foreground extinction of M31, mag (Schlegel et al., 1998), leads to
| (1) |
For a better comparison with previous researches (e.g., Kasliwal et al., 2010), following Shafter et al.(2009), we use the colors of an A5V star () to transform magnitudes to magnitudes (Jordi et al., 2006).
The MMRD relation is presented as the gray band in Figure 13. We overplot on this diagram our M31 novae (red points) and compare them to the novae from della Valle & Livio (1995) (gray points) and Kasliwal et al. (2010) (gray stars). Without a local extinction correction, most of our peak magnitudes are underestimated. In Kasliwal et al. (2010), the total extinction correction for M31 novae is roughly except that two of them () have a correction of . It is possible that local extinction for most novae in our sample is small.
In Figure 13, we can see five significant outliers from the MMRD region in our sample. The brightest outlier is M31N 2010-10b (see discussion in Section 6.1). The other luminous outlier is PT And (M31N 2010-12a). M31N 2009-12a, M31N 2010-06b and M31N 2010-06c lie in the faint and fast-decline rate zone below the MMRD relation shown by the gray band. Kasliwal et al. (2010) also found several novae in this zone. Kasliwal et al. (2010) proposed the possibility that the outliers may be RNe. However, none of the three faint outliers in our sample are known to be recurrent. The remaining novae reside roughly along the MMRD region.
8. Conclusion
In this paper, we tabulate the photometric measurements of twenty-nine classical novae in M31 from PTF data and present their optical light curves, eight of which also have joint UV-optical light curves from both PTF and GALEX. The main findings are as follows:
-
1.
We detected three recurrent novae. They show similar properties to recurrent novae in the Galaxy (Schaefer, 2010). We obtained a spectrum of the recent outburst of PT And (also known as M31N 2010-12a). While previously identified as a dwarf nova in the Milky Way (Alksnis & Zharova, 2000), we find the blueshifts in our spectrum to be consistent with the event being a recurrent nova in M31. The light curve of 2010-12a resembles those of previous outbursts, suggesting the same physical conditions in the recurrent outbursts. Our search at all other historical nova positions finds no additional outburst candidates. From this we derive a recurrent nova rate of about three per year in M31.
-
2.
The rise behaviors of M31 classical novae are diverse and we classify them morphologically into S (smooth) and J (jittering) classes. We find that the S-class novae rise significantly faster than the J-class novae. We see no dependence between rise-time and maximum magnitude.
-
3.
During the ten minute cadence PTF observations the rising light curve of two novae were recorded with unprecedented detail. These novae showed smooth and consistent rising light curves without large amplitude variability.
-
4.
The declining light curves are also divided morphologically into S and J classes. The relative population of different classes in M31 is roughly consistent with that in the Galaxy.
-
5.
Three quarters of the well-sampled novae obey the empirical MMRD relation. The remaining one quarter (five events) are consistent with the “faint and fast” outliers found by Kasliwal et al. (2010).
-
6.
Some novae have UV detections prior to or at the same time as the first optical detection. Moreover, 2009-10b and 2010-11a have UV peaks prior to optical maxima while both are quite red in the UV decay phases. These observations are inconsistent with theoretical predictions of delayed UV emission in the iron curtain stage, possibly suggesting extreme density or abundance variations for these novae.
-
7.
Apart from 2010-10f in Bol 126, we find no other novae in all the cataloged M31 GCs. We derive a GC nova rate in M31 of yr-1. This nova rate is not enhanced relative to the rate in M31 outside of the GC system.
We realize the novae reported here are only a subset of all the classical novae in M31 as the number is smaller than expected (e.g., 65 nova yr-1 Darnley et al., 2006). We did not undertake a systematic search for classical novae in PTF images during the 2009 and 2010 seasons. Since the FoV and survey depth of PTF should be sensitive to all classical novae (weather-permitting), we have started a more complete search for classical novae in M31 in the 2011 season. For 2012, we intend to run a real-time search for novae. Our photometric and spectroscopic follow-up will enable us to better understand their properties and to estimate the local extinction correction.
Besides optical bands, future UV surveys are warranted for nova studies. Some novae peak in the UV before the optical. Such novae could provide important insights into the development and structure of the nova wind. It is also important to know if novae like M31N 2009-10b and M31N 2010-11a are rare or common and if they are always outliers in the MMRD diagram.
Ongoing and upcoming synoptic surveys (e.g., Palomar Transient Factory and Next Generation Transient Facilities) will continue to monitor the Andromeda Galaxy. The long time baseline will give us a larger sample of recurrent novae. As noted earlier, recurrent novae could be the progenitors of Ia supernovae. Thus the increased sample and timely follow-up will give us a comprehensive understanding of rate of recurrent novae–an important clue to their endpoint.
References
- Alksnis & Zharova (2000) Alksnis, A., & Zharova, A. V. 2000, Information Bulletin on Variable Stars, 4909, 1
- Arp (1956) Arp, H. C. 1956, AJ, 61, 15
- Barsukova et al. (2009a) Barsukova, E., Afanasiev, V., Fabrika, S., Valeev, A., Hornoch, K., & Pietsch, W. 2009a, The Astronomer’s Telegram, 2251, 1
- Barsukova et al. (2009b) Barsukova, E., Valeev, A., Sholukhova, O., Medvedev, A., Hornoch, K., Pietsch, W., & Fabrika, S. 2009b, The Astronomer’s Telegram, 2205, 1
- Barsukova et al. (2010) Barsukova, E. A., Valeev, A. F., Sholukhova, O., Fabrika, S., Hornoch, K., Pietsch, W., & Goranskij, V. P. 2010, The Astronomer’s Telegram, 2789, 1
- Bode & Evans (2008) Bode, M., & Evans, A. 2008, Classical novae, Cambridge astrophysics series (Cambridge University Press)
- Burwitz et al. (2010a) Burwitz, V., Pietsch, W., Henze, M., Rodriguez, J., Haswell, C. A., Holmes, S., Kolb, U., & Lucas, R. 2010a, Central Bureau Electronic Telegrams, 2343, 1
- Burwitz et al. (2010b) —. 2010b, The Astronomer’s Telegram, 2697, 1
- Burwitz et al. (2009) Burwitz, V., Rodriguez, J., Holmes, S., Kolb, U., & Lucas, R. 2009, Central Bureau Electronic Telegrams, 2003, 2
- Burwitz et al. (2010c) Burwitz, V., et al. 2010c, Central Bureau Electronic Telegrams, 2124, 1
- Burwitz et al. (2010d) —. 2010d, The Astronomer’s Telegram, 2383, 1
- Cagas (2009) Cagas, P. 2009, Central Bureau Electronic Telegrams, 2061, 3
- Cao et al. (2010) Cao, Y., Kasliwal, M. M., & Kulkarni, S. R. 2010, The Astronomer’s Telegram, 3066, 1
- Cassatella et al. (2002) Cassatella, A., Altamore, A., & González-Riestra, R. 2002, A&A, 384, 1023
- Cassatella et al. (2004) Cassatella, A., Lamers, H. J. G. L. M., Rossi, C., Altamore, A., & González-Riestra, R. 2004, A&A, 420, 571
- Cenko et al. (2006) Cenko, S. B., et al. 2006, PASP, 118, 1396
- Chemin et al. (2009) Chemin, L., Carignan, C., & Foster, T. 2009, ApJ, 705, 1395
- Ciardullo et al. (1987) Ciardullo, R., Ford, H. C., Neill, J. D., Jacoby, G. H., & Shafter, A. W. 1987, ApJ, 318, 520
- Ciardullo et al. (1990a) Ciardullo, R., Shafter, A. W., Ford, H. C., Neill, J. D., Shara, M. M., & Tomaney, A. B. 1990a, ApJ, 356, 472
- Ciardullo et al. (1990b) Ciardullo, R., Tamblyn, P., & Phillips, A. C. 1990b, PASP, 102, 1113
- Corbelli et al. (2010) Corbelli, E., Lorenzoni, S., Walterbos, R., Braun, R., & Thilker, D. 2010, A&A, 511, A89+
- Corral-Santana et al. (2010) Corral-Santana, J., Casares, J., Hornochova, P., & Wolf, M. 2010, Central Bureau Electronic Telegrams, 2487, 1
- Darnley et al. (2004) Darnley, M. J., et al. 2004, MNRAS, 353, 571
- Darnley et al. (2006) —. 2006, MNRAS, 369, 257
- della Valle & Livio (1995) della Valle, M., & Livio, M. 1995, ApJ, 452, 704
- Di Mille et al. (2009) Di Mille, F., et al. 2009, The Astronomer’s Telegram, 2248, 1
- Fabrika et al. (2010) Fabrika, S., Barsukova, E. A., Valeev, A. F., Sholukhova, O., Hornoch, K., Goranskij, V. P., & Pietsch, W. 2010, The Astronomer’s Telegram, 3068, 1
- Fabrika et al. (2009a) Fabrika, S., Sholukhova, O., Valeev, A., Hornoch, K., Kusnirak, P., & Pietsch, W. 2009a, Central Bureau Electronic Telegrams, 1971, 3
- Fabrika et al. (2009b) Fabrika, S., Sholukhova, O., Valeev, A., Hornoch, K., & Pietsch, W. 2009b, The Astronomer’s Telegram, 2239, 1
- Galleti et al. (2004) Galleti, S., Federici, L., Bellazzini, M., Fusi Pecci, F., & Macrina, S. 2004, A&A, 416, 917
- Gehrels et al. (2004) Gehrels, N., et al. 2004, ApJ, 611, 1005
- Gil de Paz et al. (2007) Gil de Paz, A., et al. 2007, ApJS, 173, 185
- González-Riestra & Krautter (1998) González-Riestra, R., & Krautter, J. 1998, in ESA Special Publication, Vol. 413, Ultraviolet Astrophysics Beyond the IUE Final Archive, ed. W. Wamsteker, R. Gonzalez Riestra, & B. Harris, 367
- Green (2009) Green, D. W. E. 2009, Central Bureau Electronic Telegrams, 2061, 1
- Green (2010a) —. 2010a, Central Bureau Electronic Telegrams, 2582, 1
- Green (2010b) —. 2010b, Central Bureau Electronic Telegrams, 2582, 4
- Green (2010c) —. 2010c, Central Bureau Electronic Telegrams, 2582, 5
- Green (2010d) —. 2010d, Central Bureau Electronic Telegrams, 2597, 2
- Green (2010e) —. 2010e, Central Bureau Electronic Telegrams, 2187, 1
- Green (2010f) —. 2010f, Central Bureau Electronic Telegrams, 2610, 1
- Henze et al. (2010a) Henze, M., Burwitz, V., Pietsch, W., Rodriguez, J., Haswell, C. A., Holmes, S., Kolb, U., & Lucas, R. 2010a, Central Bureau Electronic Telegrams, 2358, 2
- Henze et al. (2010b) —. 2010b, The Astronomer’s Telegram, 2727, 1
- Henze et al. (2009a) Henze, M., Kaduk, F., Pietsch, W., Burwitz, V., Liakos, A., Hatzidimitriou, D., & Niarchos, P. 2009a, The Astronomer’s Telegram, 2189, 1
- Henze et al. (2010c) Henze, M., Pietsch, W., & Haberl, F. 2010c, The Astronomer’s Telegram, 2787, 1
- Henze et al. (2009b) Henze, M., Pietsch, W., Haberl, F., & Orio, M. 2009b, The Astronomer’s Telegram, 2274, 1
- Henze et al. (2009c) Henze, M., et al. 2009c, The Astronomer’s Telegram, 2286, 1
- Henze et al. (2009d) —. 2009d, Central Bureau Electronic Telegrams, 2015, 2
- Henze et al. (2009e) —. 2009e, A&A, 500, 769
- Henze et al. (2010d) —. 2010d, The Astronomer’s Telegram, 3019, 1
- Hornoch (2010) Hornoch, K. 2010, Central Bureau Electronic Telegrams, 2343, 3
- Hornoch et al. (2010a) Hornoch, K., Corral-Santana, J. M., & Casares, J. 2010a, Central Bureau Electronic Telegrams, 2391, 1
- Hornoch et al. (2010b) Hornoch, K., Hornochova, P., Gallagher, J., & Garnavich, P. 2010b, Central Bureau Electronic Telegrams, 2342, 1
- Hornoch et al. (2010c) Hornoch, K., Hornochova, P., Kubanek, P., Gorosabel, J., Lara-Gil, O., & Jelinek, M. 2010c, Central Bureau Electronic Telegrams, 2341, 1
- Hornoch et al. (2010d) Hornoch, K., Hornochova, P., & Wolf, M. 2010d, Central Bureau Electronic Telegrams, 2516, 4
- Hornoch et al. (2010e) Hornoch, K., Hornochova, P., Zasche, P., & Wolf, M. 2010e, Central Bureau Electronic Telegrams, 2391, 3
- Hornoch et al. (2010f) Hornoch, K., Kubanek, P., Gorosabel, J., Martorell, P., Jelinek, M., Morales, N., & Ortiz, J. L. 2010f, Central Bureau Electronic Telegrams, 2187, 3
- Hornoch & Kusnirak (2009) Hornoch, K., & Kusnirak, P. 2009, Central Bureau Electronic Telegrams, 1971, 2
- Hornoch et al. (2009a) Hornoch, K., Kusnirak, P., & Pejcha, O. 2009a, Central Bureau Electronic Telegrams, 1971, 4
- Hornoch & Pejcha (2009) Hornoch, K., & Pejcha, O. 2009, Central Bureau Electronic Telegrams, 2061, 5
- Hornoch et al. (2009b) Hornoch, K., Pejcha, O., & Kusnirak, P. 2009b, Central Bureau Electronic Telegrams, 2058, 3
- Hornoch et al. (2009c) Hornoch, K., Pejcha, O., & Wolf, M. 2009c, Central Bureau Electronic Telegrams, 2062, 1
- Hornoch et al. (2010g) Hornoch, K., Prieto, J., Khan, R., & Pejcha, O. 2010g, Central Bureau Electronic Telegrams, 2136, 1
- Hornoch et al. (2010h) Hornoch, K., Prieto, J., Khan, R., Pejcha, O., Kubanek, P., Gorosabel, J., Martorell, P., & Jelinek, M. 2010h, Central Bureau Electronic Telegrams, 2127, 1
- Hornoch et al. (2010i) Hornoch, K., Prieto, J. L., Pejcha, O., Zasche, P., Wolf, M., & Hornochova, P. 2010i, Central Bureau Electronic Telegrams, 2391, 2
- Hornoch & Zasche (2010) Hornoch, K., & Zasche, P. 2010, Central Bureau Electronic Telegrams, 2358, 1
- Hornoch et al. (2010j) Hornoch, K., et al. 2010j, Central Bureau Electronic Telegrams, 2347, 2
- Hornoch et al. (2010k) —. 2010k, Central Bureau Electronic Telegrams, 2411, 1
- Hornoch et al. (2010l) —. 2010l, Central Bureau Electronic Telegrams, 2341, 2
- Hornochova et al. (2010) Hornochova, P., Hornoch, K., Wolf, M., Kusnirak, P., & Pejcha, O. 2010, Central Bureau Electronic Telegrams, 2573, 1
- Hornochova & Wolf (2010) Hornochova, P., & Wolf, M. 2010, Central Bureau Electronic Telegrams, 2571, 1
- Hubble (1929) Hubble, E. P. 1929, ApJ, 69, 103
- Jordi et al. (2006) Jordi, K., Grebel, E. K., & Ammon, K. 2006, A&A, 460, 339
- Kasliwal (2009) Kasliwal, M. M. 2009, Central Bureau Electronic Telegrams, 2015, 3
- Kasliwal et al. (2009) Kasliwal, M. M., et al. 2009, The Astronomer’s Telegram, 2290, 1
- Kasliwal et al. (2010) —. 2010, ArXiv e-prints
- Kato & Hachisu (1994) Kato, M., & Hachisu, I. 1994, ApJ, 437, 802
- Kato & Hachisu (2005) —. 2005, ApJ, 633, L117
- Kato & Hachisu (2007) —. 2007, ApJ, 657, 1004
- Kogure (1961) Kogure, T. 1961, PASJ, 13, 335
- Koishikawa (2010) Koishikawa, M. 2010, Central Bureau Electronic Telegrams, 2582, 2
- Koishikawa et al. (2010) Koishikawa, M., Pietsch, W., & Yusa, T. 2010, Central Bureau Electronic Telegrams, 2582, 7
- Kron (1980) Kron, R. G. 1980, ApJS, 43, 305
- Krushinski et al. (2010) Krushinski, V., Zalozhnich, I., Kopytova, T., & Popov, A. 2010, The Astronomer’s Telegram, 2844, 1
- Kusnirak et al. (2009) Kusnirak, P., Hornoch, K., Zasche, P., & Wolf, M. 2009, Central Bureau Electronic Telegrams, 2061, 4
- Law et al. (2009) Law, N. M., et al. 2009, PASP, 121, 1395
- Martignoni et al. (2009) Martignoni, M., Itagaki, K., & Yamaoka, H. 2009, Central Bureau Electronic Telegrams, 1980, 2
- Martin et al. (2005) Martin, D. C., et al. 2005, ApJ, 619, L1
- Massey et al. (2006) Massey, P., Olsen, K. A. G., Hodge, P. W., Strong, S. B., Jacoby, G. H., Schlingman, W., & Smith, R. C. 2006, AJ, 131, 2478
- Medvedev et al. (2009) Medvedev, A., et al. 2009, The Astronomer’s Telegram, 2213, 1
- Merrett et al. (2006) Merrett, H. R., et al. 2006, MNRAS, 369, 120
- Morrissey et al. (2007) Morrissey, P., et al. 2007, ApJS, 173, 682
- Nakano & Itagaki (2009) Nakano, S., & Itagaki, K. 2009, Central Bureau Electronic Telegrams, 1973, 1
- Nakano et al. (2009) Nakano, S., Itagaki, K., & Nicolas, J. 2009, Central Bureau Electronic Telegrams, 1971, 5
- Nakano & Yusa (2009) Nakano, S., & Yusa, T. 2009, Central Bureau Electronic Telegrams, 1967, 1
- Nakano & Yusa (2010) —. 2010, Central Bureau Electronic Telegrams, 2500, 1
- Nishiyama & Kabashima (2009a) Nishiyama, K., & Kabashima, F. 2009a, Central Bureau Electronic Telegrams, 2003, 1
- Nishiyama & Kabashima (2009b) —. 2009b, Central Bureau Electronic Telegrams, 2058, 1
- Nishiyama & Kabashima (2010) —. 2010, Central Bureau Electronic Telegrams, 2516, 2
- Nishiyama et al. (2009a) Nishiyama, K., Kabashima, F., Hornoch, K., Kubanek, P., Gorrosabel, J., & Jelinek, M. 2009a, Central Bureau Electronic Telegrams, 2015, 1
- Nishiyama et al. (2009b) Nishiyama, K., Kabashima, F., & Yusa, T. 2009b, Central Bureau Electronic Telegrams, 2100, 1
- Oke et al. (1995) Oke, J. B., et al. 1995, PASP, 107, 375
- Ovcharov et al. (2009) Ovcharov, E., Valcheva, A., Georgiev, T., Kostov, A., Nikolov, Y., & Nedialkov, P. 2009, The Astronomer’s Telegram, 2176, 1
- Pietsch (2010) Pietsch, W. 2010, Astronomische Nachrichten, 331, 187
- Pietsch & Henze (2010a) Pietsch, W., & Henze, M. 2010a, Central Bureau Electronic Telegrams, 2187, 2
- Pietsch & Henze (2010b) —. 2010b, The Astronomer’s Telegram, 2435, 1
- Pietsch et al. (2010a) Pietsch, W., Henze, M., Burwitz, V., Kaur, A., Hartmann, D. H., Milne, P., & Williams, G. 2010a, Central Bureau Electronic Telegrams, 2582, 3
- Pietsch et al. (2010b) —. 2010b, The Astronomer’s Telegram, 3001, 1
- Pietsch et al. (2010c) —. 2010c, The Astronomer’s Telegram, 3076, 1
- Pietsch et al. (2010d) Pietsch, W., Henze, M., Burwitz, V., Liakos, A., Hatzidimitriou, D., & Niarchos, P. 2010d, Central Bureau Electronic Telegrams, 2343, 2
- Pietsch et al. (2010e) —. 2010e, Central Bureau Electronic Telegrams, 2347, 1
- Pietsch et al. (2010f) —. 2010f, The Astronomer’s Telegram, 2713, 1
- Pietsch et al. (2010g) Pietsch, W., Henze, M., Haberl, F., & Burwitz, V. 2010g, The Astronomer’s Telegram, 3038, 1
- Pietsch et al. (2010h) —. 2010h, The Astronomer’s Telegram, 3061, 1
- Pietsch et al. (2010i) —. 2010i, The Astronomer’s Telegram, 3013, 1
- Pietsch et al. (2010j) Pietsch, W., Lloyd, J., Henze, M., Burwitz, V., Liakos, A., & Hatzidimitriou, D. 2010j, The Astronomer’s Telegram, 2964, 1
- Pietsch et al. (2009a) Pietsch, W., et al. 2009a, The Astronomer’s Telegram, 2308, 1
- Pietsch et al. (2009b) —. 2009b, Central Bureau Electronic Telegrams, 2061, 2
- Pietsch et al. (2010k) —. 2010k, The Astronomer’s Telegram, 2896, 1
- Podigachoski et al. (2009a) Podigachoski, P., Henze, M., Pietsch, W., Burwitz, V., Papamastorakis, G., Reig, P., & Strigachev, A. 2009a, The Astronomer’s Telegram, 2234, 1
- Podigachoski et al. (2009b) —. 2009b, Central Bureau Electronic Telegrams, 1971, 1
- Podigachoski et al. (2009c) Podigachoski, P., Pietsch, W., Henze, M., Burwitz, V., Updike, A., Milne, P., Williams, G., & Hartmann, D. H. 2009c, The Astronomer’s Telegram, 2304, 1
- Podigachoski et al. (2009d) —. 2009d, Central Bureau Electronic Telegrams, 2058, 2
- Prieto et al. (2010a) Prieto, J., Khan, R., Garnavich, P., Pagnini, J., & Yusa, T. 2010a, Central Bureau Electronic Telegrams, 2594, 1
- Prieto et al. (2010b) Prieto, J., Khan, R., & Hornochova, P. 2010b, Central Bureau Electronic Telegrams, 2610, 2
- Rau et al. (2009) Rau, A., et al. 2009, PASP, 121, 1334
- Rector et al. (1999) Rector, T. A., Jacoby, G. H., Corbett, D. L., & Denham, M. 1999, in Bulletin of the American Astronomical Society, Vol. 31, Bulletin of the American Astronomical Society, 1420–1421
- Rodríguez-Gil et al. (2009) Rodríguez-Gil, P., Ferrando, R., Rodríguez, D., Bode, M. F., Huxor, A., Giles, P., & Mackey, D. 2009, The Astronomer’s Telegram, 2166, 1
- Romadan et al. (2010) Romadan, A., et al. 2010, The Astronomer’s Telegram, 2840, 1
- Rosino (1964) Rosino, L. 1964, Annales d’Astrophysique, 27, 498
- Rosino (1973) —. 1973, A&AS, 9, 347
- Schaefer (2010) Schaefer, B. E. 2010, ApJS, 187, 275
- Schlegel et al. (1998) Schlegel, D. J., Finkbeiner, D. P., & Davis, M. 1998, ApJ, 500, 525
- Shafter et al. (2010a) Shafter, A. W., Bode, M. F., Darnley, M. J., Ciardullo, R., & Misselt, K. A. 2010a, The Astronomer’s Telegram, 3006, 1
- Shafter et al. (2011a) Shafter, A. W., Bode, M. F., Darnley, M. J., Misselt, K. A., Rubin, M., & Hornoch, K. 2011a, ApJ, 727, 50
- Shafter et al. (2010b) Shafter, A. W., Ciardullo, R., Bode, M. F., Darnley, M. J., & Misselt, K. A. 2010b, The Astronomer’s Telegram, 2987, 1
- Shafter et al. (2010c) —. 2010c, The Astronomer’s Telegram, 2843, 1
- Shafter et al. (2010d) —. 2010d, The Astronomer’s Telegram, 2834, 1
- Shafter et al. (2010e) Shafter, A. W., Ciardullo, R., Darnley, M. J., Bode, M. F., & Misselt, K. A. 2010e, The Astronomer’s Telegram, 3074, 1
- Shafter et al. (2010f) —. 2010f, The Astronomer’s Telegram, 2898, 1
- Shafter et al. (2010g) —. 2010g, The Astronomer’s Telegram, 2949, 1
- Shafter et al. (2010h) —. 2010h, The Astronomer’s Telegram, 2909, 1
- Shafter et al. (2010i) Shafter, A. W., Hornoch, K., Darnley, M. J., Bode, M. F., Ciardullo, R., & Misselt, K. A. 2010i, The Astronomer’s Telegram, 3039, 1
- Shafter & Irby (2001) Shafter, A. W., & Irby, B. K. 2001, ApJ, 563, 749
- Shafter & Quimby (2007) Shafter, A. W., & Quimby, R. M. 2007, ApJ, 671, L121
- Shafter et al. (2011b) Shafter, A. W., et al. 2011b, ArXiv e-prints
- Sharov & Alksnis (1991) Sharov, A. S., & Alksnis, A. 1991, Ap&SS, 180, 273
- Shaviv (2001) Shaviv, N. J. 2001, MNRAS, 326, 126
- Siegel et al. (2010) Siegel, M. H., et al. 2010, ApJ, 725, 1215
- Starrfield et al. (1988) Starrfield, S., Sparks, W. M., & Shaviv, G. 1988, ApJ, 325, L35
- Strope et al. (2010) Strope, R. J., Schaefer, B. E., & Henden, A. A. 2010, AJ, 140, 34
- Sun et al. (2010) Sun, G., Wenzhou, Zhejiang, & Gao, X. 2010, Central Bureau Electronic Telegrams, 2516, 3
- Tamm et al. (2007) Tamm, A., Tempel, E., & Tenjes, P. 2007, ArXiv e-prints
- Tomaney et al. (1992) Tomaney, A. B., Crotts, A., & Shafter, A. 1992, in Bulletin of the American Astronomical Society, Vol. 24, American Astronomical Society Meeting Abstracts, 1237–+
- Tomaney & Shafter (1992) Tomaney, A. B., & Shafter, A. W. 1992, ApJS, 81, 683
- Trudolyubov & Priedhorsky (2004) Trudolyubov, S., & Priedhorsky, W. 2004, ApJ, 616, 821
- Vilardell et al. (2010) Vilardell, F., Ribas, I., Jordi, C., Fitzpatrick, E. L., & Guinan, E. F. 2010, A&A, 509, A70+
- Wirth et al. (1985) Wirth, A., Smarr, L. L., & Bruno, T. L. 1985, ApJ, 290, 140
- Yamaoka et al. (2009) Yamaoka, H., Ayani, K., Honda, S., & Kinugasa, K. 2009, Central Bureau Electronic Telegrams, 1980, 1
- Yusa (2010a) Yusa, T. 2010a, Central Bureau Electronic Telegrams, 2448, 1
- Yusa (2010b) —. 2010b, Central Bureau Electronic Telegrams, 2472, 1
- Yusa (2010c) —. 2010c, Central Bureau Electronic Telegrams, 2483, 1
- Yusa (2010d) —. 2010d, Central Bureau Electronic Telegrams, 2582, 6
- Yusa (2010e) —. 2010e, Central Bureau Electronic Telegrams, 2597, 1
- Zheng et al. (2010) Zheng, W., et al. 2010, Central Bureau Electronic Telegrams, 2574, 1