Local stellar kinematics from RAVE data: III. Radial and Vertical Metallicity Gradients based on Red Clump Stars
Abstract
We investigate radial and vertical metallicity gradients for a sample of red clump stars from the RAdial Velocity Experiment (RAVE) Data Release 3. We select a total of 6781 stars, using a selection of colour, surface gravity and uncertainty in the derived space motion, and calculate for each star a probabilistic (kinematic) population assignment to a thin or thick disc using space motion and additionally another (dynamical) assignment using stellar vertical orbital eccentricity. We derive almost equal metallicity gradients as a function of Galactocentric distance for the high probability thin disc stars and for stars with vertical orbital eccentricities consistent with being dynamically young, , i.e. and dex kpc-1. Metallicity gradients as a function of distance from the Galactic plane for the same populations are steeper, i.e. and dex kpc-1, respectively. and are the arithmetic mean of the perigalactic and apogalactic distances, and the maximum distance to the Galactic plane, respectively. Samples including more thick disc red clump giant stars show systematically shallower abundance gradients. These findings can be used to distinguish between different formation scenarios of the thick and thin discs.
keywords:
Galaxy: abundances – Galaxy: disc – stars: abundances – Galaxy: evolution1 Introduction
Metallicity gradients play an important role in understanding the formation of disc populations of the galaxies. In the Milky Way Galaxy, there is extensive information establishing a radial gradient in young stars and in the interstellar medium (Shaver et al., 1983; Luck, Kovtyukh & Andrievsky, 2006; Luck & Lambert, 2011). Values typically derived are dex kpc-1, within 2-3 kpc of the Sun. Much effort to search for local abundance variations, and abundance variations with azimuth, show little if any detectable variation in young systems (Luck et al., 2011), showing the inter-stellar medium to be well-mixed on quite large scales, supporting the importance of gas flows.
Extant data suggest vertical metallicity gradients in the dex kpc-1 range for relatively small distances from the Galactic plane, i.e. kpc (Trefzger, Pel & Gabi, 1995; Karaali et al., 2003; Du et al., 2004; Ak et al., 2007a; Peng, Du & Wu, 2011). For intermediate distances, where the thick disc is dominant, the vertical metallicity gradient is low, dex kpc-1 and the radial gradient is only marginal, dex kpc-1 (Rong et al., 2001). There is some evidence that metallicity gradients for relatively short vertical distances, kpc, show systematic fluctuations with Galactic longitude, similar to those of thick-disc scaleheight, which may be interpreted as a common flare effect of the disc (Bilir et al., 2006; Cabrera-Lavers et al., 2007; Ak et al., 2007b; Bilir et al., 2008; Yaz & Karaali, 2010).
Quantifying the abundance distribution functions and their radial and vertical gradients in both thin and thick discs can be achieved using stellar abundances, especially those from major surveys such as RAdial Velocity Experiment (RAVE; Steinmetz et al., 2006) and Sloan Digital Sky Survey (SDSS; Abazajian et al., 2003). RAVE is a multi-fibre spectroscopic astronomical survey in the Milky Way, which covers just over the half of the Southern hemisphere, using the 1.2-m UK Schmidt Telescope of the Australian Astronomical Observatory (Steinmetz et al., 2006; Zwitter et al., 2008; Siebert et al., 2011). RAVE’s primary aim is to derive the radial velocity of stars from the observed spectra for solar neighbourhood stars. Additional information is also derived, such as photometric parallax and stellar atmospheric parameters, i.e. effective temperature, surface gravity, metallicity and elemental abundance data. This information is important in calculating metallicity gradients, which provides data about the formation and evolution of the Galaxy. As the data were obtained from solar neighbourhood stars, we have limitations to distance and range of metallicity. However, the metallicity measurements are of high internal accuracy which is an advantage for our work.
In a recent study carried out by Chen et al. (2011), a vertical metallicity gradient of -0.22 dex kpc-1 was claimed for the thick disc. They used the SDSS DR8 (Aihara et al., 2011) data set to identify a sample of red horizontal branch stars (RHB) and for this sample they derived the steepest metallicity gradient for the thick disc currently in the literature. RHB stars are very old, on average, so it is feasible that they can have a different metallicity variation than younger stars. However, the difference between their metallicity gradient and others in the literature for the thick disc is large, which motivates confirmation by other works with different data.
In our previous study (Coşkunoğlu et al., 2011a, paper II), we investigated the metallicity gradient of a dwarf sample and we confirmed the radial metallicity gradient of -0.04 dex kpc-1 based on calibrated metallicities from RAVE DR3 (Coşkunoğlu et al., 2011a, and the references therein, Paper I). Additionally, we showed that the radial metallicity gradient is steeper for our sample which is statistically selected to favour younger stars, i.e. F-type stars with orbital eccentricities , i.e. dex kpc-1. Vertical metallicity gradients could not be derived in this study due to short -distances from the Galactic plane. Therefore, in this present study, we analyses stellar abundance gradients of red clump stars from RAVE data.
Red Clump (RC) stars are core helium-burning stars, in an identical evolutionary phase to those which make up the horizontal branch in globular clusters. However, in intermediate-and higher-metallicity systems only the red end of the distribution is seen, forming a clump of stars in the colour-magnitude diagram. In recent years much work has been devoted to studying the suitability of RC stars for application as a distance indicator. Their absolute magnitude in the optical ranges from mag for those of spectral type G8 III to mag for type K2 III (Keenan & Barnbaum, 1999). The absolute magnitude of these stars in the band is mag with negligible dependence on metallicity (Alves, 2000), but with a real dispersion (see below), and in the band mag, again without dependence on metallicity (Paczynski & Stanek, 1998). RAVE DR3 red clump giants stars occupy a relatively larger -distance interval than do RAVE DR3 dwarfs. Hence, we should have sufficient data to be able to derive abundance gradients for both directions, radial and vertical. As the RHB stars are on the extended branch of RC stars, we anticipate the results to be similar to RHB stars claimed in Chen et al. (2011), and so are able to test their result.
The structure of the paper is: Data selection is described in Section 2; calculated space velocities and orbits of sample stars is described in Section 3. Population analysis and results are given in Section 4 and Section 5, respectively. Finally, a discussion and conclusion are presented in Section 6.
2 Data
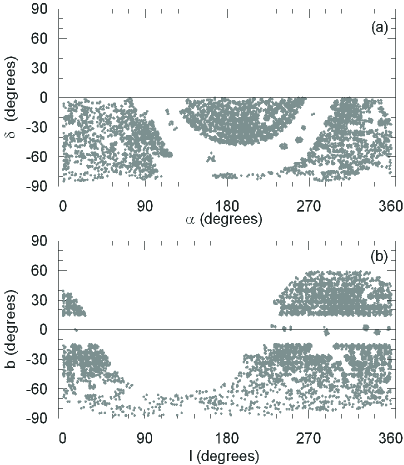
The data were selected from the third data release of RAVE (DR3; Siebert et al., 2011). RAVE DR3 reports 83072 radial velocity measurements for stars mag. This release also provides stellar atmospheric parameters for 41 672 spectra representing 39833 individual stars (Siebert et al., 2011). The accuracy of the radial velocities is high, marginally improved with DR3: the distribution of internal errors in radial velocities has a mode of 0.8 km s-1 and a median of 1.2 km s-1, while 95 per cent of the sample has an internal error smaller than 5 km s-1. The uncertainties for the stellar atmospheric parameters are typically: 250 K for effective temperature , 0.43 dex for surface gravity and 0.2 dex for . While RAVE supports a variety of chemical abundance scales, we use here just the public DR3 values. Since anticipated gradients are small, this provides a well-defined set of parameters for analysis. The proper motions of the stars were taken from RAVE DR3 values, which were compiled from PPMX, Tycho-2, SSS and UCAC2 catalogs. The distribution of RAVE DR3 stars in the Equatorial and Galactic coordinate planes are shown in Fig. 1.
We applied the following constraints to obtain a homogeneous RC sample with best quality: i) (Puzeras et al., 2010), ii) the Two Micron All Sky Survey (2MASS; Skrutskie et al., 2006) photometric data are of quality labelled as “AAA”, and iii) (Bilir et al., 2011). The numerical values for and the median of S/N value of sample spectra (totally 7985 stars), thus obtained are 671 and 41, respectively. Proper motions for 139 out of the 7985 stars are not available in the RAVE DR3, hence these values are provided from the PPMXL Catalog of Roeser, Demleitner & Schilbach (2010). Distances were obtained by combining the apparent magnitude of the star in query and the absolute magnitude mag, adopted for all RC stars (Groenewegen, 2008). Whereas the reddening were obtained iteratively by using published methodology (for more detailed information regarding the iterations see Coşkunoğlu et al., 2011b, and the references therein;). Then, the de-reddening of magnitudes and colours in 2MASS were carried out by the following equations with the co-efficient of Fiorucci & Munari (2003):
| (1) | |||
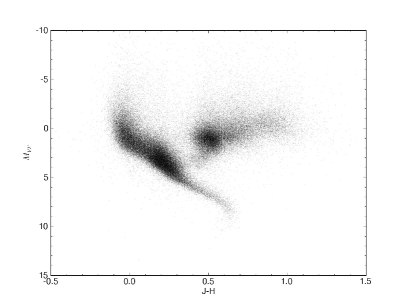
Note the real dispersion in absolute magnitude among RC stars (Fig. 2). This will have the effect of blurring the derived distances, and so smoothing any derived gradient. Given that we search for a linear gradient, such distance uncertainties will tend to somewhat reduce any measured gradient. Given our results below, we consider any such effect to be second order.
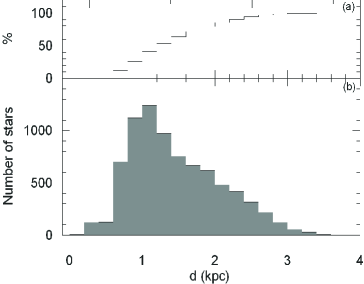
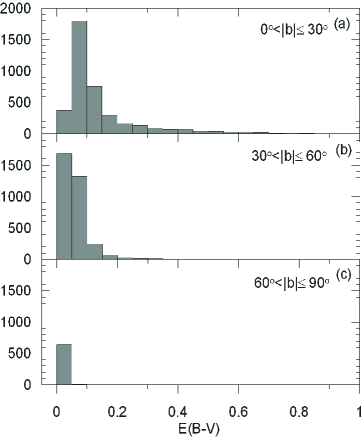
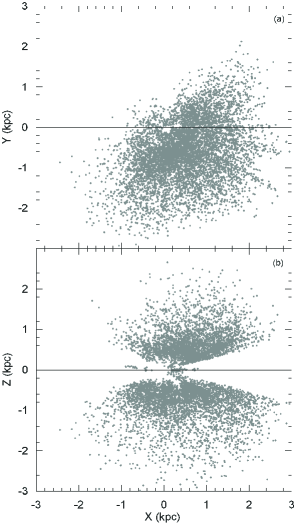
The distance range of the sample and the median of the distances are kpc and 1.34 kpc, respectively (Fig. 3), which are sufficient to investigate both radial and vertical metallicity gradients. The distribution of colour excess is given in three categories, i.e. , , and , whose mean values are 0.14, 0.06, and 0.02 mag, respectively (Fig. 4). The reddening is rather small at intermediate and high Galactic latitudes, as expected. The projection of the sample stars onto the (, ) and (, ) planes (Fig. 5) show that their distribution is biassed (by design: RAVE does not observe towards the Galactic bulge and so), the median of the heliocentric coordinates are , , kpc.
3 Space Velocities and Orbits
We combined the distances estimated in Section 2 with RAVE kinematics and the available proper motions, applying the algorithms and the transformation matrices of Johnson & Soderblom (1987) to obtain their Galactic space velocity components (, , ). In the calculations epoch J2000 was adopted as described in the International Celestial Reference System (ICRS) of the Hipparcos and Tycho-2 Catalogues (ESA, 1997). The transformation matrices use the notation of a right handed system. Hence, , , and are the components of a velocity vector of a star with respect to the Sun, where is positive towards the Galactic centre (, ), is positive in the direction of Galactic rotation (, ) and is positive towards the North Galactic Pole ().
We adopted the value of the rotation speed of the Sun as 222.5 km s-1. Correction for differential Galactic rotation is necessary for accurate determination of , , and velocity components. The effect is proportional to the projection of the distance to the stars onto the Galactic plane, i.e. the velocity component is not affected by Galactic differential rotation (Mihalas & Binney, 1981). We applied the procedure of Mihalas & Binney (1981) to the distribution of the sample stars and estimated the first order Galactic differential rotation corrections for and velocity components of the sample stars. The range of these corrections is and km s-1 for and , respectively. As expected, is affected more than the component. Also, the high values for the component show that corrections for differential Galactic rotation can not be ignored. One notices that Galactic differential rotation corrections are rather larger than the corresponding ones for dwarfs Coşkunoğlu et al. (2011b). The , , and velocities were reduced to LSR by adopting the solar LSR velocities in (Coşkunoğlu et al., 2011b), i.e. (, , )=(8.83, 14.19, 6.57) km s-1.
The uncertainty of the space velocity components , and were computed by propagating the uncertainties of the proper motions, distances and radial velocities, again using an algorithm by Johnson & Soderblom (1987). Then, the error for the total space motion of a star follows from the equation:
| (2) |
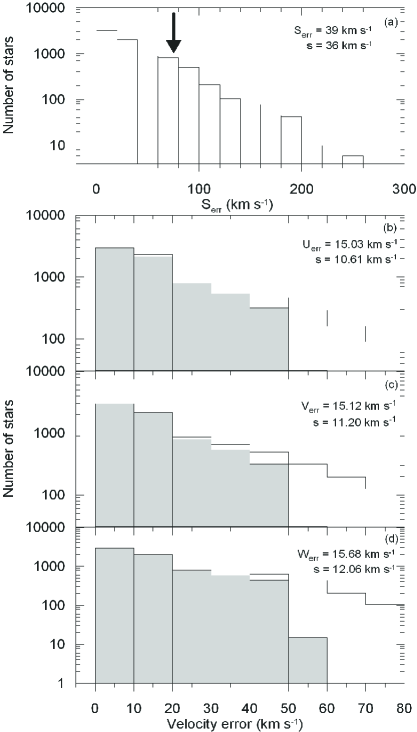
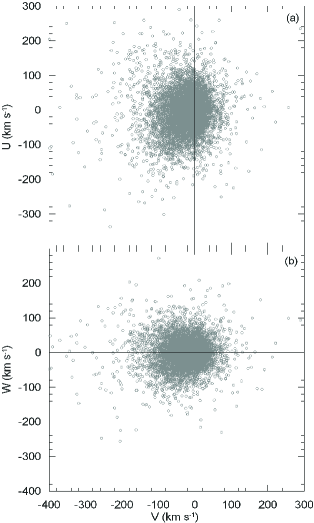
The mean Serr and standard deviation () for space velocity errors are S km s-1 and km s-1, respectively. We now remove the most discrepant data from the analysis, knowing that outliers in a survey such as this will preferentially include stars which are systematically mis-analysed binaries, etc. Astrophysical parameters for such stars are also likely to be relatively unreliable. Thus, we omit stars with errors that deviate by more than the sum of the standard error and the standard deviation, i.e. 75 km s-1. This removes 1204 stars, 15.1 per cent of the sample. Thus, our sample was reduced to 6781 stars, those with more robust space velocity components. After applying this constraint, the mean values and the standard deviations for the velocity components were reduced to (, , )=(, , ) km s-1. The distribution of the errors for the space velocity components is given in Fig. 6. In this study, we used only the sub-sample of stars (6781 stars) with standard error km s-1. The velocity diagrams for these stars are shown in Fig. 7. The centre of the distributions deviate from the zero points of the , , and velocity components, further indicating the need for a Local Standard of Rest reduction.
To complement the chemical abundance data, accurate kinematic data have been obtained and used to calculate individual Galactic orbital parameters for all stars. The shape of the stellar orbit is a proxy, through the age-velocity dispersion relation, for age, with more circular orbits hosting statistically younger stars.
In order to calculate those parameters we used standard gravitational potentials well-described in the literature (Miyamoto & Nagai, 1975; Hernquist, 1990; Johnston, Spergel & Hernquist, 1995; Dinescu, Girard & van Altena, 1999) to estimate orbital elements of each of the sample stars. The orbital elements for a star used in our work are the mean of the corresponding orbital elements calculated over 15 orbital periods of that specific star. The orbital integration typically corresponds to 3 Gyr, and is sufficient to evaluate the orbital elements of solar neighbourhood stars, most of which have orbital periods below 250 Myr.
Solar neighbourhood velocity space includes well-established substructures that resemble classic moving groups or stellar streams (Dehnen, 1998; Skuljan, Hearnshaw & Cottrell, 1999; Nordström et al., 2004). Famaey et al. (2005), Famaey, Siebert & Jorissen (2008) and Pompéia et al. (2011) show that, although these streams include clusters, after which they are named, and evaporated remnants from these clusters, the majority of stars in these streams are not coeval but include stars of different ages, not necessarily born in the same place nor at the same time. They argue these streams are dynamical (resonant) in origin, probably related to dynamical perturbations by transient spiral waves (De Simone, Wu & Tremaine, 2004), which migrate stars to specific regions of the -plane. Stars in a dynamical stream just share a common velocity vector at this particular epoch. These authors further point out the obvious and important point that dynamical streams are kinematically young and so integrating backwards in a smooth stationary axisymmetric potential the orbits of the stars belonging to these streams is non-physical. RAVE stars are selected to avoid the Galactic plane () . Dynamical perturbations by transient spiral waves are strongest closest to the Galactic plane so there will be fewer dynamical stream stars in our RAVE sample. Hence, contamination of the dynamical stream stars is unlikely to affect our statistical results.
To determine a possible orbit, we first perform test-particle integration in a Milky Way potential which consists of a logarithmic halo of the form
| (3) |
with km s-1 and kpc. The disc is represented by a Miyamoto-Nagai potential:
| (4) |
with , kpc and kpc. Finally, the bulge is modelled as a Hernquist potential
| (5) |
using and kpc. The superposition of these components gives quite a good representation of the Milky Way. The circular speed at the solar radius is km s-1. years is the orbital period of the LSR and km s-1 denotes the circular rotational velocity at the solar Galactocentric distance, kpc.
For our analysis of gradients, we are interested in the mean radial Galactocentric distance () as a function of the stellar population and the orbital shape. Wilson et al. (2011) has analysed the radial orbital eccentricities of a RAVE sample of thick disc stars, to test thick disc formation models. Here we focus on possible local gradients, so instead consider the vertical orbital eccentricity, . is defined as the arithmetic mean of the final perigalactic () and apogalactic () distances, and and are the final maximum and minimum distances, respectively, to the Galactic plane. Whereas is defined as follows:
| (6) |
where (Pauli, 2005). Due to -excursions and can vary, however this variation is not more than 5 per cent.
4 Population Analysis
4.1 Classification using space motions
The procedure of Bensby, Feltzing & Lundström (2003, 2005) was used to separate sample stars into different populations. This kinematic methodology assumes that Galactic space velocities for the thin disc (), thick disc (), and stellar halo () with respect to the LSR have Gaussian distributions as follows:
| (7) |
where
| (8) |
normalizes the expression. For consistency with other analyses , and were adopted as the characteristic velocity dispersions: 35, 20 and 16 km s-1 for thin disc (); 67, 38 and 35 km s-1 for thick disc (); 160, 90 and 90 km s-1 for halo (), respectively (Bensby et al., 2003). is the asymmetric drift: -15, -46 and -220 km s-1 for thin disc, thick disc and halo, respectively. LSR velocities were taken from Coşkunoğlu et al. (2011b) and these values are km s-1.
The probability of a star of being “a member” of a given population with respect to a second population is defined as the ratio of the distribution functions times the ratio of the local space densities for two populations. Thus,
| (9) |
are the probabilities for a star being classified as a thick disc star relative to it being a thin disc star, and relative to it being a halo star, respectively. , and are the local space densities for thin disc, thick disc and halo, i.e. 0.94, 0.06, and 0.0015, respectively (Robin et al., 1996; Buser, Rong & Karaali, 1999). We followed the argument of Bensby et al. (2005) and separated the sample stars into four categories: (high probability thin disc stars), (low probability thin disc stars), (low probability thick disc stars) and (high probability thick disc stars). Fig. 8 shows the and diagrams as a function of population types defined by using Bensby et al. (2003)’s criteria. It is evident from Fig. 8 that the kinematic population assignments are strongly affected by space-motion uncertainties. 3385 and 1151 stars of the sample were classified as high and low probability thin disc stars, respectively, whereas 646 and 1599 stars are low and high probability thick disc stars (Table 1). The relative number of high probability thick disc (RC) stars are much larger than the corresponding ones in Coşkunoğlu et al. (2011a) (2 per cent), i.e. 24 per cent.
| Parameters | N | |||
|---|---|---|---|---|
| (km s-1) | (km s-1) | (km s-1) | ||
| (-98, 97) | (-60, 51) | (-44, 43) | 3385 | |
| (-133, 123) | (-78, 72) | (-57, 58) | 1151 | |
| (-151, 154) | (-93, 85) | (-69, 69) | 646 | |
| (-337, 290) | (-400, 291) | (-344, 273) | 1599 |
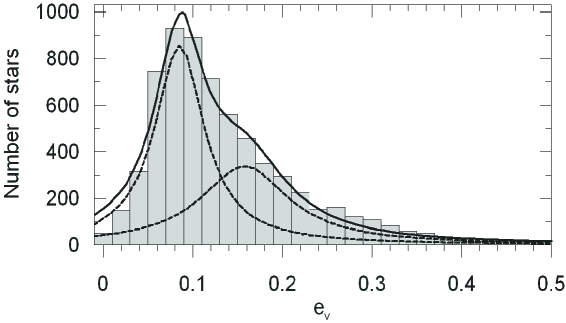
4.2 Population classification using stellar vertical orbital shape
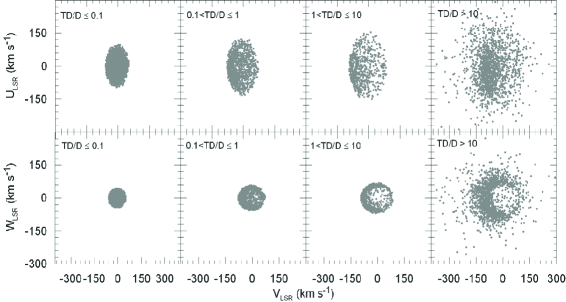
Both radial and vertical orbital eccentricities contain valuable information: here we consider the vertical orbit shape. Vertical orbital eccentricities were calculated, as described above, from numerically-integrated orbits. We term this the dynamical method of population assignment, which complements the Bensby et al. (2003)’s approach. The distribution function of is not consistent with a single Gaussian distribution, as is shown in Fig. 9. A two-Gaussian model however does provide an acceptable fit. For convenience, we separated our sample into three categories, i.e. stars with (3448 stars), (2389 stars) and (944 stars), and fitted their metallicities to their mean radial distances () in order to investigate the presence of a metallicity gradient for RAVE RC stars. We provide in Table 2 (electronically) for each star, stellar parameters from RAVE DR3, calculated kinematical and dynamical parameters and our stellar population assignment.
| (1) | (2) | (3) | (4) | (5) | (6) | (7) | (8) | (9) | (10) | (11) | (12) | (13) | (14) | (15) | (16) | (17) | (18) | (19) | (20) | (21) | (22) |
|---|---|---|---|---|---|---|---|---|---|---|---|---|---|---|---|---|---|---|---|---|---|
| ID | Designation | ||||||||||||||||||||
| 1 | J000002.9-490434 | 0.012167 | -49.076083 | 4963 | 2.99 | -0.32 | 20.2 | -11.7 | 1.920 | -25.23 | -109.28 | 20.12 | -154.86 | 21.00 | 31.23 | 8.61 | 1.822 | 8.580 | -2.096 | 4.316 | 999.999 |
| 2 | J000013.7-725608 | 0.056875 | -72.935667 | 4491 | 2.24 | 0.01 | 18.8 | -4.0 | 0.885 | 10.40 | -38.44 | 13.36 | -39.40 | 11.97 | -4.49 | 10.36 | 5.433 | 7.994 | -0.627 | 0.628 | 0.027 |
| 3 | J000019.8-283022 | 0.082458 | -28.505972 | 4596 | 2.14 | -0.43 | 19.2 | -9.2 | 1.243 | 18.10 | -64.75 | 16.37 | -83.65 | 16.70 | -32.70 | 3.37 | 3.582 | 8.415 | -1.397 | 1.398 | 32.168 |
| 4 | J000207.7-540333 | 0.532167 | -54.059028 | 4588 | 2.06 | -0.54 | 15.5 | -10.0 | 1.631 | 14.53 | -50.67 | 23.08 | -110.26 | 22.61 | 4.76 | 11.20 | 2.790 | 7.880 | -1.444 | 1.444 | 359.507 |
| 5 | J000208.9-843734 | 0.536875 | -84.626139 | 4648 | 2.21 | -0.59 | -11.2 | 2.4 | 0.901 | 84.39 | 106.73 | 10.02 | -18.51 | 7.93 | -37.96 | 9.05 | 5.008 | 10.153 | -0.937 | 0.940 | 1.708 |
| 6 | J000211.9-633612 | 0.549750 | -63.603389 | 4698 | 2.59 | -0.48 | 13.1 | -8.3 | 1.449 | 61.38 | -11.57 | 22.70 | -99.34 | 22.22 | -26.45 | 15.03 | 3.129 | 7.538 | -1.253 | 1.256 | 66.785 |
| 7 | J000214.2-083408 | 0.559042 | -8.568889 | 5237 | 2.80 | -0.53 | 13.2 | -2.6 | 1.199 | 11.97 | -61.50 | 12.23 | -27.10 | 11.59 | -23.51 | 4.74 | 5.805 | 9.049 | -1.256 | 1.253 | 0.061 |
| 8 | J000241.8-355010 | 0.673958 | -35.836028 | 4661 | 2.86 | -0.23 | 22.8 | -6.4 | 1.382 | -14.50 | -105.23 | 10.45 | -90.62 | 11.37 | -1.53 | 2.63 | 3.177 | 9.171 | -1.450 | 1.450 | 137.423 |
| 9 | J000257.3-060701 | 0.738542 | -6.117028 | 4739 | 2.57 | -0.40 | 29.7 | 7.5 | 1.149 | 1.42 | -165.05 | 17.71 | -25.73 | 16.15 | -10.23 | 7.25 | 4.457 | 13.125 | -1.446 | 1.462 | 30.648 |
| 10 | J000324.5-821243 | 0.852167 | -82.212028 | 4733 | 2.60 | -0.50 | -4.2 | -10.5 | 1.015 | 45.37 | 73.12 | 12.40 | -37.92 | 10.18 | 24.92 | 11.39 | 4.780 | 8.590 | -0.725 | 0.726 | 0.193 |
| 11 | J000324.5-821243 | 0.852167 | -82.212028 | 4651 | 2.81 | -0.43 | -4.2 | -10.5 | 1.015 | 44.85 | 72.87 | 12.39 | -37.57 | 10.18 | 25.22 | 11.39 | 4.785 | 8.595 | -0.729 | 0.731 | 0.191 |
| 12 | J000347.2-475241 | 0.946708 | -47.877917 | 4799 | 2.81 | -0.60 | 28.2 | 14.6 | 0.785 | -8.62 | -100.97 | 8.18 | 14.86 | 7.61 | -23.24 | 3.27 | 6.397 | 12.017 | -1.035 | 1.036 | 0.322 |
| 13 | J000347.5-832736 | 0.947792 | -83.459861 | 4383 | 2.04 | -0.51 | -1.3 | -3.4 | 1.343 | -15.75 | 36.35 | 34.21 | 14.93 | 28.23 | 34.38 | 32.38 | 6.877 | 9.373 | -1.053 | 1.049 | 0.062 |
| 14 | J000401.7-211407 | 1.006958 | -21.235167 | 4624 | 2.23 | -0.57 | -4.3 | 6.1 | 1.511 | 41.46 | 11.93 | 22.23 | 73.43 | 22.44 | -23.53 | 4.90 | 7.955 | 15.539 | -2.557 | 2.579 | 2.480 |
| 15 | J000401.7-211407 | 1.006958 | -21.235167 | 4763 | 2.62 | -0.41 | -4.3 | 6.1 | 1.511 | 42.90 | 12.09 | 22.23 | 73.69 | 22.44 | -24.93 | 4.88 | 7.956 | 15.588 | -2.588 | 2.602 | 2.858 |
| 16 | J000405.7-454339 | 1.023875 | -45.727583 | 4497 | 2.35 | 0.11 | -6.0 | -9.3 | 0.682 | 16.08 | 45.84 | 6.56 | -6.79 | 6.69 | 4.27 | 2.61 | 6.569 | 8.910 | -0.689 | 0.690 | 0.010 |
| 17 | J000406.6-774539 | 1.027417 | -77.760917 | 4886 | 2.83 | -0.06 | -0.4 | 6.4 | 1.438 | -57.21 | 2.07 | 12.01 | 77.36 | 8.46 | 10.18 | 7.28 | 7.423 | 14.769 | -1.495 | 1.494 | 2.074 |
| 18 | J000431.7-412250 | 1.132083 | -41.380556 | 4415 | 2.43 | -0.13 | 6.6 | -0.8 | 1.500 | 15.43 | -20.36 | 14.44 | -15.10 | 14.82 | -15.32 | 4.53 | 6.944 | 8.011 | -1.485 | 1.485 | 0.009 |
| 19 | J000454.7-571529 | 1.228042 | -57.258111 | 4760 | 2.60 | -0.34 | 9.5 | -18.7 | 1.739 | 44.73 | 24.17 | 20.72 | -164.50 | 21.39 | 29.29 | 11.75 | 1.456 | 7.214 | -3.777 | 1.918 | 999.999 |
| 20 | J000509.7-503556 | 1.290583 | -50.598889 | 4830 | 2.14 | -0.80 | -6.5 | -2.1 | 2.091 | 95.62 | 119.22 | 21.64 | -1.55 | 21.97 | -60.53 | 9.73 | 5.674 | 11.893 | -3.556 | 3.791 | 99.018 |
| 21 | J000523.6-195000 | 1.348333 | -19.833417 | 4699 | 2.24 | -0.62 | -2.2 | -14.2 | 0.780 | 15.08 | 38.30 | 8.62 | -24.74 | 8.72 | -13.68 | 2.01 | 6.185 | 8.473 | -0.831 | 0.833 | 0.016 |
| 22 | J000547.5-285808 | 1.447875 | -28.969000 | 4760 | 2.35 | -0.49 | 8.7 | -12.7 | 0.863 | 17.41 | 3.22 | 7.85 | -47.47 | 9.51 | -15.60 | 1.50 | 5.286 | 7.886 | -0.890 | 0.889 | 0.044 |
| 23 | J000610.7-391521 | 1.544458 | -39.255861 | 4965 | 2.69 | -0.42 | -0.2 | -0.6 | 1.323 | 11.92 | 18.03 | 14.16 | 9.47 | 10.57 | -3.96 | 3.37 | 7.564 | 8.994 | -1.401 | 1.405 | 0.007 |
| 24 | J000632.0-525213 | 1.633292 | -52.870139 | 4558 | 2.10 | -0.52 | 1.9 | 8.1 | 1.301 | 51.14 | 8.92 | 15.11 | 33.84 | 15.31 | -62.00 | 7.34 | 7.654 | 11.065 | -2.203 | 2.203 | 6.763 |
| 25 | J000711.2-712952 | 1.796500 | -71.497833 | 4890 | 2.72 | -0.53 | 29.2 | -9.1 | 1.420 | 4.98 | -124.67 | 20.65 | -122.94 | 18.60 | 11.35 | 15.22 | 2.414 | 9.459 | -1.141 | 1.139 | 999.999 |
| 26 | J000740.7-213330 | 1.919500 | -21.558194 | 4727 | 2.05 | -0.71 | 0.6 | -4.0 | 0.738 | 39.03 | 14.19 | 8.44 | 7.53 | 8.56 | -33.49 | 1.87 | 7.812 | 8.822 | -0.986 | 0.983 | 0.034 |
| 27 | J000740.7-213330 | 1.919500 | -21.558194 | 4924 | 2.59 | -0.47 | 0.6 | -4.0 | 0.738 | 40.00 | 14.28 | 8.44 | 7.69 | 8.56 | -34.43 | 1.79 | 7.814 | 8.841 | -0.997 | 0.998 | 0.037 |
| 28 | J000742.0-413624 | 1.924833 | -41.606667 | 4889 | 2.52 | -0.61 | 7.2 | -0.9 | 1.294 | -26.08 | -29.22 | 11.91 | -8.21 | 12.18 | 25.37 | 3.68 | 7.146 | 8.328 | -1.432 | 1.434 | 0.018 |
| 29 | J000743.4-200051 | 1.930792 | -20.014083 | 4709 | 2.38 | -0.15 | 15.1 | -11.1 | 0.850 | -10.49 | -27.96 | 11.09 | -54.84 | 11.51 | 0.76 | 2.49 | 4.860 | 8.074 | -0.841 | 0.834 | 0.072 |
| 30 | J000743.4-200051 | 1.930792 | -20.014083 | 4575 | 2.24 | -0.21 | 15.1 | -11.1 | 0.850 | -9.34 | -27.86 | 11.09 | -54.62 | 11.51 | -0.36 | 2.60 | 4.872 | 8.075 | -0.839 | 0.835 | 0.070 |
| 31 | J000752.0-211211 | 1.966458 | -21.203056 | 4554 | 2.17 | -0.72 | 18.9 | -30.2 | 0.812 | -9.65 | -3.35 | 10.53 | -122.30 | 11.55 | -8.88 | 2.34 | 2.298 | 7.926 | -0.935 | 0.942 | 999.999 |
| 32 | J000752.0-211211 | 1.966458 | -21.203056 | 4747 | 2.50 | -0.45 | 18.9 | -30.2 | 0.812 | -8.90 | -3.28 | 10.53 | -122.17 | 11.55 | -9.61 | 2.43 | 2.303 | 7.927 | -0.944 | 0.929 | 999.999 |
| 33 | J000755.3-672223 | 1.980417 | -67.372944 | 4642 | 2.46 | -0.36 | 15.4 | 2.7 | 1.743 | -42.89 | -101.65 | 44.54 | -8.32 | 42.07 | 3.60 | 31.86 | 5.927 | 10.986 | -1.737 | 1.737 | 0.114 |
| 34 | J000811.4-643552 | 2.047417 | -64.597778 | 4551 | 2.59 | -0.49 | 10.9 | 0.9 | 0.741 | 28.06 | -4.72 | 5.94 | -15.01 | 5.64 | -23.78 | 4.05 | 6.900 | 7.739 | -0.678 | 0.678 | 0.014 |
| 35 | J000812.3-393058 | 2.051042 | -39.516194 | 4966 | 2.58 | -0.83 | 24.9 | -8.0 | 1.278 | -53.86 | -111.17 | 15.03 | -93.27 | 15.40 | 43.25 | 4.09 | 3.225 | 9.304 | -1.881 | 1.882 | 999.999 |
| 36 | J000815.0-404803 | 2.062333 | -40.800944 | 4686 | 2.36 | -0.76 | 10.0 | -0.2 | 1.716 | 75.80 | -36.38 | 39.42 | -35.44 | 40.35 | -79.37 | 11.47 | 6.205 | 8.411 | -2.614 | 2.374 | 324.914 |
| 37 | J000846.6-400516 | 2.194083 | -40.087667 | 4857 | 2.88 | -0.16 | 0.0 | 7.7 | 1.116 | 20.39 | -0.06 | 15.92 | 46.96 | 16.33 | -21.79 | 4.49 | 7.793 | 11.916 | -1.527 | 1.530 | 0.102 |
| 38 | J000910.9-392316 | 2.295458 | -39.387722 | 4676 | 2.59 | -0.42 | 9.3 | -16.3 | 2.001 | 13.43 | 7.64 | 34.08 | -165.20 | 35.34 | 10.55 | 9.18 | 1.694 | 7.425 | -3.592 | 1.602 | 999.999 |
| 39 | J000915.5-210409 | 2.314500 | -21.069083 | 4659 | 2.89 | -0.31 | -14.0 | -1.1 | 2.414 | 21.10 | 144.85 | 50.39 | 80.89 | 49.64 | 10.60 | 10.12 | 7.023 | 25.152 | -5.456 | 6.218 | 999.999 |
| 40 | J000942.1-565953 | 2.425375 | -56.997917 | 4895 | 2.18 | -0.70 | 15.1 | 3.0 | 0.939 | 1.69 | -44.22 | 8.51 | -7.76 | 8.30 | -12.20 | 4.62 | 6.694 | 8.729 | -0.884 | 0.883 | 0.012 |
| … | … | … | … | … | … | … | … | … | … | … | … | … | … | … | … | … | … | … | … | … | … |
| … | … | … | … | … | … | … | … | … | … | … | … | … | … | … | … | … | … | … | … | … | … |
| … | … | … | … | … | … | … | … | … | … | … | … | … | … | … | … | … | … | … | … | … | … |
5 Results
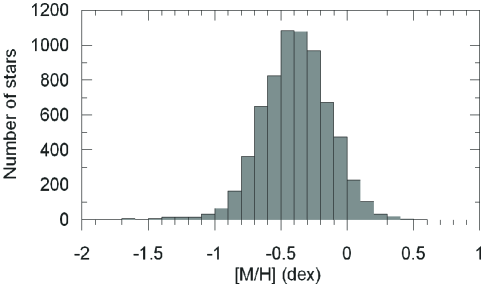
5.1 First hints of a metallicity gradient apparent in the RC sample of stars.
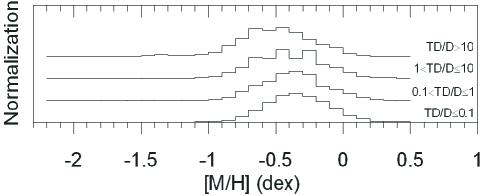
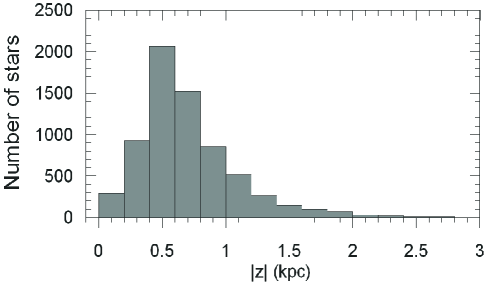
We show in Fig. 10 the distribution of metallicities for our final sample of RAVE RC stars. The metallicity distribution for all populations is rather symmetric with a mode at dex. In Fig. 11 we show the normalized metallicity distribution functions, with the sample sub-divided by probabilistic population assignment, as described above. This Fig. 11 gives an indication of a systematic shift of the mode, shifting to low metallicities when one goes from the thin disc stars to the thick disc stars (Fig. 11). The -distance distribution of our sample is shown in Fig. 12. While the typical star is at distance kpc, there is a significant sample at larger distances. The range in distance is large enough to allow us to consider vertical metallicity gradient estimation.
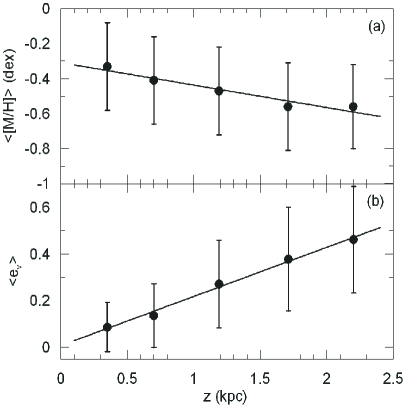
The whole sample of stars, with no consideration of population assignment, were separated into five bins in distance, and mean -distances from the Galactic plane, mean metallicities, and mean vertical eccentricities were calculated for each bin. These are presented in Table 3. Fig. 13 summarises the dependence of the results on vertical distance from the Galactic plane. The apparent variation of the mean metallicity with -distance from the Galactic plane in Fig. 13 indicates the existence of a vertical metallicity gradient for RC stars. This figure does not however allow discrimination between a true gradient in a consistently defined population (e.g. “thick disc”) and a changing relative contribution from two populations (e.g. “thin disc” and “thick disc”), which have different modal abundances, and for which either one, both, or neither has an intrinsic gradient. Also given in Fig. 13 is the variation of the vertical eccentricity with , which again shows either a smooth transition from thin disc to thick disc eccentricities, or a changing population mix, or both disc.
| ranges | N | |||
|---|---|---|---|---|
| (kpc) | (kpc) | (dex) | ||
| (0.0, 0.5] | 2261 | 0.35 | -0.330.25 | 0.0870.106 |
| (0.5, 1.0] | 3376 | 0.70 | -0.410.25 | 0.1610.136 |
| (1.0, 1.5] | 857 | 1.19 | -0.470.25 | 0.2710.187 |
| (1.5, 2.0] | 222 | 1.71 | -0.560.25 | 0.3780.222 |
| (2.0, 2.5] | 54 | 2.20 | -0.560.24 | 0.4600.228 |
5.2 Metallicity gradients using the kinematical population assignment method
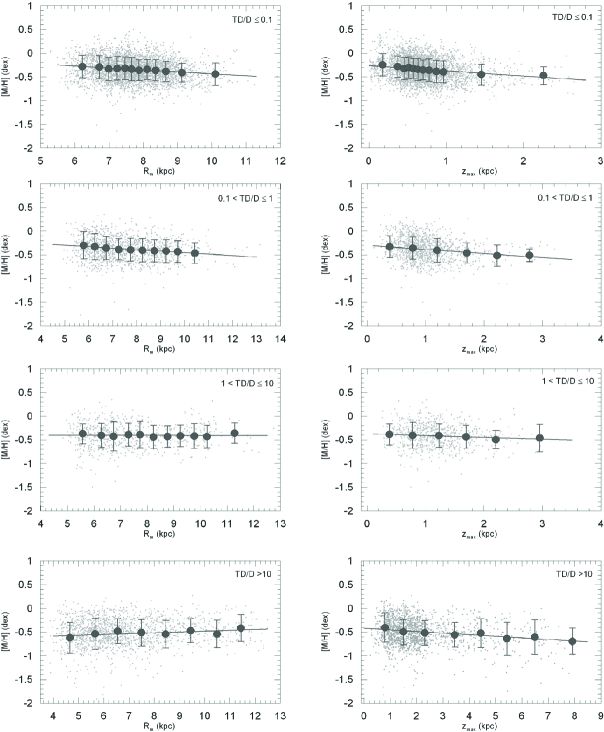
We consider the metallicities as a function of the mean orbital Galactocentric radial distance () and maximum distance to the Galactic plane () for each different population defined in Section 4, and test for the presence of vertical and radial metallicity gradients for each population. We fitted the distributions to linear equations, whose gradient is any metallicity gradient, or . The results are shown in Fig. 14.
The radial gradients are small or consistent with zero. The best determined value (largest ratio of gradient value to error value) is for low probability thin disc stars, where the gradient is dex kpc-1 (Table 4). The only metallicity gradient consistent with zero (with small formal errors) is for low probability thick disc stars.
The vertical metallicity gradients are (absolutely) much larger than the radial ones, and statistically are detected. The largest gradient in the vertical direction is steeper for high probability thin disc stars, relative to the other populations, viz dex kpc-1. Additionally, the metallicity gradient for high probability thick disc stars is not zero, i.e. dex kpc-1.
| Population type | Sample size | ||
|---|---|---|---|
| (dex kpc-1) | (dex kpc-1) | ||
| -0.0410.003 | -0.1090.008 | 3385 | |
| -0.0310.003 | -0.0860.013 | 1151 | |
| -0.0010.005 | -0.0360.016 | 646 | |
| 0.0170.008 | -0.0340.003 | 1599 | |
| -0.0410.007 | -0.2600.031 | 1269 | |
| -0.0250.040 | -0.1670.011 | 3448 | |
| -0.0130.004 | -0.1030.008 | 2389 | |
| 0.0220.006 | -0.0220.005 | 944 |
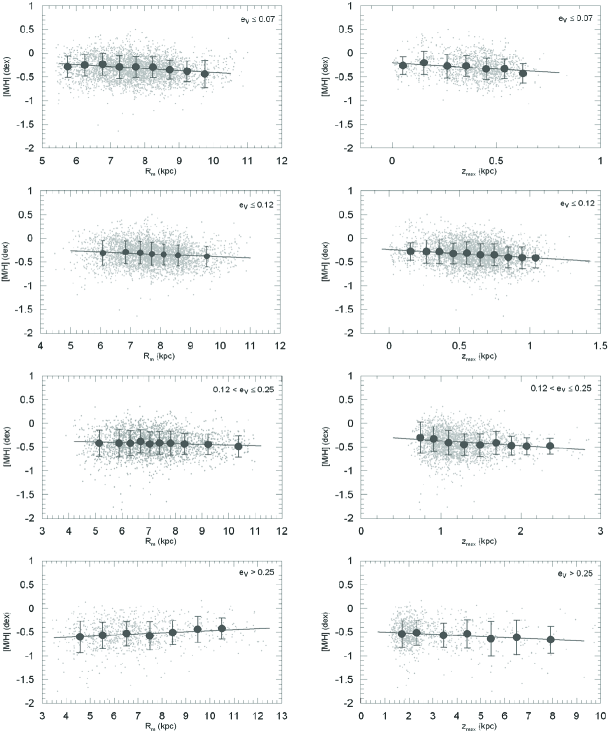
5.3 Metallicity gradients using the dynamical population assignment method
We now consider the metallicities as a function of the mean orbital Galactocentric radial distance () and maximum distance to the Galactic plane () for the populations defined by their eccentricities in Section 4.2, with one slight modification, in that we add a population defined by (1269 stars) representing the blue stars. We make this modification due to our experience in analysing the RAVE dwarf stars. In Coşkunoğlu et al. (2011a), we showed that the blue stars which have the smallest orbital eccentricities (most circular orbits) have also steeper metallicity gradients relative to samples with larger orbital eccentricities.
The results are presented in Table 4 and Fig. 15. The steepest metallicity gradient is for in the vertical direction, i.e. dex kpc-1. The vertical metallicity gradient systematically decreases with increasing values, becoming close to zero for the largest vertical eccentricities, . As noted above, our (red clump giants) sample consists of thin and thick disc stars. The largest orbital eccentricities correspond to thick disc stars.
That is, the vertical metallicity gradient for the thick disc is close to zero. The trend of the radial metallicity gradient is almost the same as the vertical metallicity gradient; less steep. For example, dex kpc-1 for .
6 Discussion and Conclusion
We have used the RAVE DR3 data release to identify RC stars, further excluding cool stars, and those with the most uncertain space motions. We used the calibrated RAVE DR3 metallicities and the mean radial and maximum distances to investigate the presence of radial and vertical metallicity gradients, dividing the sample into a variety of subsamples.
We derive significant radial and vertical metallicity gradients for high probability thin disc stars and for the subsample with . We derive significant and marginally shallower gradients for the other subsamples. We do not detect any significant gradients for thick disc stars. Vertical metallicity gradients are much steeper than the radial ones, for the same subsample, as (perhaps) expected. We derive the metallicity gradients for the subsample which are the youngest sample stars, to be dex kpc-1 and dex kpc-1.
The radial metallicity gradients for all subsamples are rather close to the corresponding ones obtained for F-type dwarfs. Hence, the discussion in Coşkunoğlu et al. (2011a) is also valid here. We cannot determine any vertical metallicity gradient for RAVE dwarfs due to their small distances from the Galactic plane. However, we can compare our results with those obtained for giants. Chen et al. (2011) investigated the metallicity gradient of the thick disc by using Red Horizontal Branch (RHB) stars from SDSS DR8 (Aihara et al., 2011) and they found two different vertical metallicity gradients estimated in two ways. One is a fit to the Gaussian peaks of the metallicity histograms of the thick disc by subtracting minor contributions from the thin disc and the inner halo based on the Besançon Galaxy model (Robin et al., 1996). The resulting gradient is dex kpc-1 for kpc. The other method is fitting the data linearly for the stars kpc where the thick disc is the dominant population. Five subgroups were then selected in different directions in the plane to investigate the difference in the vertical metallicity gradient between the Galactocentric and anti-Galactocentric directions. They found that a vertical gradient of dex kpc-1 was detected for five directions except for one involving the population of stars from the bulge.
Neither of the vertical metallicity gradients claimed by Chen et al. (2011) are in agreement with our results, nor are they consistent with studies appearing in previous works in the literature.
Another recent investigation of the vertical metallicity gradient for the thick disc is that of Ruchti et al. (2011). In that paper the authors gave a sample of 214 Red Giant Branch stars, 31 red clump/red horizontal branch stars, and 74 main-sequence/sub-giant branch metal-poor stars. They found that the thick disc ratios are enhanced, and have little variation ( dex). Their sample further allowed, for the first time, investigation of the gradients in the metal-poor thick disc. For stars with dex, the thick disc shows very small gradients, dex kpc-1, in enhancement, while they found a dex kpc-1 radial gradient and a dex kpc-1 vertical gradient in iron abundance. We consider only the gradient in iron abundance, not the gradient in enhancement. We may transform published iron abundances to RAVE metallicity values by means of the equation (Zwitter et al., 2008),
| (10) |
This reveals that the Ruchti et al. (2011) vertical gradient is consistent with the vertical metallicity gradient determined here, within the errors, for high probability thick disc stars, dex kpc-1. However there is a difference between the corresponding radial metallicity gradients in the two studies. An explanation for this disagreement may be the differing metallicity range of the sample stars used in the two works. In the present study we consider stars with dex, with a minority at the metal-poor tail in our work, while the corresponding selection is dex in Ruchti et al. (2011).
The radial metallicity gradients we have estimated from red clumps giants stars are consistent with those derived in paper II for dwarfs (Coşkunoğlu et al., 2011a). The robust metallicity gradients we determine are dex kpc-1 for the high probability thin disc stars, the population type labelled with , and dex kpc-1 for the sample with eccentricity . Samples biased to low probability thin disc and thick disc stars show systematically shallower gradients. Complementary to the dwarf sample, the distance range of the red clump giant stars, with median distance of 1.4 kpc, provides information on vertical metallicity gradients. The vertical metallicity gradients for the high probability thin disc stars and for the sample with are dex kpc-1 and dex kpc-1, respectively. For high probability thick disc stars we could detect a vertical metallicity gradient; a shallow one however, i.e. dex kpc-1.
From our analysis, we may conclude that, despite their greater distances from the Galactic plane, the RAVE DR3 red clump giant stars confirm the radial metallicity gradients found for RAVE DR3 dwarf stars. Because of their greater distances from the Galactic plane, the RAVE DR3 RC stars also permit vertical metallicity gradients to be measured. These findings can be used to constrain formation scenarios of the thick and thin discs.
7 Acknowledgments
We would like to thank the referee Dr. Martin López-Corredoira for his useful suggestions that improved the readability of this paper.
Funding for RAVE has been provided by: the Australian Astronomical Observatory; the Leibniz-Institut fuer Astrophysik Potsdam (AIP); the Australian National University; the Australian Research Council; the French National Research Agency; the German Research Foundation; the European Research Council (ERC-StG 240271 Galactica); the Istituto Nazionale di Astrofisica at Padova; The Johns Hopkins University; the National Science Foundation of the USA (AST-0908326); the W. M. Keck foundation; the Macquarie University; the Netherlands Research School for Astronomy; the Natural Sciences and Engineering Research Council of Canada; the Slovenian Research Agency; the Swiss National Science Foundation; the Science & Technology Facilities Council of the UK; Opticon; Strasbourg Observatory; and the Universities of Groningen, Heidelberg and Sydney. The RAVE web site is at http://www.rave-survey.org
This publication makes use of data products from the Two Micron All Sky Survey, which is a joint project of the University of Massachusetts and the Infrared Processing and Analysis Center/California Institute of Technology, funded by the National Aeronautics and Space Administration and the National Science Foundation. This research has made use of the SIMBAD, NASA’s Astrophysics Data System Bibliographic Services and the NASA/IPAC ExtraGalactic Database (NED) which is operated by the Jet Propulsion Laboratory, California Institute of Technology, under contract with the National Aeronautics and Space Administration.
References
- Abazajian et al. (2003) Abazajian K, et al., 2003, AJ, 126, 2081
- Aihara et al. (2011) Aihara H., et al, 2011, ApJS, 193, 29
- Ak et al. (2007a) Ak S., Bilir S., Karaali S., Buser R., 2007a, AN, 328, 169
- Ak et al. (2007b) Ak S., Bilir S., Karaali S., Buser R., Cabrera-Lavers A., 2007b, NewA, 12, 605
- Alves (2000) Alves D. R., 2000, ApJ, 539, 732
- Bensby et al. (2003) Bensby T., Feltzing S., Lundström I., 2003, A&A 410, 527
- Bensby et al. (2005) Bensby T., Feltzing S., Lundström I., Ilyin I., 2005, A&A, 433, 185
- Bilir et al. (2006) Bilir S., Karaali S., Ak S., Yaz E., Hamzaoğlu E., 2006, NewA, 12, 234
- Bilir et al. (2008) Bilir S., Cabrera-Lavers A., Karaali S., Ak S., Yaz E., López-Corredoira M., 2008, PASA, 25, 69
- Bilir et al. (2011) Bilir S., Karaali S., Ak S., Önal Ö., Coşkunoǧlu B., Seabroke G. M., 2011, MNRAS, 418, 444
- Buser et al. (1999) Buser R., Rong J., Karaali S., 1999, A&A, 348, 98
- Cabrera-Lavers et al. (2007) Cabrera-Lavers A., Bilir S., Ak S., Yaz E., López-Corredoira M., 2007, A&A, 464, 565
- Chen et al. (2011) Chen Y. Q., Zhao G., Carrell K., Zhao J. K., 2011, AJ, 142, 184
- Coşkunoğlu et al. (2011a) Coşkunoğlu B., Ak S., Bilir S., Karaali S., Önal Ö., Yaz E., Gilmore G., Seabroke G. M., 2011a, MNRAS, tmp.1916
- Coşkunoğlu et al. (2011b) Coşkunoğlu B., et al., 2011b, MNRAS, 412, 1237
- Cutri et al. (2003) Cutri R. M., et al., 2003, 2MASS All-Sky Catalogue of Point Sources, CDS/ADC Electronic Catalogues, 2246
- Dehnen (1998) Dehnen W., 1998, AJ, 115, 2384
- De Simone et al. (2004) De Simone R. S., Wu, X., Tremaine S., 2004, MNRAS, 350, 627
- Dinescu et al. (1999) Dinescu D. I., Girard T. M., van Altena W. F., 1999, AJ, 117, 1792
- Du et al. (2004) Du C., Zhou X., Ma J., Shi J., Chen A. B., Jiang Z., Chen J., 2004, AJ, 128, 2265
- ESA (1997) ESA, 1997, The Hipparcos and Tycho Catalogues, ESA SP-1200. ESA, Noordwijk
- Famaey et al. (2005) Famaey B., et al., 2005, A&A, 430, 165
- Famaey et al. (2008) Famaey B., Siebert A., Jorissen A., 2008, A&A, 483, 453
- Fiorucci & Munari (2003) Fiorucci M., Munari U., 2003, A&A, 401, 781
- Gilmore & Wyse (1985) Gilmore G., Wyse R. F. G., 1985, AJ, 90, 2015
- Groenewegen (2008) Groenewegen M. A. T., 2008, A&A, 488, 25
- Hernquist (1990) Hernquist L., 1990, ApJ, 356, 359
- Johnson & Soderblom (1987) Johnson D. R. H., Soderblom D. R., 1987, AJ, 93, 864
- Johnston et al. (1995) Johnston K. V., Spergel D. N., Hernquist L., 1995, ApJ, 451, 598
- Karaali et al. (2003) Karaali S., Bilir S., Karataş Y., Ak S. G., 2003, PASA, 20, 165
- Keenan & Barnbaum (1999) Keenan P. C., Barnbaum C., 1999, ApJ, 518, 859
- Luck et al. (2006) Luck R. E., Kovtyukh V. V., Andrievsky S. M., 2006, AJ, 132, 902
- Luck et al. (2011) Luck R. E., Andrievsky S. M., Kovtyukh V. V., Gieren W., Graczyk D., 2011, AJ, 142, 51
- Luck & Lambert (2011) Luck R. E., Lambert D. L., 2011, AJ, 142, 136
- Mihalas & Binney (1981) Mihalas D., Binney J., 1981, Galactic Astronomy: Structure and Kinematics, 2nd edition, San Francisco, CA, W. H. Freeman and Co.
- Miyamoto & Nagai (1975) Miyamoto M., Nagai R., 1975, PASJ, 27, 533
- Nordström et al. (2004) Nordström B., et al., 2004, A&A, 418, 989
- Paczynski & Stanek (1998) Paczynski B., Stanek K. Z., 1998, ApJ, 494L, 219
- Pauli (2005) Pauli E. M., 2005, Prof. G. Manev’s Legacy in Contemporary Astronomy, Theoretical and Gravitational Physics (Eds. V. Gerdjikov and M. Tsvetkov), 185, Sofia, Bulgaria, Heron Press Limited, 2005.
- Peng et al. (2011) Peng X., Du C., Wu Z., 2011, arXiv1111.4719
- Pompéia et al. (2011) Pompéia L., et al., 2011, MNRAS, 415, 1138
- Puzeras et al. (2010) Puzeras E., Tautvaišienė G., Cohen J. G., Gray D. F., Adelman S. J., Ilyin I., Chorniy Y., 2010, MNRAS, 408, 1225
- Robin et al. (1996) Robin A. C., Haywood M., Créze M., Ojha D.K., Bienaymé O., 1996, A&A, 305, 125
- Roeser et al. (2010) Roeser S., Demleitner M., Schilbach E., 2010, AJ, 139, 2440
- Rong et al. (2001) Rong J., Buser R., Karaali S., 2001, A&A, 365, 431
- Ruchti et al. (2011) Ruchti G. R., et al., 2011, ApJ, 737, 9
- Shaver et al. (1983) Shaver P. A., McGee R. X., Newton L. M., Danks A. C., Pottasch S. R., 1983, MNRAS, 204, 53
- Siebert et al. (2011) Siebert A., et al., 2011, AJ, 141, 187
- Skrutskie et al. (2006) Skrutskie M. F., et al., 2006, AJ, 131, 1163
- Skuljan et al. (1999) Skuljan J., Hearnshaw J. B., Cottrell P. L., 1999, MNRAS, 308, 731
- Steinmetz et al. (2006) Steinmetz M., et al., 2006, AJ, 132, 1645
- Trefzger et al. (1995) Trefzger C. F., Pel J. W., Gabi S., 1995, A&A, 304, 381
- Wilson et al. (2011) Wilson M. L., et al., 2011, MNRAS, 413, 2235
- van Leeuwen (2007) van Leeuwen F., 2007, A&A, 474, 653
- Yaz & Karaali (2010) Yaz E., Karaali S., 2010, NewA, 15, 234
- Zwitter et al. (2008) Zwitter T., et al., 2008, AJ, 136, 421