Self-assembly scenarios of patchy colloidal particles
Günther Doppelbauer,∗a Eva G. Noya,b Emanuela Bianchi,a and Gerhard Kahla
The rapid progress in precisely designing the surface decoration of patchy colloidal particles offers a new, yet unexperienced freedom to create building entities for larger, more complex structures in soft matter systems. However, it is extremely difficult to predict the large variety of ordered equilibrium structures that these particles are able to undergo under the variation of external parameters, such as temperature or pressure. Here we show that, by a novel combination of two theoretical tools, it is indeed possible to predict the self-assembly scenario of patchy colloidal particles: on one hand, a reliable and efficient optimization tool based on ideas of evolutionary algorithms helps to identify the ordered equilibrium structures to be expected at ; on the other hand, suitable simulation techniques allow to estimate via free energy calculations the phase diagram at finite temperature. With these powerful approaches we are able to identify the broad variety of emerging self-assembly scenarios for spherical colloids decorated by four patches and we investigate and discuss the stability of the crystal structures on modifying in a controlled way the tetrahedral arrangement of the patches.
Experimental and theoretical investigations have provided unambiguous evidence that colloids with chemically or physically patterned surfaces (commonly known as “patchy particles”) are very promising mesoscopic entities that can be used in hierarchical self-assembly processes to build up colloidal super-structures 1, 2. The anisotropy in the interactions of such particles in combination with the limited functionality and selectivity of the bonds offer unlimited possibilities for self-assembly scenarios. Thus, patchy particles are celebrated “to become the elementary brick of tomorrow’s self-assembled materials” 3, with promising applications in photonic crystals, drug-delivery, electronics 4, biomaterials, or catalysis 5.
The possibility to tailor the interactions of patchy particles almost deliberately represents the basis for “bottom-up” strategies which allow to build up materials with desired properties, starting from adequately designed units. Suitable experimental techniques 6, 7, 8, 9 allow to position patches on the colloidal surface and to define their spatial extent with high precision. A very impressive example for such an approach is a recent work on triblock Janus particles 5: after decorating colloids with two hydrophobic caps of tunable area, particles self-organize in the two-dimensional Kagome lattice target structure. Complementary computer simulations 3, 10 have provided a complete phase diagram of the system, including also the disordered, fluid phase.
For the case of triblock Janus particles the self-assembly scenarios were easy to “guess”. However, for more complex decorations and three dimensional systems, it is considerably more difficult to identify all ordered structures into which the particles might self-assemble. Semi-empirical approaches, applied over many years in hard matter physics, rely on a pre-selection of candidate structures, based on experience, intuition or plausible arguments. In view of the rich wealth of unexpected ordered structures in soft matter systems such a procedure is bound to fail. In this contribution we propose a novel approach which helps to predict with high reliability the ordered equilibrium structures of a system of patchy colloidal particles. We evaluate the phase diagram for different tetrahedral patch arrangements based on a highly reliable pre-selection step, and we investigate the stability of the emerging structures. We provide a comprehensive classification of these structures in dependence of the patch geometry and interpret them in terms of the strong competition between energetic, entropic and packing contributions.
We use a standard model for patchy particles, introduced by Doye et al. 11, which has been used in numerous studies (e.g., Refs. 12, 13, 14, 15, 16, 17, 18, 19). An isotropic Lennard-Jones (LJ) potential (specifying the spherical colloids) is modulated by an orientationally dependent factor; the latter mimics the patches which can be “located” on arbitrary positions and with variable extent on the surface of the spherical colloidal particle. We use the LJ parameters and as units for length and energy. As in previous work 13, the patch width is fixed by the parameter , leading to rather narrow patches – the interaction strength of a bond decreases to half its value when the patch alignment deviates by an angle of 20 degrees from the perfect one. Additionally, the potential is truncated and smoothed at a cutoff distance of in order to prevent long-range interactions that are very unrealistic for colloids. Usually colloidal interactions are even of much shorter range, but this choice allows us to perform a comparison with previous results, if available. We also note, that the long-range contributions (which we define by , where is the minimum of the LJ potential) to the binding energies of the structures discussed in the following are well below ten percent of the total binding energy and of the same order of magnitude in all cases. In this contribution we consider only one value of the interaction range; however it has been shown, that a change in the interaction range can affect the regions of stability of the emerging phases 13, 20. Packing fractions are calculated as , and being the volume of and the number of particles in the primitive cell, respectively. Binding energy and pressure values are calculated as dimensionless quantities ( and , respectively).
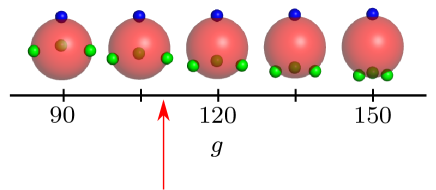
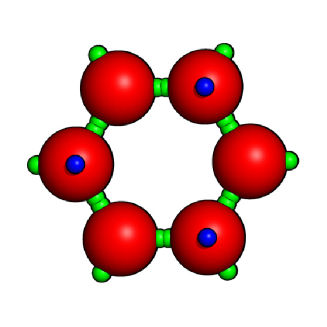
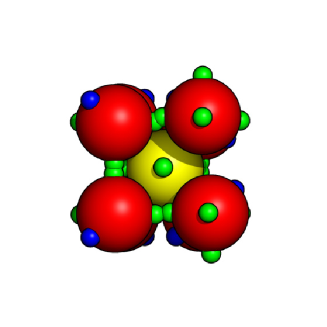
Here we focus on four-patch particles: introducing a geometrical parameter , we vary the patch positions on the surface, ranging from a rather elongated to a flat, compressed tetrahedral arrangement. More specifically, the first patch is fixed at the north pole of the particle, while the three remaining patches (with ) are located at a degree of latitude related to :
See Figure 1 for a visualization.
Our investigations display for the first time the surprisingly broad variety of ordered equilibrium structures that the particles are able to form when the regular tetrahedral arrangement of the patches is modified via the parameter .
In order to investigate the self-assembly scenarios of the system, we use a two-step approach, combining two efficient and reliable numerical tools. First, we identify at vanishing temperature possible ordered equilibrium structures by applying an optimization tool which is based on ideas of evolutionary algorithms (EAs) and searches essentially among all possible lattice structures 21. Second, we use suitably designed computer simulations 22, 13, 23 to evaluate the free energy of the candidate structures previously identified, as well as the free energy of disordered phases, leading to the phase diagram at finite . By performing full free energy calculations, we are thus including entropic contributions at nonvanishing temperature.
In numerous applications to a wide variety of systems, EAs have turned out to be reliable, efficient and robust 24, 25, 26, 18: they cope well with high dimensional search spaces and cost functions that depend on the search space coordinates in highly nontrivial ways. We note that a different structure prediction technique, based on Monte Carlo (MC) simulations, has been introduced in the recent literature 27. For a thorough comparison between these two approaches, applied to patchy systems, we refer to Ref. 28.
Working at constant pressure , the lattice parameters, the positions of the (up to eight 333For higher particle numbers, the computational cost of the optimizations rapidly increases. All the structures presented in this contribution can be realized with no more than four basis particles.) particles within the primitive cell and their orientations are optimized by minimizing the Gibbs free energy, which reduces to the enthalpy at . To cope with the large number of parameters, we use a phenotype implementation of EA based optimization techniques 25, 18. In short, such a scheme combines evolutionary global optimization with local optimization steps. In the former, a set of candidate solutions (a “population” consisting of “individuals”), each characterized by its search space coordinates and a fitness value (the latter being a function of its Gibbs free energy), is undergoing an evolutionary process; recombination and mutation operations are used in order to create new individuals, whose fitness values are expected to gradually improve. The local optimization is carried out by a quasi-Newton algorithm, namely L-BFGS-B 29, 30. The algorithm described in Ref. 18 has been augmented in the following way: (i) we make use of the angle-axis description for handling rotations of rigid bodies first introduced for soft matter systems with anisotropic particles in Ref. 31. A detailed description and examples for successful application can be found in Refs. 32, 33. (ii) Since the time-consuming local optimization steps are independent from each other, they can be carried out simultaneously on different processors. Further, we drop the concept of generations in the algorithm and use an implementation of the pool based approach described in Ref. 26 instead. (iii) Along the evolutionary process, bond order parameters 34, 35 are used to distinguish between energetically equivalent, but structurally different lattices in order to retain a diverse population by employing structural niches 36. The algorithm does not only keep track of the global minimum structure, but also of low-lying local minima, which might become dominant at finite 37. As in any nondeterministic optimization approach there is no guarantee that the lowest identified minimum is indeed the global one, therefore, in a strict sense, we have to consider our structures putative groundstates 38. However, we affirmed our results by performing a large number of independent optimization cycles at each state point.
The structures suggested by the EA are replicated as starting configurations for NPT MC simulations, with typically about 500 particles in the simulation box. The equations of state of the fluid and solid phases are calculated using these simulations. For solids with non cubic symmetry the shape of the simulation cell is allowed to change during the simulations to obtain the equilibrium structure of the solid at each thermodynamic state. Free energies of solids are calculated using the Einstein molecule approach 22, 23, 39, based on modifications of the Frenkel-Ladd method 40. The orientational degrees of freedom need special treatment, explained in further detail in the supplementary material†. The free energy of the liquid is obtained by thermodynamic integration from the ideal gas. Once the free energy at a state point is known, free energies at other states are calculated by thermodynamic integration. Coexistence points are obtained by finding the temperature and pressure at which the chemical potential of the two phases in coexistence are equal. Once a coexistence point is known, the whole coexistence line can be integrated by using the Gibbs-Duhem method 41.
We start the discussion of our results with the ordered equilibrium structures at 444Note that for many values of the geometry parameter, the patchy interactions lead to – sometimes strong – deviations from perfectly symmetrical lattices. Therefore we refer to the structures we identified as bcc-like, fcc-like or hcp-like to indicate such aberrations.. The broad variety of identified lattice structures is summarized in Figure 2.
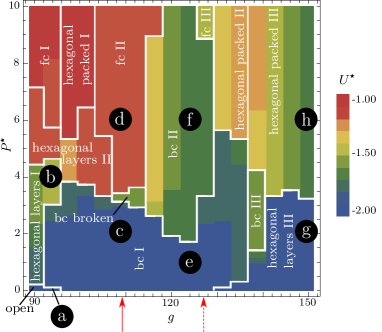
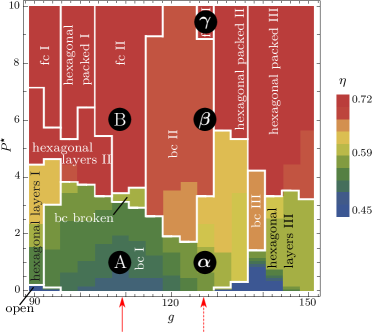
The topologies of the energy- and packing fraction-landscapes are the result of a complex competition between two mechanisms: packing (minimizing ) vs. bond saturation (minimizing the energy ). Accordingly, we can identify three regions in space:
(i) For pressure values up to fully bonded structures (i.e., ) dominate, which have rather small packing fractions, from for open structures to for distorted body-centered (bc) structures (compared to for close-packed spheres). The spectrum of identified lattices ranges from open, layered structures () over bc lattices (which dominate over a broad range, i.e., ) to layers of hexagonally arranged particles for . (ii) For the transition from low- to high-pressure structures is characterized by an abrupt drop in the bond saturation, increasing from nearly full bonding (i.e., ) to a value of around . In this range of , the location of the patches does not allow for the formation of strong bonds, thus pressure rather easily wins over bond saturation.
(iii) In contrast, for , increases more smoothly with and the identified ordered structures are the result of a delicate tradeoff between saturation and packing. In particular we emphasize that for selected values (i.e., and ) the respective patch decorations support both a high degree of bond saturation as well as the formation of high density lattices. As a consequence, the identified structures are able to persist even up to high pressure values (i.e., ) while maintaining a relatively low binding energy (i.e., ).
The complex topology of the energy and packing fraction landscapes shown in Figure 2 is elucidated in the following by a more detailed discussion of the identified ordered equilibrium structures for four representative values. Visual representations of the equilibrium structures at the state points specified in the left panel of Figure 2 by labels “a” to “h” can be found in the supplementary material†.
For a layered structure with full bond saturation () is formed at very low pressure (): each layer consists of fully bonded particles, forming a honeycomb lattice; the inter-layer bonding is realized via the patches located at the north poles (“a”). Upon compression, the system forms a hcp-like structure (i.e., AB stacking of hexagonally arranged layers) which is characterized by rather weak intra-layer () and stronger inter-layer () bonds (“b”).
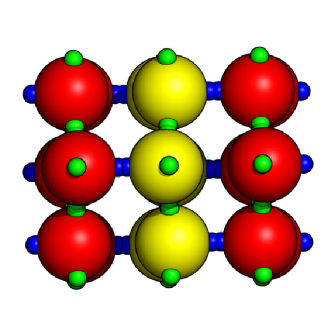
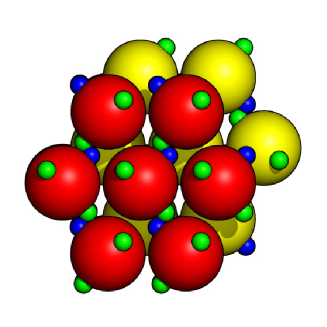
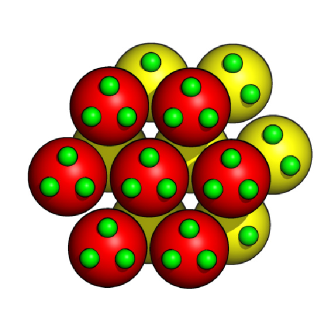
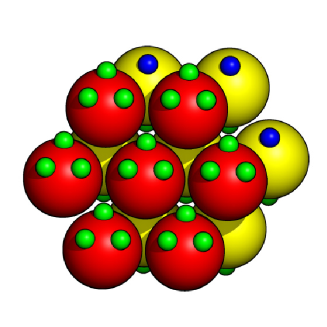
For the case of a regular tetrahedral patch arrangement (), particles arrange – as expected – at low in a bcc-like lattice (“c”). As discussed in Ref. 13, the bcc-like configuration can be seen as two interpenetrating diamond lattices, which only interact via mutual repulsion at short distances. The optimized lattice at shows another property: The two sublattices are slightly shifted against each other, i.e., particles of sublattice A do not lie exactly in the center of the voids of sublattice B and vice versa 555In Figure 2, central left panel, of the supplementary material†, the yellow particles would lie exactly on top of the red particles in a perfect bcc lattice.. By this rearrangement, optimal bond lengths can be retained at higher densities. At pressure values , a variant of the bcc-like structure, where one of the bonds is broken in order to increase the packing fraction by nine percent, is stable. For larger , the transition into a compact fcc-like structure (with and , “d”) takes place. We note that hcp-like structures are also identified by the search algorithm as low-lying local minima at high pressure, but turn out to be thermodynamically unstable in this model. For a more detailed study, we refer to Ref. 42.
For , we encounter a lattice with the same bonding pattern as the aforementioned bcc/double diamond lattice for low pressure values (“e”). The ordered medium pressure phase is different from the one encountered for the regular tetrahedral patch decoration: particles self-assemble now in a rather closely packed bc-like lattice (, “f”). However, the particular patch decoration allows now for a considerably enhanced bond saturation: bonds are formed between second-nearest neighbours in the bcc-like lattice, i.e., along the edges of the bcc-like unit cell, leading to . This is the only configuration with that is able to survive up to the highest pressure values investigated.
Finally, for , the ordered low phase can be viewed as a stacking of staggered, hexagonally ordered double layers: each double layer is formed by two congruent hexagonal particle arrangements, bonded to each other via the patch located at the north pole. The double layers themselves are connected via the three patches located at the basis; the bonds are fully saturated (“g”). For the high pressure phase (i.e., ), the system forms an ABAB… stacking of hexagonally close-packed layers. Like in the low pressure configuration, the particles are essentially unbonded within these layers, but establish relatively strong bonds to the neighbouring layers (with , “h”). In contrast to the low pressure structures, the particle axes are tilted against the normal vector of the layers, thereby breaking one bond per particle and considerably decreasing the interlayer distance.
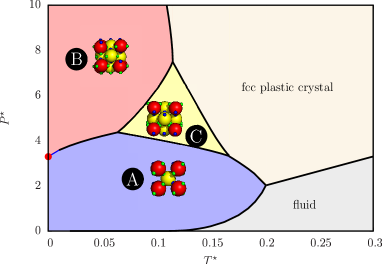
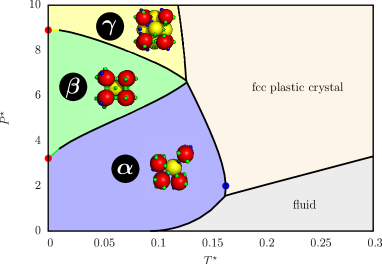
With the candidate structures suggested by the optimization procedure we can now proceed to the evaluation of the phase diagram at finite temperature (i.e. up to ). In addition to the energetic and packing contributions to the thermodynamic potential, entropic effects come into play and configurations that correspond to local enthalpy minima at might be stabilized at finite . Thus we also consider lattices that are identified by the optimization procedure as minima that differ in enthalpy at most by twenty percent from the global minimum structure at some pressure value. A thorough investigation of the competition between structures corresponding to local minima on the enthalpy landscape for a specific geometry can be found in Ref. 42. Here, we selected two patch decorations, which we consider to be of particular interest. The first one is specified by , corresponding to the regular tetrahedral patch arrangement. As the second one (), we chose a geometry for which three different stable configurations have been identified at ; among those is the aforementioned strongly bonded bc structure, which can persist up to high pressure values.
When the particles are decorated via a regular tetrahedral patch arrangement, the phase diagram shows (cf. Figure 3, left panel) that two of the candidate structures predicted to be stable at are able to survive over a relatively large temperature range: the bcc-like/double diamond configuration at low (“A” in Figure 3) and the fcc-like configuration at high (“B”). The broken bcc-like/double diamond structure on the other hand plays only a minor role in the temperature range considered: our calculations suggest that it is only stable for . On increasing , an additional fcc-like phase (“C”), which is closely related to a local minimum on the () enthalpy landscape 666More specifically, the fourth-lowest local minimum predicted by the optimization method is structurally and orientationally very similar and immediately relaxes to structure “C” in the MC simulations., becomes stable 42. Its region of stability emerges out of a triple point () and rapidly extends with increasing temperature at the cost of the two low temperature phases. With further increasing temperature, the spatially and orientationally ordered lattices transform via first order transitions at low pressure into the liquid phase and at intermediate and high pressure into an fcc structure with perfect symmetry, where the particles are orientationally disordered (plastic crystal). At even higher temperatures (not investigated here) the coexistence pressure of the plastic crystal and the fluid phase will gradually increase.
Diamond cubic and diamond hexagonal structures, which represent local minima at very low values, are never stable, but might be stabilized by shifting the minimum of the interaction potential to smaller inter-particle distances (cf. Ref. 13). Comparing the present results with the ones from Ref. 13, we note that the high density fcc-like configuration (“B”), which has not been taken into account for the previous calculations, makes the phase diagram considerably more complex.
The phase diagram of the second system investigated (cf. Figure 3, right panel) displays some additional interesting features. With increasing , the predicted low- and high-pressure phases (bc-like, “” and fcc-like, “”, respectively in Figure 3) extend their region of stability at the cost of the region of stability of the high density bcc-like phase (“”). This region terminates in two very close triple points (“”-“”-“” and “”-“”-fcc plastic crystal). At low , the “” phase transforms into the fluid phase, while at intermediate and high , the “”and the “” phases transform via first order phase transitions into the fcc plastic crystal phase. We also observe a re-entrant scenario, which occurs along the coexistence line between the plastic crystal and the “” phase. In a narrow temperature range (i.e., for ) the orientational disorder is first replaced by orientational order and is eventually re-established upon lowering pressure. The origin of this behaviour is the higher compressibility of the fcc plastic crystal compared to the bc-like “” solid. The latter structure is stabilized by its low energy, which is only obtained when the bond length is close to the LJ minimum.
The high degree of internal consistency between the two methodological approaches combined in this contribution is corroborated by the fact that the coexistence lines evaluated via simulations, tend towards the coexistence pressure value predicted by the optimization procedure for (indicated by dots on the -axes in Figure 3).
The detailed structural analysis and the phase diagrams presented in this contribution have provided quantitative evidence of the complex phase behaviour and the broad variety of ordered equilibrium structures into which patchy particles are able to self-assemble. These highly complex configurations are the result of an intricate competition between bond formation, packing and entropy. The possibility to discriminate between different structural particle arrangements that are separated only by minute energy differences in combination with its reliability make our conceptual approach highly suitable for future structural and thermodynamic investigations of patchy particle systems.
Financial support by the Austrian Science Foundation (FWF) under Project Nos. W004, P23910-N16 and M1170-N16 are gratefully acknowledged. E.G.N. acknowledges support from Grants Nos. FIS2010-15502 from the Dirección General de Investigación and S2009/ESP-1691 (program MODELICO) from the Comunidad Autónoma de Madrid.
References
- Pawar and Kretzschmar 2010 A. B. Pawar and I. Kretzschmar, Macromol. Rapid. Commun., 2010, 31, 150.
- Bianchi et al. 2011 E. Bianchi, R. Blaak and C. N. Likos, Phys. Chem. Chem. Phys., 2011, 13, 6397.
- Romano and Sciortino 2011 F. Romano and F. Sciortino, Nat. Mater., 2011, 10, 171.
- Pawar and Kretzschmar 2009 A. B. Pawar and I. Kretzschmar, Langmuir, 2009, 25, 9057.
- Chen et al. 2011 Q. Chen, S. C. Bae and S. Granick, Nature, 2011, 469, 381.
- Zhang et al. 2006 G. Zhang, D. Wang and H. Möhwald, Chem. Mater., 2006, 18, 3985.
- Kraft et al. 2009 D. J. Kraft, J. Groenewold and W. K. Kegel, Soft Matter, 2009, 5, 3823.
- Rastogi et al. 2010 V. Rastogi, A. A. García, M. Marquez and O. D. Velev, Macromol. Rapid Commun., 2010, 31, 190.
- Gangwal et al. 2010 S. Gangwal, A. B. Pawar, I. Kretzschmar and O. D. Velev, Soft Matter, 2010, 6, 1413.
- Romano and Sciortino 2011 F. Romano and F. Sciortino, Soft Matter, 2011, 7, 5799.
- Doye et al. 2007 J. P. K. Doye, A. A. Louis, I. C. Lin, L. R. Allen, E. G. Noya, A. W. Wilber, H. C. Kok and R. Lyus, Phys. Chem. Chem. Phys., 2007, 9, 2197.
- Noya et al. 2007 E. G. Noya, C. Vega, J. P. K. Doye and A. A. Louis, J. Chem. Phys., 2007, 127, 054501.
- Noya et al. 2010 E. G. Noya, C. Vega, J. P. K. Doye and A. A. Louis, J. Chem. Phys., 2010, 132, 234511.
- Wilber et al. 2007 A. W. Wilber, J. P. K. Doye, A. A. Louis, E. G. Noya, M. A. Miller and P. Wong, J. Chem. Phys., 2007, 127, 085106.
- Wilber et al. 2009 A. W. Wilber, J. P. K. Doye, A. A. Louis and A. C. F. Lewis, J. Chem. Phys., 2009, 131, 175102.
- Williamson et al. 2011 A. J. Williamson, A. W. Wilber, J. P. K. Doye and A. A. Louis, Soft Matter, 2011, 7, 3423.
- van der Linden et al. 2012 M. van der Linden, J. P. K. Doye and A. A. Louis, J. Chem. Phys., 2012, 136, 054904.
- Doppelbauer et al. 2010 G. Doppelbauer, E. Bianchi and G. Kahl, J. Phys.: Condens. Matter, 2010, 22, 104105.
- Antlanger et al. 2011 M. Antlanger, G. Doppelbauer and G. Kahl, J. Phys.: Condens. Matter, 2011, 23, 404206.
- Romano et al. 2010 F. Romano, E. Sanz and F. Sciortino, J. Chem. Phys., 2010, 132, 184501.
- Gottwald et al. 2005 D. Gottwald, G. Kahl and C. N. Likos, J. Chem. Phys., 2005, 122, 204503.
- Vega and Noya 2007 C. Vega and E. G. Noya, J. Chem. Phys., 2007, 127, 154113.
- Vega et al. 2008 C. Vega, E. Sanz, J. L. F. Abascal and E. G. Noya, J. Phys.: Condens. Matter, 2008, 20, 153101.
- Woodley and Catlow 2008 S. M. Woodley and R. Catlow, Nat. Mat., 2008, 7, 937.
- Oganov and Glass 2006 A. R. Oganov and C. W. Glass, J. Chem. Phys., 2006, 124, 244704.
- Bandow and Hartke 2006 B. Bandow and B. Hartke, J. Phys. Chem. A, 2006, 110, 5809.
- Filion et al. 2009 L. Filion, M. Marechal, B. van Oorscht, D. Pelt, F. Smallenburg and M. Dijkstra, Phys. Rev. Lett., 2009, 103, 188302.
- Bianchi et al. 2012 E. Bianchi, G. Doppelbauer, L. Filion, M. Dijkstra and G. Kahl, J. Chem. Phys., 2012, in press, arXiv: 1205.3685 [cond–mat.soft].
- Byrd et al. 1995 R. H. Byrd, P. Lu and J. Nocedal, SIAM J. Sci. Stat. Comp., 1995, 16, 1190–1208.
- Zhu et al. 1997 C. Zhu, R. H. Byrd and J. Nocedal, ACM Trans. Math. Software, 1997, 23, 550–560.
- Wales 2005 D. J. Wales, Phil. Trans. Roy. Soc. A, 2005, 363, 357.
- Chakrabarti and Wales 2009 D. Chakrabarti and D. J. Wales, Phys. Chem. Chem. Phys., 2009, 11, 1970.
- Fejer et al. 2011 S. N. Fejer, D. Chakrabarti and D. J. Wales, Soft Matter, 2011, 7, 3553.
- Steinhardt et al. 1983 P. J. Steinhardt, D. R. Nelson and M. Ronchetti, Phys. Rev. B, 1983, 28, 784.
- Lechner and Dellago 2008 W. Lechner and C. Dellago, J. Chem. Phys., 2008, 129, 114707.
- Hartke 1999 B. Hartke, J. Comput. Chem., 1999, 20, 1752.
- Wales 2003 D. J. Wales, Energy Landscapes, Cambridge University Press, Cambridge, 2003.
- Wales and Scheraga 1999 D. J. Wales and H. A. Scheraga, Science, 1999, 27, 1368.
- Aragones and Vega 2009 J. L. Aragones and C. Vega, J. Chem. Phys., 2009, 130, 244504.
- Frenkel and Ladd 1984 D. Frenkel and A. J. C. Ladd, J. Chem. Phys., 1984, 81, 3188.
- Kofke 1993 D. A. Kofke, J. Chem. Phys., 1993, 98, 4149.
- Doppelbauer et al. 2012 G. Doppelbauer, E. G. Noya, E. Bianchi and G. Kahl, J. Phys.: Condens. Matter, 2012, in press, arXiv: 1205.5232 [cond–mat.soft].
Supplementary information
Orientational reference Hamiltonian
When calculating free energies of systems consisting of anisotropically interacting particles via the Frenkel-Ladd method, the reference Hamiltonian includes an orientational term. The contribution to the entropy stemming from the orientational degrees of freedom can be accounted for by integrating to a reference Einstein crystal in which the particles are coupled to an orientational field that tends to align the particles with the same orientation as in the solid structure under study. It is usually convenient that the orientational field exhibits the same symmetry as the particles23. Therefore we used two different orientational fields for each of the geometries of the particles for which the phase diagram at finite T was computed. For the perfect tetrahedral case (with symmetry), the orientation of each particle in the reference structure can specified by two unitary vector and that are colinear with any two specified patches, and the orientational field is defined as:13, 23
| (1) |
where is the coupling parameter, which has units of energy, and () is the angle formed by the closest patch in the instantaneous orientation of molecule and the vector () in the reference structure. The particles with 127.50 have symmetry. In this case the orientation of the particles is defined by a vector colinear to the patch at the ”north pole” () and the other is colinear to one of the other three patches (). The orientational field is the defined as:
| (2) |
Visual representations of selected ordered equilibrium structures at
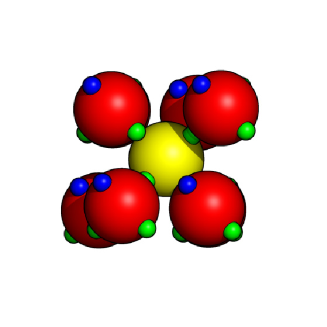
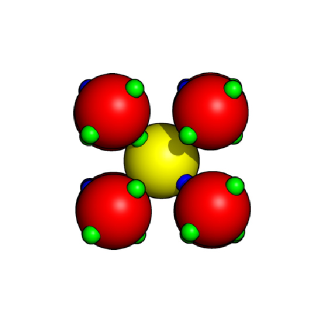
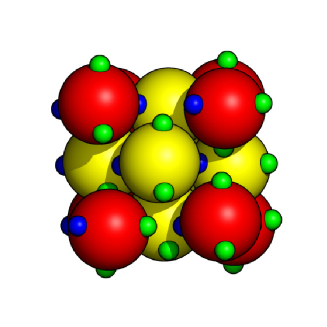
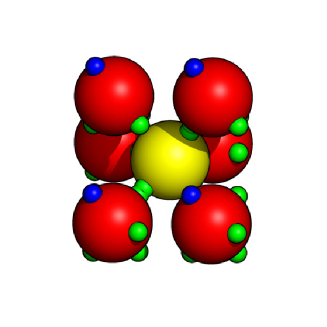
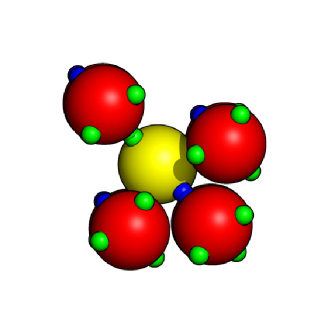
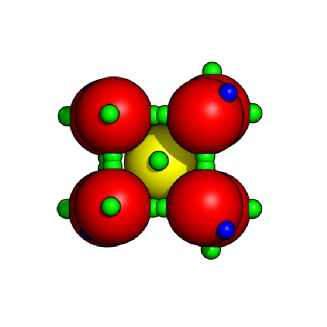
In Figures 1 to 4, we display the ordered equilibrium structures identified at for those systems that are specified in the panels of Figure 2 of the main article by labels “a” to “h”. For the convenience of the reader, we repeat here the descriptions of these strucutres provided in the main article.
-
•
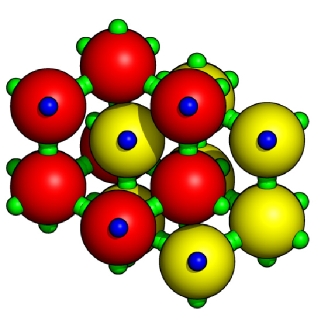
“a - open”: layered structure with full bond saturation; each layer consists of fully bonded particles, forming a honeycomb lattice; the inter-layer bonding is realized via the patches located at the north poles
-
•
“b - hexagonal layers I”: hcp-like structure (i.e., AB stacking of hexagonally arranged layers) which is characterized by rather weak intra-layer and stronger inter-layer bonds
-
•
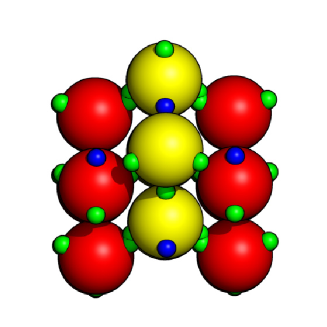
“c - bc I”: bcc-like configuration; can be seen as two interpenetrating diamond lattices, which only interact via mutual repulsion at short distances; the two sublattices are slightly shifted against each other, i.e., particles of sublattice A do not lie exactly in the center of the voids of sublattice B and vice versa, as can be seen in the central left panel of figure 5: the yellow particles would lie exactly on top of the red particles in a perfect bcc lattice
-
•
“d - fc II”: compact, almost close-packed fcc-like structure
-
•
“e - bc I”: lattice with the same bonding pattern as structure “c” (bcc/double diamond), but slightly different arrangement of the colloidal particles
-
•
“f - bc II”: rather closely packed bc-like lattice; the particular patch decoration allows for a high bond saturation: bonds are formed between second-nearest neighbours in the bcc-like lattice, i.e., along the edges of the bcc-like unit cell
-
•
“g - hexagonal layers III”: stacking of staggered, hexagonally ordered double layers: each double layer is formed by two congruent hexagonal particle arrangements, bonded to each other via the patch located at the north pole; the double layers themselves are connected via the three patches located at the basis; all bonds are fully saturated
-
•
“h -hexagonal packed III”: ABAB… stacking of hexagonally close-packed layers; particles are essentially unbonded within these layers, but establish relatively strong bonds to the neighbouring layers
|
|
|
|---|---|
|
|
|
|
|
|---|---|
|
|
|

|
|
|
|

|
|
|
|
|---|---|
|
|
|
|
|

|
|---|---|
|
|
|