The Diffuse Gamma-ray Background from Type Ia Supernovae
Abstract
The origin of the diffuse extragalactic gamma-ray background (EGB) has been intensively studied but remains unsettled. Current popular source candidates include unresolved star-forming galaxies, starburst galaxies, and blazars. In this paper we calculate the EGB contribution from the interactions of cosmic rays accelerated by Type Ia supernovae (SNe), extending earlier work which only included core-collapse SNe. We consider Type Ia events not only in star-forming galaxies, but also in quiescent galaxies that lack star formation. In the case of star-forming galaxies, consistently including Type Ia events makes little change to the star-forming EGB prediction, so long as both SN types have the same cosmic-ray acceleration efficiencies in star-forming galaxies. Thus, our updated EGB estimate continues to show that star-forming galaxies can represent a substantial portion of the signal measured by Fermi. In the case of quiescent galaxies, conversely, we find a wide range of possibilities for the EGB contribution. The dominant uncertainty we investigated comes from the mass in hot gas in these objects, which provides targets for cosmic rays; total gas masses are as yet poorly known, particularly at larger radii. Additionally, the EGB estimation is very sensitive to the cosmic-ray acceleration efficiency and confinement, especially in quiescent galaxies. In the most optimistic allowed scenarios, quiescent galaxies can be an important source of the EGB. In this case, star-forming galaxies and quiescent galaxies together will dominate the EGB and leave little room for other contributions. If other sources, such as blazars, are found to have important contributions to the EGB, then either the gas mass or cosmic-ray content of quiescent galaxies must be significantly lower than in their star-forming counterparts. In any case, improved Fermi EGB measurements will provide important constraints on hot gas and cosmic rays in quiescent galaxies.
1 Introduction
The first observation of the diffuse extragalactic gamma-ray background (EGB) was reported by the SAS-2 satellite (Fichtel et al., 1977, 1978). Recently, the Fermi Gamma-ray Space Telescope updated the EGB determination from the Energetic Gamma-ray Experiment Telescope (Sreekumar et al., 1998) and provided the most reliable EGB observations so far (Abdo et al., 2009a). Measurements of EGB are model dependent in that they require subtraction of the large foreground emission from our Galaxy (e.g., Hunter et al., 1997). The accuracy of the EGB measurement thus greatly depends on our understanding of the Galactic emission. Despite the difficulty in its observation, the EGB encodes important information about the highest-energy environments in the cosmos.
The EGB arises from the combination of all the unresolved extragalactic gamma-ray sources (e.g., Dermer, 2007b; Stecker & Venters, 2011). “Guaranteed” EGB components arise from unresolved counterparts of known extragalactic populations, namely, blazars (those active galactic nuclei that have their relativistic jets pointing at us, e.g., Padovani et al., 1993; Stecker et al., 1993; Mukherjee & Chiang, 1999; Pavlidou & Venters, 2008; Dermer, 2007a; Venters, 2010; Venters & Pavlidou, 2011; Inoue & Totani, 2009), as well as normal star-forming galaxies and starburst galaxies (e.g., Pavlidou & Fields, 2001, 2002; Prodanović & Fields, 2006; Thompson et al., 2007; Stecker, 2007; Fields et al., 2010; Makiya et al., 2011). Additional EGB contributions might arise from more exotic sources, such as dark matter annihilation (Silk & Srednicki, 1984; Rudaz & Stecker, 1991), annihilations at the boundaries of cosmic matter and antimatter domains (Stecker et al., 1971), massive black holes at redshifts of (Gnedin & Ostriker, 1992), and primordial black hole evaporation (Page & Hawking, 1976).
In this paper we will focus on the EGB contribution from both star-forming galaxies and quiescent galaxies. Quiescent galaxies refer to galaxies with little or no active star formation, and these objects have not been included in EGB estimations. In terms of galaxy types, quiescent galaxies usually include all elliptical galaxies and some S0 galaxies. However, the important factor for the EGB estimation is not the galaxy type but the amount of star formation. Therefore we will separately consider star-forming and quiescent galaxies, and assume no star formation in quiescent galaxies. We will not consider the EGB contribution from starburst galaxies in this paper, due to the larger uncertainty in the cosmic-ray propagation in such galaxies (e.g., Thompson et al., 2007; Lacki et al., 2011). Also, recent work suggests that starburst galaxies only have small contribution to the EGB (Stecker & Venters, 2011). We follow the criterion adopted in Fields et al. (2010) to distinguish star-forming and starburst galaxies. The EGB energy range we consider in this paper is from MeV to GeV, which is the energy range covered by Fermi data and includes the regime in which star-forming galaxies may contribute substantially to the EGB.
Our focus here is on the EGB contribution arising from hadronic cosmic-ray interactions with the interstellar medium (ISM) of their host galaxies, specifically pion production and decay . The most favored possibility of the cosmic-ray production sites in galaxies is supernovae (SNe). Fermi and air Čerenkov observations detect individual remnants of both core-collapse (hereafter CC; Abdo et al., 2010; Acciari et al., 2010; Weekes et al., 1989) and Type Ia events (Acciari et al., 2011; Acero et al., 2010). The energetics of these objects are consistent with the requirements of efficient cosmic-ray acceleration (e.g., Abdo et al., 2010; Reynolds & Ellison, 1992), and the GeV spectra of these objects are consistent with pionic emission and thus hadronic acceleration (e.g., Abdo et al., 2009b; Tanaka et al., 2011; Ellison et al., 2012). Diffuse Galactic emission is similarly consistent with pionic emission dominating (Abdo et al., 2009a, c). These data thus give empirical grounding to the long-held belief that SNe of all types are the dominant engines that accelerate Galactic cosmic rays (e.g., Baade & Zwicky, 1934; Ginzburg & Syrovatskii, 1964; Ellison et al., 1997). We are thus interested in SNe of both types, all of which accelerate cosmic rays in their host galaxies.
Many groups have studied the EGB emission from cosmic rays accelerated by SNe in star-forming galaxies (e.g., Dar & Shaviv, 1995; Prodanović & Fields, 2006; Fields et al., 2010; Stecker & Venters, 2011; Makiya et al., 2011). Some estimations suggest that star-forming galaxies can be the dominant source of the EGB (Fields et al., 2010), while other groups predict that a major contribution of the EGB comes from blazars (Stecker & Venters, 2011; Makiya et al., 2011; Inoue & Totani, 2009). However, there exist large uncertainties from the source inputs. Most of the analyses regarding star-forming galaxies focused on the EGB contribution from cosmic rays accelerated by CC SNe and implicitly assume that only these events accelerate cosmic rays. We extend the analysis of the EGB from star-forming galaxies in Fields et al. (2010) to include Type Ia SNe as accelerators in the Milky Way and in other galaxies.
CC SNe arise in massive stars with short lifetimes, and thus trace ongoing star formation. In contrast, Type Ia SNe result from thermonuclear runaway of white dwarfs accreting mass from their companion stars and hence are related to star formation with some delay time. For this reason, observations have shown that Type Ia SNe exist in both star-forming galaxies and quiescent galaxies, while CC SNe are rarely seen in quiescent galaxies (Filippenko, 2001; Mannucci et al., 2005). Observations have suggested that the intrinsic cosmic CC SN rate is about 5 times higher than the intrinsic cosmic Ia SN rate at redshift (Bazin et al., 2009). Also, studies suggest that the Ia rate in a star-forming galaxy is much larger than that in a quiescent galaxy; this reflects the distribution of delay times between progenitor birth and Ia explosion, which is weighted towards short delays (Mannucci et al., 2005; Sullivan et al., 2006),
The efficiency of cosmic-ray acceleration by SNe remains poorly understood but is crucial for understanding cosmic-ray acceleration physics as well as SN energy feedback. Theories propose that cosmic rays are produced by diffusive shock acceleration in the blast waves from SN explosions (e.g., Schlickeiser, 1989; Berezhko & Ellison, 1999). Current studies suggest that of the initial kinetic energy from a SN needs to be transferred to cosmic-ray acceleration if we assume that SNe are the dominate sources for cosmic-ray production and the nucleosynthesis of lithium, beryllium, and boron in the Milky Way (Fields et al., 2001). Also, some theoretical predictions expect the cosmic-ray acceleration efficiency in quiescent galaxies is much lower than in star-forming galaxies. Dorfi & Voelk (1996) suggest that only of the total explosion energy goes into cosmic-ray energy in quiescent galaxies. This is because a SN blast will have weaker shocks due to the large sound speeds of the hot, low-density ISM in an elliptical galaxy.
Understanding the SN rate and their efficiency in producing cosmic rays is critical for studying the EGB contributions from these galaxies. Our observational understanding of cosmic SNe will increase significantly when the next generation optical survey telescope, the Large Synoptic Survey Telescope (LSST), comes online during the next decade. LSST is planning to scan the whole available sky, repeated every days, with unprecedented survey sensitivity (Ivezic et al., 2008). The project will observe CC SNe per year out to redshift (Lien & Fields, 2009) and Type Ia events out to redshift (Bailey et al., 2009). The cosmic SN rate in different galaxy classes can thus be measured via direct counting to high redshift with extremely low statistical uncertainty.
In this paper, we will first describe the general formalism of estimating the EGB from cosmic rays accelerated by SNe in both star-forming and quiescent galaxies (§ 2). We will then discuss the cosmic Type Ia rate in each galaxy classification that will be used in our EGB analysis (§ 3). The estimations of the EGB contribution from Type Ia SNe in star-forming and quiescent galaxies are presented in § 4 and § 5, respectively. Additionally, we discuss the uncertainties in the EGB predictions in § 6. Finally, we summarize the results in § 7.
2 General Formalism
The formalism we adopt generalizes that of Fields et al. (2010) to account for both SN types. Integration of the gamma-ray contributions from each unresolved extragalactic source over the line of sight to the cosmic horizon gives the well-known express for the EGB intensity,
| (1) |
where is the comoving luminosity density (or emissivity) at rest-frame energy , and for the standard CDM cosmology. We use , , and from the seven-year Wilkinson Microwave Anisotropy Probe (WMAP) data (Komatsu et al., 2011).
Because the pionic gamma-ray emission is produced from the interaction between cosmic rays and the hydrogen atoms in the ISM of each galaxy, the luminosity density is given by the product
| (2) |
of the pionic gamma-ray luminosity of an individual galaxy, times the galaxy number density, appropriately averaged. Our problem then divides into two parts. First, we must express a galaxy’s gamma-ray luminosity in terms of galaxy properties such as SN rate and gas content, and relate these to galaxy observables. Then we must construct a luminosity function for gamma-ray-emitting galaxies.
We first turn to the pionic gamma-ray luminosity from an individual galaxy. This can be written as
| (3) | ||||
| (4) |
where represents a spatial average of the gamma-ray production rate per interstellar hydrogen atom. The total number of hydrogen atoms in a galaxy is obtained by integrating the number density of hydrogen atom over the ISM volume. is proportional to the total gas mass in a galaxy and can therefore be expressed as , where is the mass fraction of hydrogen atoms and is the proton mass.
We take SNe (of both types) to be the engines of cosmic-ray acceleration; this implies that the cosmic-ray flux scales as . Here is an effective SN rate weighted by the cosmic-ray acceleration efficiency , discussed below. is the escape path length, which quantifies the cosmic-ray confinement in a galaxy. In this paper we assume to be universal and constant, which leads to a universal galactic cosmic-ray spectrum that is the same as that of the Milky Way. Thus the pionic gamma-ray production rate per hydrogen atom in a galaxy should scale as . We normalize the cosmic-ray spectrum to a known galaxy, which would be the Milky Way in our case, finding
| (5) |
The pionic gamma-ray luminosity of a particular galaxy is thus
| (6) |
Because of their short lifespans, the rate of CC SNe (and short-delay Ia events) traces that of star formation: . Thus we expect a star-forming galaxy’s gamma-ray luminosity to scale as . The new class of Fermi-detected star-forming galaxies is consistent with this trend (Lenain & Walter, 2011).
This pionic gamma-ray spectrum always has a peak at , at which the two gamma-ray photons inherit the rest-mass energy of the decayed (Stecker, 1971). At large energy, the spectrum shows the same asymptotic index as that of the cosmic-ray spectrum, which we take to be 2.75.
Both CC and Type Ia events should produce cosmic rays and hence pionic gamma rays. Therefore, the effective SN rate in Eq. (6) is a combination of the effective Type Ia rate and the effective CC SN rate , where and are the cosmic-ray production efficiencies of Type Ia and CC SNe, respectively. There exist different definitions of the cosmic-ray acceleration efficiency in current literature. For example, some studies present the efficiency as the fraction of the total cosmic-ray production energy out of the total kinetic energy output from a SN (e.g., Dorfi & Voelk, 1996; Fields et al., 2001; Helder et al., 2010), while other studies define the parameter as the percentage of the energy flux that becomes relativistic particles after crossing the shock (e.g., Ellison et al., 2007). Most of these definitions describe the fraction of the SN explosion energy transferred to cosmic rays. Here, we define the cosmic-ray acceleration efficiency to be the ratio of the SN baryonic explosion energy to the resulting cosmic-ray energy , i.e., . Therefore, if we assume that all SNe have the same explosion energy and the produced cosmic rays have the same energy spectrum, the cosmic-ray acceleration efficiency will be proportional to the total cosmic-ray production in a galaxy over the SN rate in that galaxy, i.e., . For the Milky Way, then, we have .
Since we normalized our prediction to the gamma-ray production in the Milky Way (Eq. 6), the important factor in the calculation is not the absolute value of , but the difference between the acceleration efficiency in different SN types (Ia and CC) and galaxy classes (quiescent and star-forming). Specifically, we will need to specify the ratios and . Unfortunately, these two fractions are poorly known. Thus for our fiducial numerical results, we will take and . Furthermore, we are unaware of any evidence for a substantial difference between the cosmic-ray acceleration efficiencies between Ia and CC SNe, and thus we will hereafter drop the Ia and CC notation in the acceleration efficiency to simplify the discussion. However, we will retain the notations of the acceleration efficiencies for different galaxy type and in our formalism as an explicit reminder that the efficiencies are likely to depend on galaxy environment, as expected by some theoretical analyses (Dorfi & Voelk, 1996; Hein & Spanier, 2008). Further possibilities of choosing different cosmic-ray acceleration efficiencies will be discussed in § 6.2.
Star-forming galaxies contain both Type Ia and CC SNe. Their pionic gamma-ray luminosity density can be calculated by averaging over the galaxy density ,
| (7) |
In quiescent galaxies, there are almost no star formation. We will assume the star-formation rate (and thus the CC SN rate) to be zero in a quiescent galaxy. However, Type Ia SNe do exist in quiescent galaxies because these events occur some time after the star formation. Therefore the pionic gamma-ray luminosity density in quiescent galaxies only comes from Type Ia events,
| (8) |
and are the gamma-ray production rate and Type Ia event rate in a standard quiescent galaxy Q0 for normalization. However, since no gamma-ray emission from a (jet-less) quiescent galaxy has ever been measured, we will still adopt the values of the Milky Way and estimate the gamma-ray luminosity density for quiescent galaxies as
| (9) |
Note that since the gamma-ray production from the Milky Way comes from both Type Ia and CC SNe, needs to be normalized to the total SN rate in the Milky Way instead of just the Type Ia rate.
The total pionic gamma-ray luminosity density will be a combination of emissions from both star-forming and quiescent galaxies, that is, . The EGB contribution from cosmic rays accelerated by CC SNe has been carefully examined in Fields et al. (2010) and by other groups (e.g., Stecker & Venters, 2011; Makiya et al., 2011). Here we will focus on the EGB contributions related to Type Ia events. In our calculation, we do not include the intergalactic EGB absorption GeV (Salamon & Stecker, 1998).
3 The Cosmic Type Ia Supernova Rate in Star-forming and Quiescent Galaxies
Type Ia SNe do not all trace ongoing star formation, because these events have different origins from CC SNe. The prevailing scenarios for Type Ia SN origin include merging of two white dwarfs (double degenerate, Webbink, 1984), or a white dwarf accreting from mass-overflow of its supergiant companion (single degenerate, Nomoto et al., 1984; Iben & Tutukov, 1984). Both of these scenarios involve white dwarfs merging in a binary system, and thus Type Ia SNe are delayed from the formation of the progenitor stars. For this reason, Type Ia SNe are found in all galaxies, including the quiescent galaxies where there is no longer star-forming activity. A complete account of the Type Ia SN contribution to the EGB must therefore include contributions from events in star-forming and quiescent galaxies.
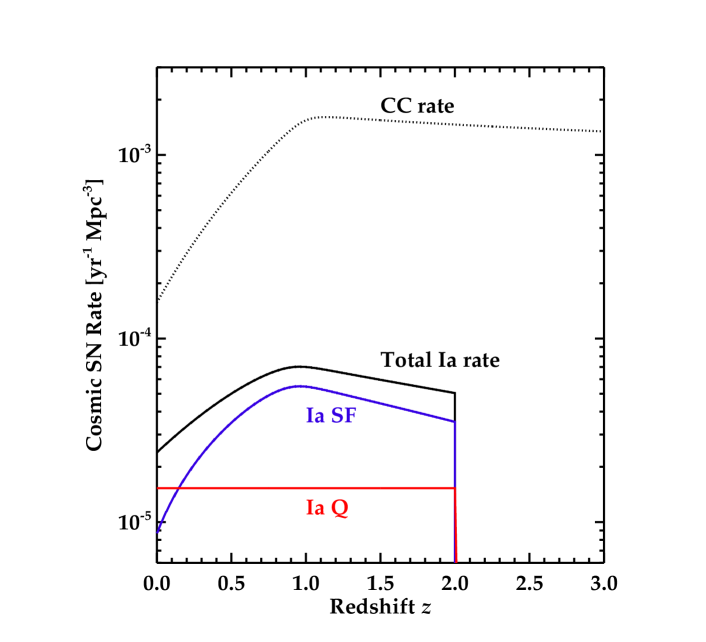
There are many studies of the comoving cosmic Ia rate density as a function of redshift, most of which focus on the distribution of delay times (e.g., Scannapieco & Bildsten, 2005; Sullivan et al., 2006; Kuznetsova et al., 2008; Dilday et al., 2010b; Horiuchi & Beacom, 2010; Graur et al., 2011). Our adopted total (all-galaxy) cosmic Type Ia rate is based on current observational data. To find this we use the best-fit redshift and delay-time distribution of Horiuchi & Beacom (2010), integrated over all delay times (black curve in Fig. 1). Although the number of observed cosmic Ia events is rapidly increasing, the data remain sparse beyond , where the rates are thus poorly constrained.
The cosmic Ia rate in different galaxy classes (i.e., star-forming and quiescent galaxies) as a function of redshift is still poorly understood. In our calculation, we adopt a constant value for the cosmic Ia rate in quiescent galaxies out to redshift (red curve in Fig. 1). We use a normalization based on observations of Ia rate per stellar mass in quiescent galaxies provided by Sullivan et al. (2006) and a non-evolving stellar-mass function from Pannella et al. (2009) (see detailed discussion in § 5). Recently, Type Ia SNe have been observed in galaxy clusters. The observed Ia rates show little redshift evolution within (Gal-Yam et al., 2002; Sharon et al., 2007; Graham et al., 2008; Mannucci et al., 2008; Dilday et al., 2010a; Sharon et al., 2010). Since galaxy clusters are mostly composed of quiescent galaxies, these results are consistent with our assumption of a constant Ia rate in quiescent galaxies. Moreover, these measurements show that Ia rate in clusters is , which is very similar to the value we adopted from Sullivan et al. (2006) 111We are greatly thankful for the anonymous referee for pointing out the measurements of Ia rate in galaxy clusters.. However, while we expect a roughly constant cosmic Ia rate in quiescent galaxies for moderate redshift, this trend must fail at some redshift. To be conservative, we therefore placed an artificial cutoff of the cosmic Type Ia rate at , beyond which uncertainties in the cosmic Type Ia rate observations remain substantial.
The cosmic Ia rate in star-forming galaxies (blue curve in Fig. 1) can thus be obtained by subtracting the cosmic Type Ia rate in quiescent galaxies (red curve in Fig. 1) from the total cosmic Ia rate (black curve in Fig. 1).
Figure 1 shows the adopted cosmic Ia SN rate as a function of redshift. Although the uncertainty in the rate increases significantly at higher redshift, most of the EGB from Type Ia SNe, like that from CC SNe, arises from events at lower redshift () (Ando & Pavlidou, 2009). For example, in our calculation () of the EGB flux comes from sources within (). Therefore the choice of the Type Ia rate at only has a small effect on the final estimation of the EGB. The solid black curve plots the total cosmic Ia SN rate in both star-forming and quiescent galaxies. The red curve shows the cosmic Ia SN rate in only quiescent galaxies. The blue curve represents the cosmic Ia SN rate in only star-forming galaxies.
Figure 1 also shows the cosmic CC SN rate (dotted black curve), which is higher than the Ia rate by a factor at and increase to a factor of at . This immediately suggests that we should expect CC events to dominate the star-forming EGB signal, with the Ia contribution at a level. We will see that this is roughly the case for the Ia contribution from star-forming galaxies, but for Ia events in quiescent galaxies the situation is much more uncertain.
4 The Extragalactic Gamma-ray Background from Type Ia Supernovae in Star-forming Galaxies
As described in § 2, the EGB luminosity density is dominated by two physics inputs: the SN rate in a galaxy, which is associated with the amount of cosmic rays, and the total gas mass of that galaxy, which accounts for the total hydrogen targets that interact with the cosmic rays. To reflect these two physics inputs, we follow the approach adopted in Fields et al. (2010) and rewrite the EGB contribution from Type Ia events (the first term in Eq. 7) as below,
| (10) |
where
| (11) | ||||
| (12) |
and is the cosmic Type Ia rate in star-forming galaxies, as shown in Fig. 1. In a star-forming galaxy, the galaxy gas mass and the galaxy Type Ia rate can be related to the star-formation rate in that galaxy, which can be connected to the observable luminosity of the galaxy by (Hopkins, 2004). Therefore we express the gas mass and the Type Ia rate in terms of . The corresponding galaxy luminosity function at this wavelength can be expressed by the Schechter function (Nakamura et al., 2004).
At a specific redshift, the gas mass in star-forming galaxies and the star-formation rate can be connected by
| (13) |
with and , as shown in Fields et al. (2010). The Type Ia rate in a galaxy can be linked to the star-formation rate via some delay-time distribution ,
| (14) |
where is the corresponding cosmic age at redshift . The delay-time distribution gives the probability that a Type Ia SN explodes a time after the progenitor’s birth. More detailed discussion about the delay-time distribution can be found in Appendix A. The galaxy luminosity function at a certain redshift for star-forming galaxies in the band can be presented in the form of a Schechter function of
| (15) |
with (Nakamura et al., 2004).
Because Type Ia SNe are delayed relative to star formation, the Type Ia rate in a galaxy depends on the star formation history of the galaxy via eq. (14). Unfortunately, this past star formation rate is not easily determined for distant galaxies even when the H luminosity is available to give the instantaneous star formation rate. However, we can investigate the evolution in two simplified cases: pure luminosity evolution and pure density evolution. Pure luminosity evolution assumes that galaxy luminosities evolve with redshift, while galaxy density stays unchanged, i.e., in Eq. (15) has redshift dependence and does not. Pure density evolution assumes that galaxy density evolves with redshift, while galaxy luminosity remains constant, i.e., in Eq. (15) depends on redshift and does not. The real situation should be bracketed by these possibilities.
In either limit, we can take advantage of the fact that the well-measured cosmic star formation rate is . This fixes the redshift behavior of the product , so that in the limit where one factor is constant, the other must have the redshift dependence of the cosmic star formation rate.
4.1 Pure Luminosity Evolution
In the case of pure luminosity evolution, there is no evolution of the galaxy density. Thus in the Schechter function of eq. (15), , and thus all redshift dependence lies in . Therefore, evolution of the star-formation rate in each galaxy, and hence the evolution of the galaxy luminosity , must trace the general evolution of the cosmic star-formation rate . Under this assumption, we can show that is independent of the choice of the delay-time function (see derivation in Appendix A). When adopting the Schechter function for , one will find that , with a local value of (see Appendix A).
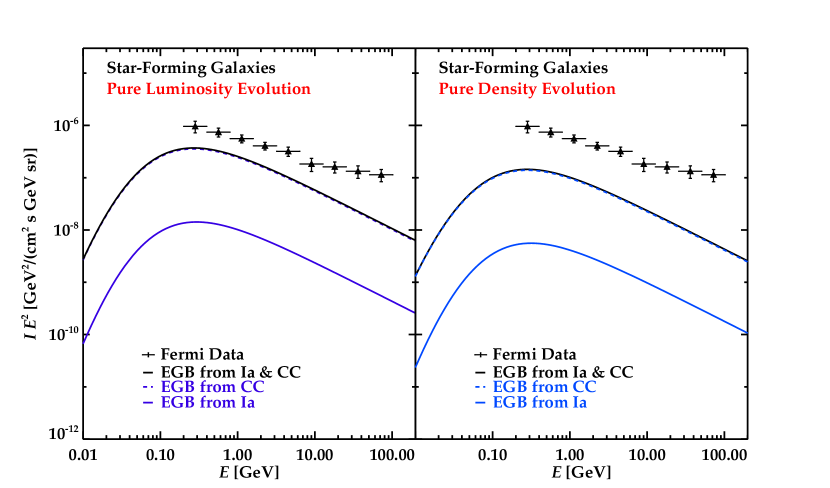
The predicted EGB from Type Ia SNe in star-forming galaxies is plotted as the solid blue line in the left panel of Fig. 2. For comparison, the dashed blue line shows the EGB contribution from CC SNe in star-forming galaxies. The shapes of the dashed blue lines trace the results in Fields et al. (2010). However, the normalization of the CC SN curves is lower by the fraction of the CC SN rate over the total SN rate ( from Bazin et al., 2009), which is due to the fact that Fields et al. (2010) have implicitly assumed that CC SNe produce all of the gamma-ray emission in galaxies.
Figure 2 shows that the EGB from Type Ia SNe is around an order of magnitude lower than those from CC SNe, which is due to the lower Type Ia rate in star-forming galaxies. As noted above, this is easily understood as a reflection of the small Ia/CC ratio (Fig. 1). The black curve in Fig. 2 presents the total EGB emission from both Type Ia and CC SNe in star-forming galaxies. Note that the total EGB emission from star-forming galaxies turns out to be very similar to the prediction in Fields et al. (2010), in which the authors assumed that all of the EGB contribution comes from the CC events. The reason is that even though we added the EGB contribution from Type Ia SNe, we also lower the EGB emission from CC events estimated in Fields et al. (2010) by the corresponding CC SN fraction. Also, the Ia to CC fraction does not change much within , which is the redshift range where most of the EGB signals originate. Hence the EGB contribution from CC SNe is always higher than those from Ia SNe by a similar factor.
The shape of the EGB curves in Fig. 2 traces the general features of the pionic gamma-ray energy spectrum. This is because the observed EGB intensity at a specific energy originated from a combination of sources at different redshifts, as described in Eq. (1). Therefore, the redshift evolution of the unresolved sources is smeared out in the energy plot and mostly affects the normalization of the EGB intensity but not the spectral shape.
4.2 Pure Density Evolution
For pure density evolution, only the galaxy density evolves with redshift while the galaxy luminosity does not. Therefore, the star-formation rate in a galaxy also remains constant, and the evolution in the cosmic star-formation rate will purely depend on the growth of the galaxy density. Hence, in the case of pure density evolution, . With similar calculations as those in the case of pure luminosity evolution (Appendix A), one can find that is also independent of the choice of the delay-time function. Additionally, in the case of pure density evolution.
Results for the case of pure density evolution are shown in the right panel of Fig. 2. Again, the solid blue line and the dashed blue line represent the EGB from Type Ia and CC, respectively. The black line shows the combined gamma-ray contribution from both Type Ia and CC events. Similar to the results of pure luminosity evolution, the EGB from Type Ia SNe is lower than that from CC events because of the lower Type Ia rate. Moreover, the predicted EGB emission is lower if we assume pure density evolution instead of pure luminosity evolution. As discussed in (Fields et al., 2010), this is because a typical galaxy’s gamma-ray luminosity ; in the pure luminosity evolution case, both factors are enhanced at early times, while in the pure density case this nonlinear boost is not present.
5 The Extragalactic Gamma-ray Background from Type Ia Supernovae in Quiescent Galaxies
Following a similar procedure to § 4, we will now discuss the EGB from cosmic rays accelerated by Type Ia SNe in quiescent galaxies. We again express the EGB luminosity density (Eq. 9) in the following form to describe the physics inputs from the average gas mass and the cosmic Ia rate in quiescent galaxies ,
| (16) |
where
| (17) | ||||
| (18) |
and . Unlike the star-forming galaxies, where both and can be related to the observable luminosity, it is easier to connect both and to the total stellar mass in a quiescent galaxy.
For the cosmic Type Ia rate in quiescent galaxies, we adopt the results of Sullivan et al. (2006), which link Type Ia rates to directly. These authors assume a bimodal delay-time distribution and decompose the Ia rate into two groups: the long-delay time and short-delay time. In their model, the short-delay time group simply traces the star-formation rate, while the long-delay time group has a constant probability for all delay times, i.e., . Therefore, the Type Ia rate in a galaxy can be written as
| (19) |
The star formation rate in a quiescent galaxy, thus , where is the total stellar mass created throughout the star formation history in the quiescent galaxy. Sullivan et al. (2006) estimated in quiescent galaxies based on measurements of the Type Ia rate in the Supernova Legacy Survey (SNLS).
According to the observational results in Pannella et al. (2009), the stellar-mass function of early-type galaxies evolves only slightly with redshift. Therefore we simply assume the same stellar-mass function throughout all redshift. Also, we find that the shown in Pannella et al. (2009) can be roughly fitted by the following function 222 This fitting function is based on observations given in Fig. 7 in Pannella et al. (2009), which contains measurements of stellar-mass functions at different redshift bins and environments. We choose the data set in the lowest redshift bin of in medium-dense environment (; see Pannella et al. (2009) for the definition of environmental density and more details) to perform a fitting. The reduced- of our fitting function is . ,
| (20) |
where , , and . Equation (20) (the stellar mass function for quiescent galaxies) and Eq. (19) (Type Ia rate in a quiescent galaxy) give the cosmic Ia rate in quiescent galaxies
Here the constant rate follows from the nearly redshift-independent quiescent stellar mass function.
Most of the gas content in quiescent galaxies appears to be in the form of diffuse hot gas and can be observed in the X-ray (e.g., Forman et al., 1985; Canizares et al., 1987; Bregman et al., 1992). However, large uncertainties exist in estimations of the mass of hot gas. Some studies suggest that most of the quiescent galaxies are gas-poor (e.g., David et al., 2006; Fukazawa et al., 2006), while other studies imply that there can be significant amount of gas in these galaxies (e.g, Jiang & Kochanek, 2007; Humphrey et al., 2011). Current theoretical models suggest that the gas could extend out to a few hundred kpc from the center. The total gas mass of a single galaxy can increase by orders of magnitude if one includes the gas at large radii (Humphrey & Buote, 2010; Humphrey et al., 2011) Therefore observational measures of gas mass can vary even for a single galaxy, depending on whether or not the observations enclose a large enough radius to include gas at large distances. If hot gas extends to large radii, this could serve as a reservoir of targets for cosmic rays accelerated by Type Ia SNe, provided the cosmic rays also reach large radii. This too is uncertain, and will depend on the cosmic-ray confinement versus escape properties of these galaxies.
Because of the large uncertainties in the gas content in quiescent galaxies, we illustrate a range of EGB predictions for these objects, based on three different gas amounts. Since quiescent galaxies are dominantly early-type, we will use estimates of the gas mass in early-type galaxies for the amount of gas in quiescent galaxies. The stellar-mass function in Pannella et al. (2009) (Eq. 20) gives the average stellar mass in early-type galaxies to be , which can be converted to the total gas mass by multiplying a gas-to-stellar mass ratio , i.e., . The three models we adopted for different gas amounts correspond to different gas-to-stellar mass ratios for early-type galaxies. Table 1 summarizes the gas-to-stellar mass ratios for the three models we adopted, as well as the corresponding . Gas Model 1 estimates the gas-to-stellar mass ratio based on the stellar-mass fraction of the total halo mass from Jiang & Kochanek (2007) 333 Jiang & Kochanek (2007) found that the average stellar-mass fraction of the total halo mass in early-type galaxies is or based on different assumptions of the halo mass dynamics. Both of these numbers are significantly lower than the cosmological baryon-to-mass ratio measured by WMAP (Spergel et al., 2007). If we assume that the baryon-to-mass ratio in a galaxy can be well represented by the cosmological ratio, i.e., , the result from Jiang & Kochanek (2007) implies a large amount of gas mass in early-type galaxies, which can be estimated by . The values of and correspond to and , respectively. Here we adopt the latter number to be more conservative in our estimation. . This model gives the highest gas-to-stellar mass ratio of all three models. Gas Model 2 and 3 are both adopted from David et al. (2006), in which the authors reported the gas-to-stellar mass ratio for more luminous (Gas Model 2) and less luminous (Gas Model 3) early-type galaxies. Note that both of the gas mass and the Ia rate in a quiescent galaxy are constant with redshift, as a result of assuming a non-evolving stellar-mass function, consistent with the early-type galaxy observations in Pannella et al. (2009).
| Gas Model | Reference | ||
|---|---|---|---|
| 1 | 2.14 | Jiang & Kochanek (2007) | |
| 2 | 0.01 | David et al. (2006) | |
| 3 | 0.001 | David et al. (2006) |
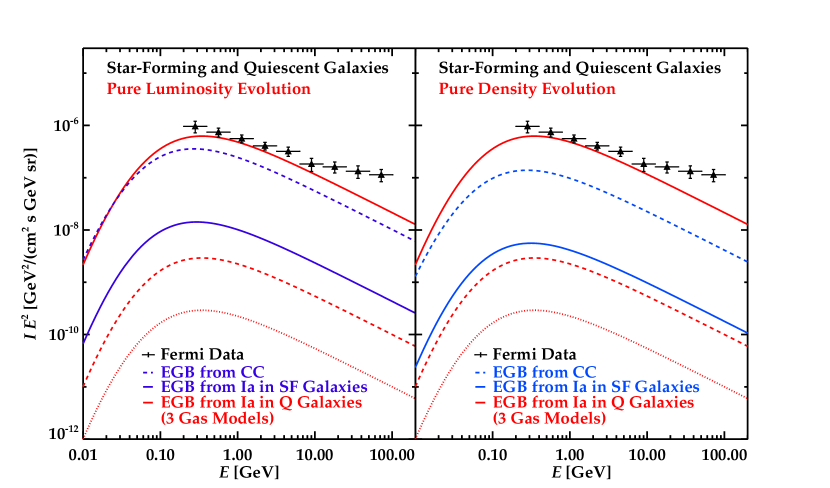
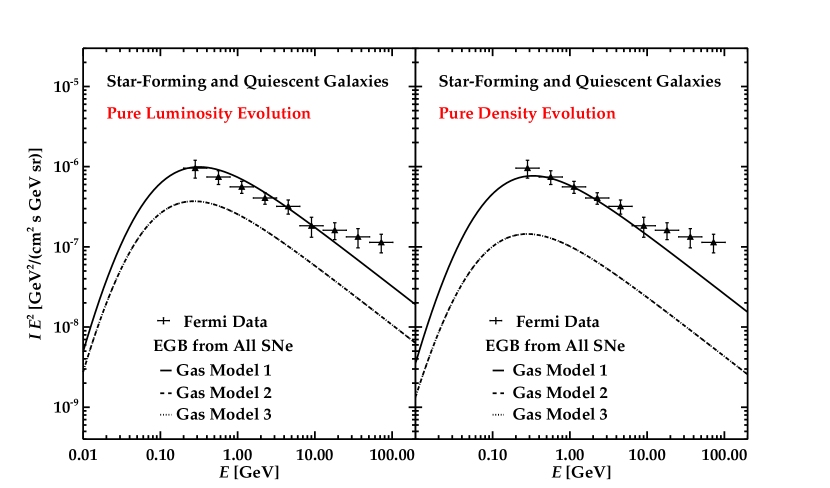
The red curves in Fig. 3 plot the EGB estimation from Type Ia SNe in quiescent galaxies, with different line styles correspond to estimations from different gas amounts (solid line: Gas Model 1, dashed line: Gas Model 2, dotted line: Gas Model 3). The EGB emissions from SNe in star-forming galaxies are plotted as blue curves for comparison. The black curves in Fig. 4 plot the total EGB emissions from SNe in both star-forming and quiescent galaxies for different gas models. For both Fig. 3 and 4, the left panel plots results under the assumption of pure luminosity evolution for the star-forming galaxies. The right panel shows the EGB predictions assuming pure density evolution for the quiescent galaxies.
The estimated EGBs shown in Fig. 3 are linearly proportional to the average galaxy gas mass and thus to the adopted gas-to-stellar mass ratio, as required by Eq. (16). Gas Model 1 predicts the highest contribution in EGB from quiescent galaxies, where the result is significantly higher than the EGB emission from Type Ia events in star-forming galaxies, while Gas Model 2 and Gas Model 3 suggest much lower EGB emission from quiescent galaxies. In our estimation, the two important factors that affect the overall EGB are the average gas mass and the cosmic SN rate. In general, the cosmic Type Ia rate is about a factor of smaller than the cosmic CC SN rate. Additionally, the cosmic Type Ia rate in all quiescent galaxies averaging over the entire redshift range is lower than that in star-forming galaxies by around a factor of three.
As for the gas mass in quiescent galaxies, Gas Model 1 assumes the gas amount to be about two orders of magnitude higher than that in star-forming galaxies, while Gas Model 2 and 3 assume gas amount to be similar or one order of magnitude lower than that in star-forming galaxies, respectively. Combining these two factors (gas mass and Type Ia rate), we would expect the EGB from quiescent galaxies to be about 30 times larger (for Gas Model 1), 3 times smaller (for Gas Model 2), or 30 times smaller (for Gas Model 3) than that from Type Ia in star-forming galaxies. Because of the EGB estimation is very sensitive to the gas amount, measurement of the EGB could put constraints on the gas mass in quiescent galaxies.
6 The Uncertainties in the Extragalactic Gamma-ray Background Analysis
6.1 Star-forming Galaxies
The gamma-ray emission from normal star-forming galaxies is the most constrained among the three galaxy classes that are considered possible SN-induced EGB sources (i.e., starburst galaxies, normal star-forming galaxies, and quiescent galaxies). The main uncertainties in the EGB prediction of star-forming galaxies come from four factors, as described in Fields et al. (2010): (1) uncertainty in the pionic gamma-ray production rate , which is (Abdo et al., 2009c), (2) uncertainty in the normalization of the Galactic SN rate , which is (Robitaille & Whitney, 2010), (3) uncertainty in the luminosity scaling in , which is (Fields et al., 2010), and (4) uncertainty in the normalization of the cosmic SN rate , which is resulting from the uncertainties in the cosmic CC SN rate (Horiuchi et al., 2009) and the cosmic Ia rate (Horiuchi & Beacom, 2010). The total uncertainty in the EGB prediction will then be .
The upcoming large synoptic surveys, such as the LSST, will provide novel information in both the cosmic SN rate and how they depend on the galaxy types out to high redshift. Within one year of observation, LSST is expected to detect SNe out to and thus achieve a statistical precision of less than a few percent in the cosmic SN rate (Lien & Fields, 2009; Bailey et al., 2009). Hence, LSST will essentially remove the uncertainty from the cosmic SN rate in the EGB analysis and make the EGB a better tool for studying cosmic rays and gamma-ray physics. Moreover, such a large SN population will provide excellent statistics for study of how SN rates evolve as a function of SN type (and sub-type), host galaxy type and star-formation rate, and cosmic environment. Thus it will be possible to directly measure the Type Ia rate in quiescent galaxies and its evolution with redshift.
6.2 Quiescent Galaxies: Hot Gas and Cosmic-Ray Propagation
For quiescent galaxies, many characteristics related to their gamma-ray emissions are poorly understood. The Type Ia SN rate in these systems could be uncertain up to a factor , particularly at . We have also seen that the gas mass in these systems is even more poorly known. Published estimates of the gas content in quiescent galaxies vary by orders of magnitude. Observations that use X-rays as tracers of hot gas found significantly less gas in quiescent galaxies (e.g., David et al., 2006; Fukazawa et al., 2006). However, several studies imply a much higher gas content in quiescent galaxies than previously thought, when using gravitational lensing and modeling that involved dark matter (e.g., Jiang & Kochanek, 2007; Capelo et al., 2010; Humphrey et al., 2011). It is difficult to determine what are the causes of the large discrepancy of gas quantity from different analyses, because these studies adopted different observational and modeling techniques with different galaxy sample. One possible reason for the large variation in gas content measurements might come from whether or not one includes gas at larger radii, which are predicted by some theoretical models (Capelo et al., 2010; Humphrey & Buote, 2010; Humphrey et al., 2011).
If gas content does extend to larger radii in quiescent galaxies, it is crucial to understand the cosmic-ray propagation in quiescent galaxies to determine the confinement volume of cosmic rays and how likely they can interact with gas at larger radii. Unfortunately, cosmic-ray propagation remains poorly understood. Until now, most of the studies have been focused on the Milky Way or spiral galaxies and not so much on quiescent galaxies. For spiral galaxies, both observations and theoretical modeling suggest that most of the cosmic rays are confined within kpc of the disk (Stecker & Jones, 1977; Strong et al., 2000, 2004). However, this might not be the case for quiescent galaxies. Hein & Spanier (2008) simulate cosmic-ray propagation in elliptical galaxies with the presence of diffusion, as well as adiabatic losses. They apply their formalism not to SN sources but rather to acceleration due to an M87-like relativistic jet; thus their detailed calculations are not applicable to our case. Nevertheless, their general finding is that cosmic rays expand into a larger volume in an elliptical galaxy than in a spiral galaxy, due to the larger minor axis in an elliptical galaxy. Additionally, they argue that adiabatic losses are much more important in elliptical galaxies and indeed dominate over escape losses. Hein & Spanier (2008) thus conclude that it is likely for elliptical galaxies to be extended gamma-ray sources.
There are two factors that are important for determining the probability of interactions between cosmic rays and gas, especially at large radii where the density of gas and cosmic rays are likely to be smaller: (1) the mean free time for pion production for each cosmic-ray particle , where is the cross section of pion production and is the number density of gas particles, and (2) time that a cosmic ray particle takes to propagate through the galaxy before escape. In the limit of cosmic rays travel through a (non-magnetized) galaxy radially, that is, without any diffusion, the escape time is very short and probability of interactions between cosmic rays and gas particles is small. On the other hand, in the presence of disordered magnetic fields extending to large radii, cosmic ray propagation will not be radial but diffusive instead, which will make the escape time much larger and increase the chance of cosmic-ray interactions with ISM.
Clearly there are fundamental uncertainties (and opportunities) in a realistic treatment of elliptical galaxy cosmic rays, but even in our simplistic picture the parameters and are not well-constrained. Although we treated these two quantities to be the same for both Type Ia and CC SNe in all environments due to limited knowledge, it is possible, and even likely, that these numbers are different in quiescent galaxies. In fact, Dorfi & Voelk (1996) have suggested that the efficiency in quiescent galaxies is at least 10 times lower than that in star-forming galaxies (Dorfi & Voelk, 1996), which could lower our prediction of the EGB from quiescent galaxies by a factor of 10 or even larger. Tang & Wang (2005) model the evolution of SN remnants in low-density hot media and reach similar conclusion that the SN heating in such an environment is subtle and cover a large region because of small Mach numbers. Likewise, a smaller escape path length, i.e., a weaker cosmic-ray confinement, can also decrease our EGB estimation in quiescent galaxies. Note that adopting different values of and would change the cosmic-ray spectrum, and hence also change the corresponding gamma-ray spectrum.
To summarize, current studies imply that cosmic-ray acceleration might be more difficult in quiescent galaxies than in star-forming galaxies due to weaker shocks in low-density and high-temperature environments (Dorfi & Voelk, 1996; Tang & Wang, 2005). However, quiescent galaxies might have larger confinement volume than spiral galaxies because they have larger semi-minor radii (Hein & Spanier, 2008). Further observational and theoretical study of the gas and cosmic-ray content of quiescent galaxies clearly are needed in order to pin down the gamma-ray production of these objects even to within an order of magnitude.
7 Conclusions
We have calculated the EGB contribution from Type Ia SNe in both star-forming and quiescent galaxies, extending the work of Fields et al. (2010). For star-forming galaxies, most of the gamma-ray emission comes from cosmic rays accelerated by CC SNe. This is mainly because there are about five times more CC SNe than Type Ia events in star-forming galaxies. We find that the net EGB contribution from both SN types is almost the same as the Fields et al. (2010) predictions that only included CC events. Our model allows for addition of cosmic Type Ia explosions, but also includes these in the cosmic-ray/star-formation ratio, which we normalize to the Milky Way values. Both factors change by nearly the same amount, so that the addition of Type Ia events causes almost no net change in the EGB prediction.
We also point out that Type Ia events in quiescent galaxies make a unique contribution to the EGB, because these systems lack CC events. We show that the EGB from Type Ia events in quiescent galaxies is highly sensitive to the gas amount in quiescent galaxies, which is still poorly known. Based on different gas models adopted, the EGB from Type Ia SNe in quiescent galaxies can vary from two orders of magnitudes higher to an order of magnitude lower than those produced by Type Ia SNe in star-forming galaxies. Therefore quiescent galaxies can be dominant source of the EGB if there exist a large amount of gas, as suggested by Jiang & Kochanek (2007) and Humphrey et al. (2011). The measurement of the EGB will provide useful constraint on the gas amount in quiescent galaxies. Additional uncertainties in the cosmic-ray acceleration efficiency and confinement could also change the EGB emission in these systems by a few orders of magnitude. Hence the EGB can also provide limits on the these two quantities in quiescent galaxies.
It is thus important to understand the characteristics of cosmic SNe of all types, in order to correctly predict their contribution to the EGB. We conclude that the large SN sample provided by LSST will offer critical information about the cosmic SN rate for both CC and Ia events, and their dependence on galaxy types out to high redshift.
The Fermi detection of the EGB contains crucial information about the extragalactic gamma-ray source spectrum. Particularly, it can provide an important probe to the gas amount, the cosmic-ray acceleration efficiency and the cosmic-ray confinement in quiescent galaxies. With our knowledge about SNe increasing rapidly as future synoptic surveys come online, the EGB contribution from SNe in galaxies can possibly be disentangled from other source candidates.
Acknowledgments We are thankful for the helpful comments and suggestions from Floyd Stecker that greatly improved this paper. We also appreciate the helpful discussions with Tonia Venters, Don Ellison, Robert Brunner, Tijana Prodanovic, Vasiliki Pavlidou, Ann Hornschemeier, Bret Lehmer, and Theresa Brandt. Additionally, we are grateful for the thoughtful comments from the anonymous referee. This work was partially supported by NASA via the Astrophysics Theory Program through award NNX10AC86G.
Appendix A The Delay-Time Distribution of Type Ia Supernovae and Detailed Calculation of in Equation 10
The delay time of each Type Ia SN can differ from Gyr to Gyr (Mannucci et al., 2005; Scannapieco & Bildsten, 2005; Gal-Yam & Maoz, 2004; Mannucci et al., 2006; Sullivan et al., 2006; Maoz et al., 2011). Observationally, the delay times of Type Ia SNe are usually studied via comparison between measurements of the cosmic Type Ia SN rate and the cosmic star-formation rate, and are usually described by some functions of delay-time distribution, which describes the probability of a Type Ia event with a specific delay time. Current proposed delay-time distributions have included a single power law (e.g., Horiuchi & Beacom, 2010; Graur et al., 2011), a Gaussian (e.g., Strolger et al., 2004; Dahlen et al., 2008), and a bimodal distribution (e.g., Sullivan et al., 2006). The difficulty in determining the delay-time distribution mainly comes from the uncertainty in the cosmic Ia SN rate measurements. Fortunately, the value is independent of the choice of delay-time distribution, as we show in the following derivation.
Based on the relation between the gas mass and the star-formation rate (Eq. 13), and also the connection between and , i.e., , the for a galaxy at redshift can be directly linked to the observable luminosity by . Additionally, the Type Ia rate can also be related to by
| (A1) |
where , which is the luminosity measured at some earlier time or larger redshift . Therefore can be expressed in terms of ,
| (A2) |
This equation expresses only the redshift-dependent terms and we will further calculate how evolves with redshift in the case of pure luminosity evolution and pure density evolution, respectively, in A.1 and A.2. Fields et al. (2010) shows that the local value of .
A.1 Pure Luminosity Evolution
In the case of pure luminosity evolution, the star-formation rate in each galaxy traces the general evolution of the cosmic star-formation rate, i.e., . Therefore from the directly proportional relation between the star-formation rate in a galaxy and the galaxy luminosity , one can trace the evolution of the luminosity via the history of cosmic star-formation rate, which is well-known out to redshift (e.g., Hopkins, 2004; Hopkins & Beacom, 2006, and references therein). That is, . Therefore the galaxy luminosity at different redshifts can be found by
| (A3) |
With this relation, in Eq. (A2) can be simplified to
| (A4) | ||||
| (A5) | ||||
| (A6) |
Therefore is independent of the choice of delay-time distribution.
The assumption of pure luminosity evolution implies that in the Schechter function remains constant and in the Schechter function evolves as (Eq. A3). Hence the redshift dependence of can be further calculated using the Schechter function,
| (A7) | ||||
| (A8) | ||||
| (A9) |
where is the maximum luminosity for star-forming galaxies, which corresponds to the maximum star formation defined in Fields et al. (2010). Galaxies with luminosities greater than are considered starburst galaxies and are not included in this calculation. Additionally, we adopt the cosmic star-formation rate described in Horiuchi et al. (2009) based on current observations. Note that because the factors related to delay-time distribution canceled out, this result turns out to be the same as the one obtained in Fields et al. (2010).
A.2 Pure Density Evolution
In the case of pure density evolution as discussed in § 4.2. Thus in the Schechter function, remains constant while evolves as . With similar calculations shown in the case of pure luminosity evolution (A.1) and adopting the Schechter function for , we can derive the redshift evolution of in the case of pure density evolution:
| (A10) | ||||
| (A11) | ||||
| (A12) | ||||
| (A13) |
Again, because is independent of the choice of delay-time distribution, the result is identical to the one calculated in Fields et al. (2010).
References
- Abdo et al. (2009a) Abdo, A. A., et al. 2009a, Physical Review Letters, 103, 251101
- Abdo et al. (2009b) —. 2009b, ApJ, 706, L1
- Abdo et al. (2009c) —. 2009c, ApJ, 703, 1249
- Abdo et al. (2010) —. 2010, ApJ, 710, L92
- Acciari et al. (2010) Acciari, V. A., et al. 2010, ApJ, 714, 163
- Acciari et al. (2011) —. 2011, ApJ, 730, L20+
- Acero et al. (2010) Acero, F., et al. 2010, A&A, 516, A62+
- Ando & Pavlidou (2009) Ando, S., & Pavlidou, V. 2009, MNRAS, 400, 2122
- Baade & Zwicky (1934) Baade, W., & Zwicky, F. 1934, Proceedings of the National Academy of Science, 20, 259
- Bailey et al. (2009) Bailey, S., Bernstein, J. P., Cinabro, D., Kessler, R., & Kuhlma, S. 2009, ArXiv e-prints: 0912.0201
- Bazin et al. (2009) Bazin, G., et al. 2009, A&A, 499, 653
- Berezhko & Ellison (1999) Berezhko, E. G., & Ellison, D. C. 1999, ApJ, 526, 385
- Bregman et al. (1992) Bregman, J. N., Hogg, D. E., & Roberts, M. S. 1992, ApJ, 387, 484
- Canizares et al. (1987) Canizares, C. R., Fabbiano, G., & Trinchieri, G. 1987, ApJ, 312, 503
- Capelo et al. (2010) Capelo, P. R., Natarajan, P., & Coppi, P. S. 2010, MNRAS, 407, 1148
- Dahlen et al. (2008) Dahlen, T., Strolger, L.-G., & Riess, A. G. 2008, ApJ, 681, 462
- Dar & Shaviv (1995) Dar, A., & Shaviv, N. J. 1995, Physical Review Letters, 75, 3052
- David et al. (2006) David, L. P., Jones, C., Forman, W., Vargas, I. M., & Nulsen, P. 2006, ApJ, 653, 207
- Dermer (2007a) Dermer, C. D. 2007a, ApJ, 659, 958
- Dermer (2007b) Dermer, C. D. 2007b, in American Institute of Physics Conference Series, Vol. 921, The First GLAST Symposium, ed. S. Ritz, P. Michelson, & C. A. Meegan, 122–126
- Dilday et al. (2010a) Dilday, B., et al. 2010a, ApJ, 715, 1021
- Dilday et al. (2010b) —. 2010b, ApJ, 713, 1026
- Dorfi & Voelk (1996) Dorfi, E. A., & Voelk, H. J. 1996, A&A, 307, 715
- Ellison et al. (1997) Ellison, D. C., Drury, L. O., & Meyer, J.-P. 1997, ApJ, 487, 197
- Ellison et al. (2007) Ellison, D. C., Patnaude, D. J., Slane, P., Blasi, P., & Gabici, S. 2007, ApJ, 661, 879
- Ellison et al. (2012) Ellison, D. C., Slane, P., Patnaude, D. J., & Bykov, A. M. 2012, ApJ, 744, 39
- Fichtel et al. (1977) Fichtel, C. E., Hartman, R. C., Kniffen, D. A., Thompson, D. J., Ogelman, H. B., Ozel, M. E., & Tumer, T. 1977, ApJ, 217, L9
- Fichtel et al. (1978) Fichtel, C. E., Simpson, G. A., & Thompson, D. J. 1978, ApJ, 222, 833
- Fields et al. (2001) Fields, B. D., Olive, K. A., Cassé, M., & Vangioni-Flam, E. 2001, A&A, 370, 623
- Fields et al. (2010) Fields, B. D., Pavlidou, V., & Prodanović, T. 2010, ApJ, 722, L199
- Filippenko (2001) Filippenko, A. V. 2001, in American Institute of Physics Conference Series, Vol. 565, Young Supernova Remnants, ed. S. S. Holt & U. Hwang, 40–58
- Forman et al. (1985) Forman, W., Jones, C., & Tucker, W. 1985, ApJ, 293, 102
- Fukazawa et al. (2006) Fukazawa, Y., Botoya-Nonesa, J. G., Pu, J., Ohto, A., & Kawano, N. 2006, ApJ, 636, 698
- Gal-Yam & Maoz (2004) Gal-Yam, A., & Maoz, D. 2004, MNRAS, 347, 942
- Gal-Yam et al. (2002) Gal-Yam, A., Maoz, D., & Sharon, K. 2002, MNRAS, 332, 37
- Ginzburg & Syrovatskii (1964) Ginzburg, V. L., & Syrovatskii, S. I. 1964, The Origin of Cosmic Rays (New York: Macmillan)
- Gnedin & Ostriker (1992) Gnedin, N. I., & Ostriker, J. P. 1992, ApJ, 400, 1
- Graham et al. (2008) Graham, M. L., et al. 2008, AJ, 135, 1343
- Graur et al. (2011) Graur, O., et al. 2011, MNRAS, 417, 916
- Hein & Spanier (2008) Hein, T., & Spanier, F. 2008, A&A, 481, 1
- Helder et al. (2010) Helder, E. A., Kosenko, D., & Vink, J. 2010, ApJ, 719, L140
- Hopkins (2004) Hopkins, A. M. 2004, ApJ, 615, 209
- Hopkins & Beacom (2006) Hopkins, A. M., & Beacom, J. F. 2006, ApJ, 651, 142
- Horiuchi & Beacom (2010) Horiuchi, S., & Beacom, J. F. 2010, ApJ, 723, 329
- Horiuchi et al. (2009) Horiuchi, S., Beacom, J. F., & Dwek, E. 2009, Phys. Rev. D, 79, 083013
- Humphrey & Buote (2010) Humphrey, P. J., & Buote, D. A. 2010, MNRAS, 403, 2143
- Humphrey et al. (2011) Humphrey, P. J., Buote, D. A., Canizares, C. R., Fabian, A. C., & Miller, J. M. 2011, ApJ, 729, 53
- Hunter et al. (1997) Hunter, S. D., et al. 1997, ApJ, 481, 205
- Iben & Tutukov (1984) Iben, Jr., I., & Tutukov, A. V. 1984, ApJS, 54, 335
- Inoue & Totani (2009) Inoue, Y., & Totani, T. 2009, ApJ, 702, 523
- Ivezic et al. (2008) Ivezic, Z., et al. 2008, ArXiv e-prints: 0805.2366
- Jiang & Kochanek (2007) Jiang, G., & Kochanek, C. S. 2007, ApJ, 671, 1568
- Komatsu et al. (2011) Komatsu, E., et al. 2011, ApJS, 192, 18
- Kuznetsova et al. (2008) Kuznetsova, N., et al. 2008, ApJ, 673, 981
- Lacki et al. (2011) Lacki, B. C., Thompson, T. A., Quataert, E., Loeb, A., & Waxman, E. 2011, ApJ, 734, 107
- Lenain & Walter (2011) Lenain, J.-P., & Walter, R. 2011, A&A, 535, A19
- Lien & Fields (2009) Lien, A., & Fields, B. D. 2009, J. Cosmology Astropart. Phys, 1, 47
- Makiya et al. (2011) Makiya, R., Totani, T., & Kobayashi, M. A. R. 2011, ApJ, 728, 158
- Mannucci et al. (2006) Mannucci, F., Della Valle, M., & Panagia, N. 2006, MNRAS, 370, 773
- Mannucci et al. (2005) Mannucci, F., Della Valle, M., Panagia, N., Cappellaro, E., Cresci, G., Maiolino, R., Petrosian, A., & Turatto, M. 2005, A&A, 433, 807
- Mannucci et al. (2008) Mannucci, F., Maoz, D., Sharon, K., Botticella, M. T., Della Valle, M., Gal-Yam, A., & Panagia, N. 2008, MNRAS, 383, 1121
- Maoz et al. (2011) Maoz, D., Mannucci, F., Li, W., Filippenko, A. V., Valle, M. D., & Panagia, N. 2011, MNRAS, 412, 1508
- Mukherjee & Chiang (1999) Mukherjee, R., & Chiang, J. 1999, Astroparticle Physics, 11, 213
- Nakamura et al. (2004) Nakamura, O., Fukugita, M., Brinkmann, J., & Schneider, D. P. 2004, AJ, 127, 2511
- Nomoto et al. (1984) Nomoto, K., Thielemann, F.-K., & Yokoi, K. 1984, ApJ, 286, 644
- Padovani et al. (1993) Padovani, P., Ghisellini, G., Fabian, A. C., & Celotti, A. 1993, MNRAS, 260, L21
- Page & Hawking (1976) Page, D. N., & Hawking, S. W. 1976, ApJ, 206, 1
- Pannella et al. (2009) Pannella, M., et al. 2009, ApJ, 701, 787
- Pavlidou & Fields (2001) Pavlidou, V., & Fields, B. D. 2001, ApJ, 558, 63
- Pavlidou & Fields (2002) —. 2002, ApJ, 575, L5
- Pavlidou & Venters (2008) Pavlidou, V., & Venters, T. M. 2008, ApJ, 673, 114
- Prodanović & Fields (2006) Prodanović, T., & Fields, B. D. 2006, ApJ, 645, L125
- Reynolds & Ellison (1992) Reynolds, S. P., & Ellison, D. C. 1992, ApJ, 399, L75
- Robitaille & Whitney (2010) Robitaille, T. P., & Whitney, B. A. 2010, ApJ, 710, L11
- Rudaz & Stecker (1991) Rudaz, S., & Stecker, F. W. 1991, ApJ, 368, 406
- Salamon & Stecker (1998) Salamon, M. H., & Stecker, F. W. 1998, ApJ, 493, 547
- Scannapieco & Bildsten (2005) Scannapieco, E., & Bildsten, L. 2005, ApJ, 629, L85
- Schlickeiser (1989) Schlickeiser, R. 1989, ApJ, 336, 243
- Sharon et al. (2007) Sharon, K., Gal-Yam, A., Maoz, D., Filippenko, A. V., & Guhathakurta, P. 2007, ApJ, 660, 1165
- Sharon et al. (2010) Sharon, K., et al. 2010, ApJ, 718, 876
- Silk & Srednicki (1984) Silk, J., & Srednicki, M. 1984, Physical Review Letters, 53, 624
- Spergel et al. (2007) Spergel, D. N., et al. 2007, ApJS, 170, 377
- Sreekumar et al. (1998) Sreekumar, P., et al. 1998, ApJ, 494, 523
- Stecker (1971) Stecker, F. W. 1971, NASA Special Publication, 249
- Stecker (2007) —. 2007, Journal of Physics Conference Series, 60, 215
- Stecker & Jones (1977) Stecker, F. W., & Jones, F. C. 1977, ApJ, 217, 843
- Stecker et al. (1971) Stecker, F. W., Morgan, D. L., & Bredekamp, J. 1971, Phys. Rev. Lett., 27, 1469
- Stecker et al. (1993) Stecker, F. W., Salamon, M. H., & Malkan, M. A. 1993, ApJ, 410, L71
- Stecker & Venters (2011) Stecker, F. W., & Venters, T. M. 2011, ApJ, 736, 40
- Strolger et al. (2004) Strolger, L.-G., et al. 2004, ApJ, 613, 200
- Strong et al. (2000) Strong, A. W., Moskalenko, I. V., & Reimer, O. 2000, ApJ, 537, 763
- Strong et al. (2004) —. 2004, ApJ, 613, 962
- Sullivan et al. (2006) Sullivan, M., et al. 2006, ApJ, 648, 868
- Tanaka et al. (2011) Tanaka, T., et al. 2011, ApJ, 740, L51
- Tang & Wang (2005) Tang, S., & Wang, Q. D. 2005, ApJ, 628, 205
- Thompson et al. (2007) Thompson, T. A., Quataert, E., & Waxman, E. 2007, ApJ, 654, 219
- Venters (2010) Venters, T. M. 2010, ApJ, 710, 1530
- Venters & Pavlidou (2011) Venters, T. M., & Pavlidou, V. 2011, ApJ, 737, 80
- Webbink (1984) Webbink, R. F. 1984, ApJ, 277, 355
- Weekes et al. (1989) Weekes, T. C., et al. 1989, ApJ, 342, 379