Rippled nanocarbons from periodic arrangements of reordered bivacancies in graphene or SWCNTs
Abstract
We report on various nanocarbons formed from a unique structural pattern containing two pentagons, three hexagons and two heptagons, resulting from local rearrangements around a divacancy in pristine graphene or nanotubes. This defect can be inserted in sheets or tubes either individually or as extended defect lines. Sheets or tubes containing only this defect as a pattern can also be obtained. These fully defective sheets, and most of the tubes, present a very pronounced rippled (wavy) structure and their energies are lower than other structures based on pentagons and heptagons published so far. Another particularity of these rippled carbon sheets is their ability to fold themselves into a two-dimensional porous network of interconnected tubes upon heat treatment as shown by hybrid Monte Carlo simulations. Finally, contrary to the common belief that pentagon/heptagon based structures are metallic, this work shows that this defect pattern should give rise to semi-metallic conduction.
I Introduction
Graphene may contain defects. This is now an established fact as it has been directly imaged, thanks to atomic resolution electron microscopy Hashimoto et al. (2004); Meyer et al. (2008); Lahiri et al. (2010); Kotakoski et al. (2011). Defects in graphene have first been obtained by reconstruction around vacancies formed during electron irradiation and leading to pseudo amorphous domains made of pentagons, hexagons and heptagons Hashimoto et al. (2004); Meyer et al. (2008); Kotakoski et al. (2011). They can also show some ordering as observed by Lahiri et al. Lahiri et al. (2010), who describe an extended defect line, made of a periodic repetition of two adjacent pentagons and an octagon, in a graphene sheet epitaxially grown on a Ni substrate with a tilt boundary.
Defects affect the properties of graphene, for the bad in most cases but also sometimes for the good as in the case of Lahiri et al. where the line defect gives to the sheet the electronic properties of a one-dimensional metallic wire Lahiri et al. (2010); Gunlycke and White (2011); Recher and Trauzettel (2011). The quest for stable space-filling one- or two-dimensional structural patterns has started long ago in the virtual world, actually much before the experimental characterization of such defects, thanks to ab-initio and force-fields based modeling approaches Crespi et al. (1996); Terrones et al. (2000); Lusk and Carr (2008, 2009). Somehow, the computer-aided design of new graphene allotropes with targeted electronic or mechanical properties is even becoming a new area in carbon science Carr and Lusk (2010). Among all the structures proposed so far, hexagonal haeckelite has the lowest energy above graphene Terrones et al. (2000). This can be explained by the absence of adjacent pentagonal rings and its high density of pentagon-heptagon () pairs, a remarkably stable pattern Grantab, Shenoy, and Ruoff (2010); Jeong et al. (2008); Yazyev and Louie (2010); Albertazzi et al. (1999).
Two years ago, some of us have developed a new computational method based on a combination of image processing and atomistic simulation, the image guided atomistic reconstruction (IGAR) method Leyssale et al. (2009), aiming at building atomistic models of dense, disordered yet nanostructured, carbons on the basis of their high resolution transmission electron microscopy (HRTEM) lattice fringe images. In this approach, a 3D analogue of the 2D HRTEM image is constructed and serves as an external potential field, pushing the atoms towards the dark areas of the image during a liquid quench molecular dynamics simulation of a carbon system, in which carbon-carbon interactions are taken into account by a reactive empirical bond order potential Brenner et al. (2002); Stuart, Tutein, and Harrison (2000).
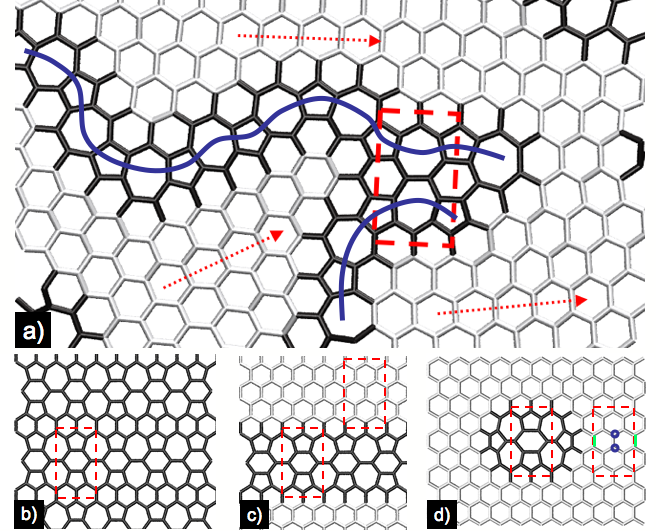
A snapshot of a carbon sheet taken from a model of a rough laminar pyrolytic carbon Bourrat et al. (2006), reconstructed with this method, is shown Figure 1a. As can be seen, the sheet is made of disoriented purely hexagonal domains (light grey) bound together by defective planar areas made essentially of pairs (dark grey) and more precisely lines of pairs as indicated by the blue solid lines. This agrees very well with some recent theoretical studies on dislocations in graphene showing the high stability of the pattern Grantab, Shenoy, and Ruoff (2010); Yazyev and Louie (2010); Jeong et al. (2008). Also, and even though the way this model was obtained has nothing in common with the irradiation of a single graphene layer, its structure is amazingly close from those reported by Meyer and co-workers Meyer et al. (2008); Kotakoski et al. (2011). Looking at this figure, the structural pattern highlighted by the dashed rectangle appeared to be of a particular interest to us. Indeed, this domain, made of two pentagons, three hexagons (including a 90∘ rotated one) and two heptagons, allows for the construction of an entire carbon sheet based on this defect (see 1 b), noted hereafter, as well as for the insertion of a line (1 c) or a point (1 d) defect in graphene. Note that the latter point defect has been very recently observed in a HRTEM Kotakoski et al. (2011).
II Computational methods
II.1 Density functional theory calculations
Geometry optimization of the unit cell has been achieved using periodic density functional theory calculations. The VASP package Kresse and Hafner (1996, 1993); Kresse and Furthmüller (1996) was used with projector augmented wave pseudopotentials Blöchl (1994); Kresse and Joubert (1999) to describe the valence-ion core interactions, and the Perdew-Wang-Ernzerhof generalized gradient approximation for the exchange-correlation potential Perdew, Burke, and Ernzerhof (1996). Atomic positions and lattice parameters were relaxed, and energy criteria of and eV/cell were used for electronic and structural convergences, respectively. A 15 Å interlayer distance was kept fixed for all calculations, and up to 450-point 2D grids were used for Brillouin zone sampling. The kinetic energy cutoff for plane-wave expansions was 400 eV.
II.2 Hybrid Monte Carlo simulations
Geometry optimizations of large planes and tubes were achieved using hybrid Monte Carlo (HMC) simulations Mehlig, Heermann, and Forrest (1992) coupled to a simulated annealing approach. The interaction energy between carbon atoms was described by the reactive AIREBO potential Stuart, Tutein, and Harrison (2000) after removal of the van der Waals terms of this potential. Sheets and tubes were placed in an orthorhombic simulation cell with periodic boundary conditions in all directions. Sheets (respectively tubes) were placed on the plane (resp. along the axis) of the box and a large dimension (500 Å) was given to the dimension (resp. and dimensions) to ensure the simulation of isolated infinite systems.
Two kinds of configuration updates were used (chosen at random) in our HMC implementation, allowing for a proper sampling of configurational space in the isothermal-isobaric () ensemble:
-
•
Short constant energy molecular dynamics (MD) trajectories with initial velocities drawn from a Maxwell distribution at the suited temperature accepted with the usual canonical HMC acceptance criterion Mehlig, Heermann, and Forrest (1992).
-
•
Random contraction or dilation of the volume in one dimension of the system ( or for sheets, for tubes) accepted or rejected with the standard isothermal-isobaric Monte-Carlo acceptance criterion Allen and Tildesley (1987)
Simulations were initiated from the fully planar sheets or fully cylindrical tubes with cell dimensions taken from the corresponding graphene sheets or pristine tubes. Constant HMC simulations of steps were then performed at zero pressure and a given temperature (note that the position of one carbon atom with respect to the simulation cell was held fixed in order to avoid global translation or rotation of the system). After that, the temperature was scaled by a factor 0.9 and the process repeated until convergence of both potential energy and geometry. In the HMC simulations, the probabilities for MD and volume move attempts were respectively of 70 % and 30 %. The length of the MD trajectories (both in terms of the number of steps and of the timestep length) as well as the magnitude of the maximum volume change attempt were periodically adjusted to yield acceptance ratios of around 50 % for both kinds of moves. We used an initial temperature of 500 K and stopped the simulated annealing when the temperature was below , which appeared to be sufficient for a full convergence of geometry and energy.
In the last part of the paper (see Figure 5) HMC was not used anymore to cool a system down to 0K but to heat it up, as slowly as possible, to high temperatures. In that case similar simulations were used except that (i) the initial configuration was taken from the previously minimized system at 0 K; that (ii) HMC steps were performed at each temperature and that (iii) the target temperature was slowly increased by steps of 10 K.
III Results
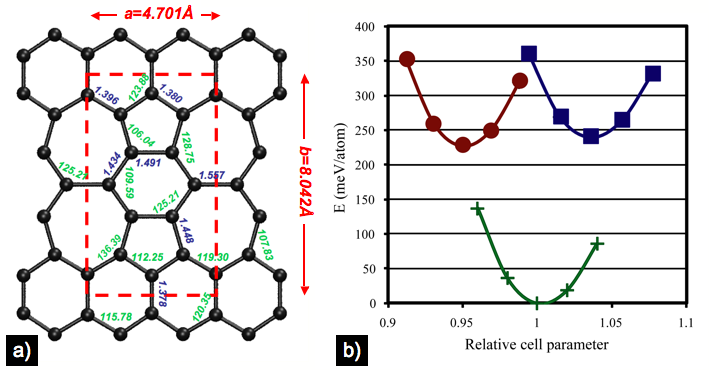
Figure 2a shows the unit cell of the as optimized by periodic density functional theory (DFT) calculations. No significant deviation from the rectangular lattice and no departure from planarity were found in our DFT calculations; however, this holds for the 14-atoms unit cell of Figure 2a and does not exclude non-planar configurations in supercells, i.e. with larger degrees of freedom, as we will see in what follows. The energy of the optimized structure (see Figure 2b) is only of 227 meV/atom above graphene, making it the lowest energy defect-containing carbon sheet reported so far. To our knowledge, it was formerly the case of hexagonal haeckelite, with an energy of 240 meV/atom above graphene (note that we compare to those structures as optimized using the same methodology that we applied to the sheet). Also, Figure 2b shows that the potential wells of the three structures are very similar.
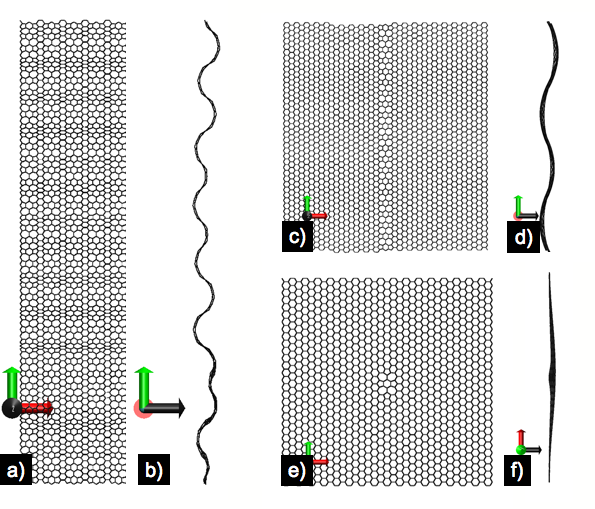
We present now the properties of large carbon sheets and nanotubes based on the pattern as obtained from cell and geometry optimizations using hybrid Monte Carlo Mehlig, Heermann, and Forrest (1992) (HMC) simulated annealing and the AIREBO force field Stuart, Tutein, and Harrison (2000). Figure 3 shows a front (a) and a side (b) view of an optimized periodic sheet made of unit cells. The energy of this sheet, as given by the AIREBO potential is of eV/atom, meV/atom above graphene as computed with the same potential ( eV/atom). Relative energies of the , haeckelite and graphene sheets given by this potential are in fair qualitative agreement with DFT calculations (haeckelite is found at meV/atom above graphene with this potential). However, a major difference is observed between haeckelite and sheets. Indeed, if the geometry optimization of a large haeckelite sheet reveals an almost planar geometry, Figures 3a and 3b unambigously unravel a wavy structure developing itself along the unit cell direction, the direction of the adjacent hexagons lines in the structure. Optimizing the number of unit cells in that direction we found out that the best possible periodicity is four unit cells along the axis, giving rise to an optimal energy of eV/atom. The line defect of Figures 3c and 3d is also of particular interest. First, and even though it is not easy to directly compare the energies of different line defects, it should be of rather low energy as it is made of a remarkably stable pattern (the ). Second, while other observed Lahiri et al. (2010) or predicted Lusk and Carr (2008); Gunlycke and White (2011) line defects usually induce a curvature of the sheet perpendicularly to the line, Figure 3d clearly shows that the pattern gives a wavy structure to the sheet, along the line defect, in close similarity with the wavy structure developed on the perfect sheet, though attenuated by the large hexagonal domains on both sides. The point defect of Figures 3e and 3f also has an excellent energetic stability, but affects only very locally the structure of the sheet. It is an antisymmetric defect with an inversion center localized on the center of the inverted hexagon. We recall that this point defect has been very recently imaged by Kotakoski et al. during a HRTEM observation of an irradiated graphene layerKotakoski et al. (2011).
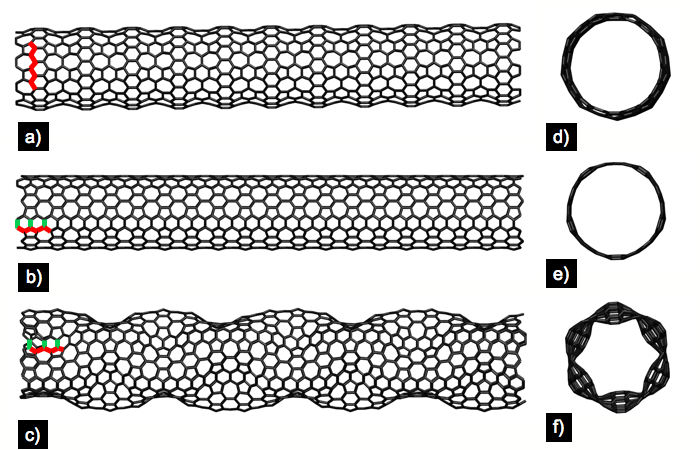
As already said, the pattern likes curvature. This should then be a particurlarly stable pattern to build nanotubes with. In close similarity with pristine, graphene based zigzag (ZZ) and armchair (AC) tubes we have built ZZ and AC tubes by folding ribbons along respectively the and axes of the pattern’s unit cell (see also the caption of Figure 4). We present now some results of HMC geometry optimizations on ZZ and AC tubes of different diameters, ranging from to Å, and with lengths around 9 nm. Figure 4 present snapshots of the optimized ZZ9, AC5 and AC6 tubes. Their diameters, taken as the double of the mean atomic distance from the tube axis, are respectively , and Å. All these tubes have rather low energies, respectively , and eV/atom for ZZ9, AC5 and AC6; and present different morphologies. All zigzag tubes studied in this work have a ”necklace of pearls” shape as shown on Figures 4a and 4d for ZZ9, in close similarity with some haeckelite tubes Biró et al. (2004). Low diameter armchair tubes (from AC3 to AC5) have a fairly cylindrical morphology (see the snapshots of tube AC5 on Figs 4b and 4e), typical of graphene based tubes. However, from AC6 (14.7 Å) to AC12 (29.9 Å), armchair tubes develop a pronouced helical morphology (see the snapshots of tube AC6 tube on Figs 4c and 4f).
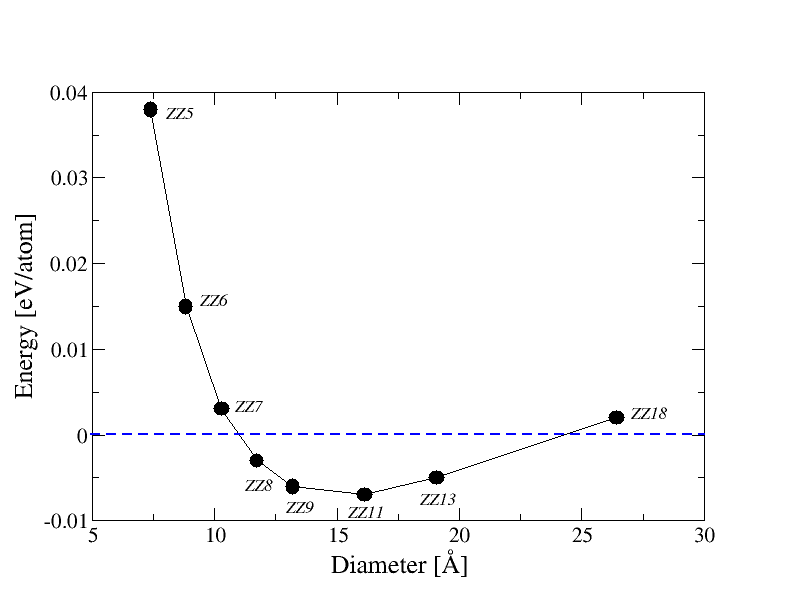
On Figure 5 we plot the energy of ZZ tubes as a function of their diameter relatively to the sheet of lowest energy (-7.135 eV/atom). As expected, the energy per atom, around 40 meV above the sheet for the smallest tube, diminishes with the tube diameter at low diameters thanks to the relaxation of curvature stresses. However, the behaviour of the curve above 10 Å is particularly unusual. First, we can see that ZZ tubes with diameters in the range [12:25 Å], from ZZ8 to ZZ13 here, have lower energies than the rippled sheet. Second, the curve goes through a minimum around 15 Å, with the minimum energy tube found here, ZZ11, being 7 meV/atom lower than the sheet. Finally, above 25 Å diameter, ZZ18 tube has a positive energy with respect to the sheet. These results indicate once again the high affinity of the pattern for curvature along the lines of hexagons ( axis) and tend to show that there exists an optimal curvature for this pattern which corresponds roughly to a 15 Å diameter ZZ tube.
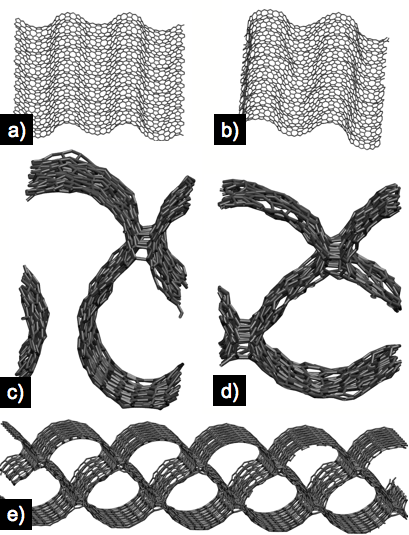
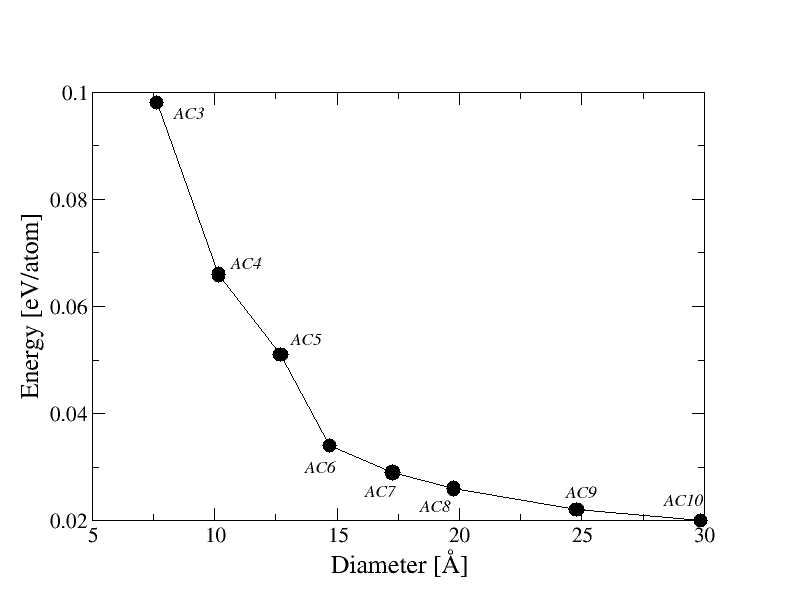
Figure 6 is equivalent to Figure 5 for armchair tubes. The first points to note are that AC tubes present higher energies than ZZ tubes at equivalent diameters and that all the AC tubes studied in this work have higher energies than the lowest rippled sheet. For instance, the most stable AC tube studied in this work, AC10 ( 30 Å), is found 20 meV/atom above the sheet. Unlike ZZ tubes, the evolution of AC tubes energy with respect to diameter is monotonically decreasing; however, a step is observed between the low diameter cylindrical tubes (AC3 to AC5) and the larger helical tubes (AC6 to AC10).
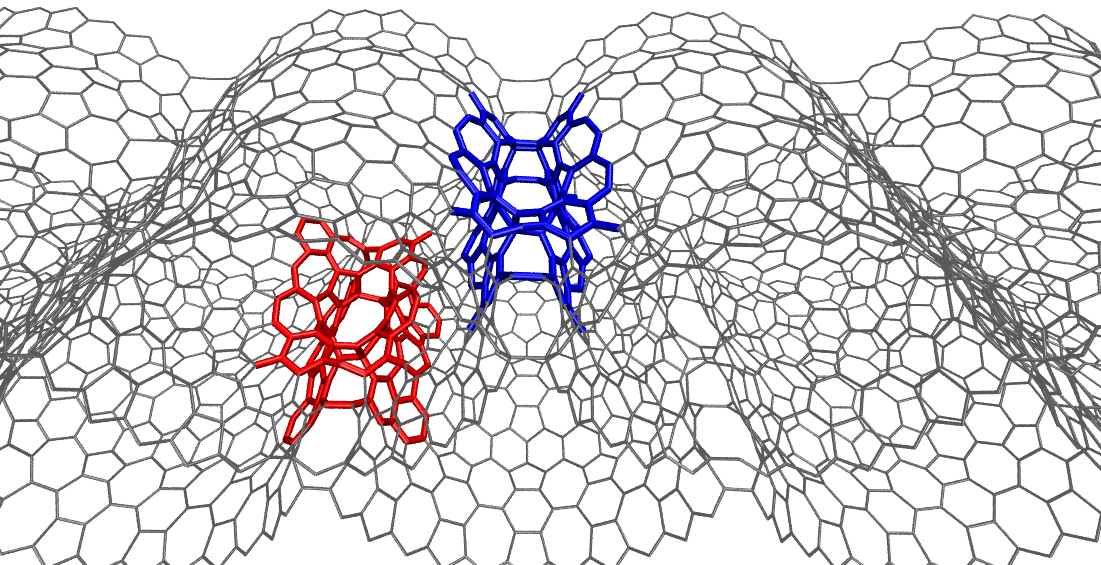
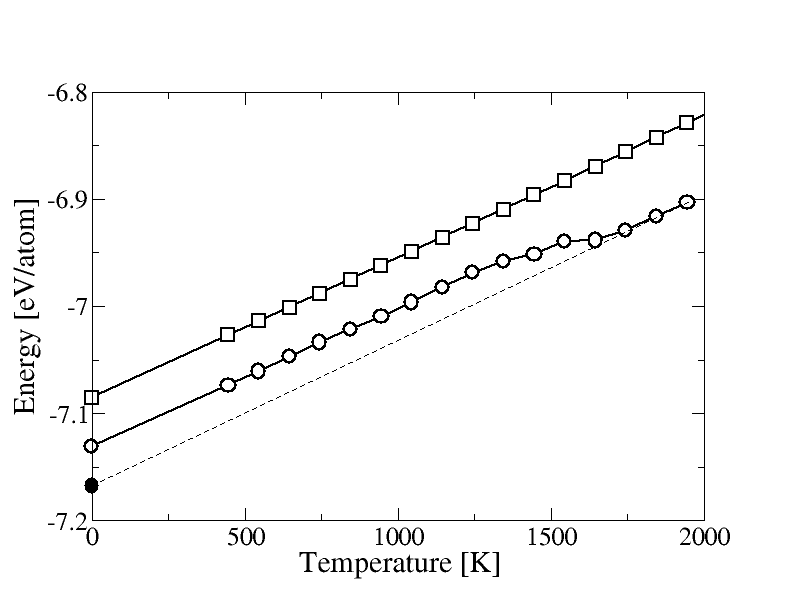
In order to investigate the thermal stability of the sheet we now present results of a HMC simulation in which a periodic sheet of 2142 atoms was slowly heated from 0 to 2000 K. The evolution of the energy per atom as a function of temperature is shown on Figure 7 and some snapshots of the system during the heating process are given Figure 8. As can be seen on Figure 7, the energy evolves rather linearly with temperature at low temperatures and the sheet shows three well defined waves (see Figure 8a). Around 1000 K, a slight drop in the energy increase is observed and the sheet evolves from three low amplitude waves (Figure 8a) to two well-pronounced waves (Figure 8b). The energy then keeps on increasing linearly until another drop at around 1400 K. At that point, two parts of the sheet enter into contact and form a regular bridge, containing hybridized atoms, all along the unit cell axis (Figure 8c). This is shortly followed by the formation of a second, and symmetric, bridge around 1700 K to form an almost perfect periodic two-dimensional network of interconnected tubes (Figure 8d). This rippled nanocarbon obtained at 2000 K, shown on Figure 8d, has then been optimized by a HMC simulated annealing quench down to 0 K, the latter structure being shown Figure 8e. Its energy, of eV/atom, is meV/atom below the one of the initial sheet, indicating, once again, the affinity of the pattern for high curvatures. The diameters of the interconnected tubes forming this porous structure are actually very similar to those of the ZZ9 tube presented on Figures 4a and 4d, and correspond to the optimum curvature for zigzag tubes (see Figure 5). Looking at Figure 8e, the structure of this carbon immediately reminds of some shock protection materials used in everydays life packaging and there is no major risk taken in guessing that its mechanical properties would be particularly unusual. Also, it should be regarded as a very interesting adsorbent due to its aligned network of high aspect ratio tubular pores.
Figure 9 shows an enlargement of Figure 8d, to unravel the porous nature and accessibility of this new form of carbon. As can be seen on this figure, those pores are extremely easy to access, thanks to numerous windows all along the structure, probably facilitating any adsorption/desorption process with respect to other CNT based adsorbents.
Finally, it is interesting to note, as illustrated on the top of Figure 7, that the same heating simulation on haeckelite shows a perfectly linear evolution of energy with temperature which corresponds to a perfect conservation of the sheet structure (not shown), aside from thermal vibrations.
IV Conclusion
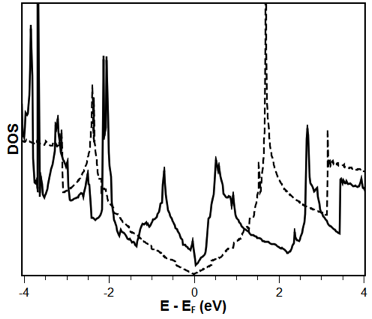
We have proposed new rippled carbon planes and tubes based on a new structural pattern, the pattern, recently observed in some atomistic models of pyrocarbons. These structures can be either entirely made of this pattern or inserted as line or point defects in graphene or graphene-based tubes. Both DFT and force field energy minimisations show that structures built from this pattern have low energies (actually, the lowest energies reported so far) for structures with a high density of non-hexagonal rings. Another evidence of the high stability associated to this pattern is that the point defect of Figures 3e and 3f has been recently imaged in a TEM Kotakoski et al. (2011). Structures based on the pattern love curvature and show rather unusual properties: (i) sheets have a pronounced wavy structure; (ii) line defects develop a parallel wavy structure; (iii) tubes may show lower energies than sheets; and (iv), sheets are able to close themselves under heat treatment to form a 2D ordered nanoporous carbon. Finally, the highest surprise stemming from this defect type maybe lies in its electronic properties. Indeed, it is now a common thought that pentagon and heptagon containing carbon structures are metallic Crespi et al. (1996); Terrones et al. (2000); Rocquefelte et al. (2004); Gunlycke and White (2011); Lahiri et al. (2010); Kahaly, Singh, and Waghmare (2008). As can be seen on the density of states plot of Figure 10, and despite its high density of pentagons and heptagons, the network is semi-metallic, alike graphene (although its DOS has more features than the one of graphene due to its lower symmetry and the more complex connectivity path of its carbon network).
Acknowledgements
Access to the computer ressources of the Mesocentre de Calcul Intensif en Aquitaine (MCIA) is gratefully acknowledged.
References
- Hashimoto et al. (2004) A. Hashimoto, K. Suenaga, A. Gloter, K. Urita, and S. Iijima, Nature 430, 870 (2004).
- Meyer et al. (2008) J. C. Meyer, C. Kisielowski, R. Erni, M. D. Rossell, M. F. Crommie, and A. Zettl, Nano Lett. 8, 3582 (2008).
- Lahiri et al. (2010) J. Lahiri, Y. Pin, P. Bozkurt, I. I. Oleynik, and M. Batzill, Nature Nanotech. 5, 326 (2010).
- Kotakoski et al. (2011) J. Kotakoski, A. V. Krasheninnikov, U. Kaiser, and J. C. Meyer, Phys. Rev. Lett. 106, 105505 (2011).
- Gunlycke and White (2011) D. Gunlycke and C. T. White, Phys. Rev. Lett. 106, 136806 (2011).
- Recher and Trauzettel (2011) P. Recher and B. Trauzettel, Physics 4, 25 (2011).
- Crespi et al. (1996) V. H. Crespi, L. X. Benedict, M. L. Cohen, and S. G. Louie, Phys. Rev. B 53, R13303 (1996).
- Terrones et al. (2000) H. Terrones, M. Terrones, E. Hernández, N. Grobert, J.-C. Charlier, and P. M. Ajayan, Phys. Rev. Lett. 84, 1716 (2000).
- Lusk and Carr (2008) M. T. Lusk and L. D. Carr, Phys. Rev. Lett. 100, 175503 (2008).
- Lusk and Carr (2009) M. T. Lusk and L. D. Carr, Carbon 47, 2226 (2009).
- Carr and Lusk (2010) L. D. Carr and M. T. Lusk, Nature Nanotech. 5, 316 (2010).
- Grantab, Shenoy, and Ruoff (2010) R. Grantab, V. B. Shenoy, and R. S. Ruoff, Science 330, 946 (2010).
- Jeong et al. (2008) B. W. Jeong, J. Ihm, , and G.-D. Lee, Phys. Rev. B 78, 165403 (2008).
- Yazyev and Louie (2010) O. V. Yazyev and S. G. Louie, Phys. Rev. B 81, 195420 (2010).
- Albertazzi et al. (1999) E. Albertazzi, C. Domene, P. W. Fowler, T. Heine, G. Seifert, C. V. Alsenoy, and F. Zerbetto, Phys. Chem. Chem. Phys. 1, 2913 (1999).
- Leyssale et al. (2009) J.-M. Leyssale, J.-P. Da Costa, C. Germain, P. Weisbecker, and G. L. Vignoles, App. Phys. Lett. 95, 231912 (2009).
- Brenner et al. (2002) D. W. Brenner, O. A. Shenderova, J. A. Harrison, S. J. Stuart, B. Ni, and S. B. Sinnott, J. Phys.: Condens. Matt. 14, 783 (2002).
- Stuart, Tutein, and Harrison (2000) S. J. Stuart, A. B. Tutein, and J. A. Harrison, J. Chem. Phys. 112, 6472 (2000).
- Bourrat et al. (2006) X. Bourrat, F. Langlais, G. Chollon, and G. L. Vignoles, J. Braz. Chem. Soc. 17, 1090 (2006).
- Kresse and Hafner (1996) G. Kresse and J. Hafner, Comput. Mater. Sci. 6, 15 (1996).
- Kresse and Hafner (1993) G. Kresse and J. Hafner, Phys. Rev. B 47, 558 (1993).
- Kresse and Furthmüller (1996) G. Kresse and J. Furthmüller, Phys. Rev. B 54, 11169 (1996).
- Blöchl (1994) P. E. Blöchl, Phys. Rev. B 50, 17953 (1994).
- Kresse and Joubert (1999) G. Kresse and J. Joubert, Phys. Rev. B 59, 1758 (1999).
- Perdew, Burke, and Ernzerhof (1996) J. P. Perdew, K. Burke, and M. Ernzerhof, Phys. Rev. Lett. 77, 3865 (1996).
- Mehlig, Heermann, and Forrest (1992) B. Mehlig, D. W. Heermann, and B. M. Forrest, Phys. Rev. B 45, 679 (1992).
- Allen and Tildesley (1987) M. P. Allen and D. J. Tildesley, Computer Simulation of Liquids (Oxford University Press, 1987).
- Biró et al. (2004) L. P. Biró, G. I. Márk, Z. E. Horváth, K. Kertész, J. Gyulai, J. B. Nagy, and P. Lambin, Carbon 42, 2561 (2004).
- Rocquefelte et al. (2004) X. Rocquefelte, G.-M. Rignanese, V. Meunier, H. Terrones, M. Terrones, and J.-C. Charlier, Nano Lett. 4, 805 (2004).
- Kahaly, Singh, and Waghmare (2008) M. U. Kahaly, S. P. Singh, and U. V. Waghmare, Small 4, 2209 (2008).