-titleHadron Collider Physics symposium (HCP 2011) 11institutetext: DSM/IRFU (Institut de Recherches sur les Lois Fondamentales de l’Univers), CEA Saclay (Commissariat à l’Energie Atomique), Gif-sur-Yvette, France
Di-boson results at ATLAS
Abstract
Pairs of gauge boson produced in proton-proton collisions at a center-of-mass energy of are reconstructed with the ATLAS detector in their leptonic final states. Based on samples of integrated luminosity (for , and ) and (for and ) of 2011 and 2010 LHC data, the total di-boson production cross sections are measured. They are found, together with the kinematic distributions of the selected di-boson systems to be compatible with the expectation from the Standard Model. The di-boson production also gives a handle on possible anomalous triple gauge boson couplings, for which 95% confidence limits are set.
1 Introduction
In the Standard Model (SM), the triple gauge boson couplings (TGCs) are fully constraint by the electroweak symmetry. In particular, the , and neutral TGC vertices are are absent, whereas the and vertices are predicted non-zero. For this reason, the measurement of the di-boson final states at the LHC provides an important test of the SM: beyond Standard Model physics could contribute to the TGCs and result in modified di-boson cross sections or final state kinematics. Furthermore, non-resonant di-boson productions are a background to the search for the Higgs boson, so it is essential to understand their detection sensitivity.
This note presents measurements of the di-boson production in proton-proton collisions at a center-of-mass energy of , with the ATLAS experiment RefAtlasExperiment : their production cross sections are measured, and first limits on anomalous triple gauge boson couplings (aTGCs) are set. A sample of integrated luminosity of 2011 LHC data was used to measure the , and final states, and of 2010 data for the and final states. Presently, the only decay modes used to reconstruct these final states are and (with or ): the branching fractions are small, but the experimental signatures are clean.
2 Electrons, muons and photons
One of the important categories of backgrounds of the analyses presented in this note is arising from the QCD processes: a jet may produce a fake prompt lepton or photon signal. For example, pions may be mis-identified as electrons or photons. Another example is heavy flavour jets, which may result in real leptons in the final state. The main tools to reject this background are cuts on the lepton and photon identification quantities provided by the detector, which may be tightened if necessary, and cuts on the isolation energy (the sum of the transverse energies measured by the calorimeter or the inner detector, in a cone of fixed size around the candidate lepton or photon).
The probability that particles from jets pass the lepton and photon identification and isolation cuts is so small that it would be both impractical and inaccurate to estimate this background with Monte-Carlo (MC) simulation. Instead, the analyses presented in this note rely on a data-driven method.
A control region enriched in events from the QCD process is built using the full selection of the chosen final state, except that the isolation or identification cuts are reversed. The event yield observed in the control region is extrapolated to the signal region, by the use of a fake factor. The fake factor needs to be estimated in an independent QCD control sample: for example a sample of di-jet triggered events, or, if available, a sample obtained by reversing another of the analysis cuts.
The estimation of this fake factor is in general a significant source of systematic error: in particular the fake factor varies with data taking conditions (instantaneous luminosity and pile-up), and the control region may inaccurately describe the jet content of the signal region (heavy to light jet ratio for example).
3
The signal is measured in final states with two leptons and missing transverse energy () RefWW . Background discrimination and estimation is challenging as several processes may fake this final state, either because they contain real leptons and (top events, discriminated by a jet veto), or fake (Drell-Yan, discriminated with dilepton mass veto and tight cut) or jets misidentified as prompt leptons ( events, discriminated with tight lepton identification and isolation cuts). After applying a tight selection, events are observed in a sample of integrated luminosity , for a total estimated background of events, determined with a combination of data-driven and MC techniques. The dominant systematics are coming from the background estimation: the uncertainty arising from the jet veto, and from the fake prompt lepton estimation.
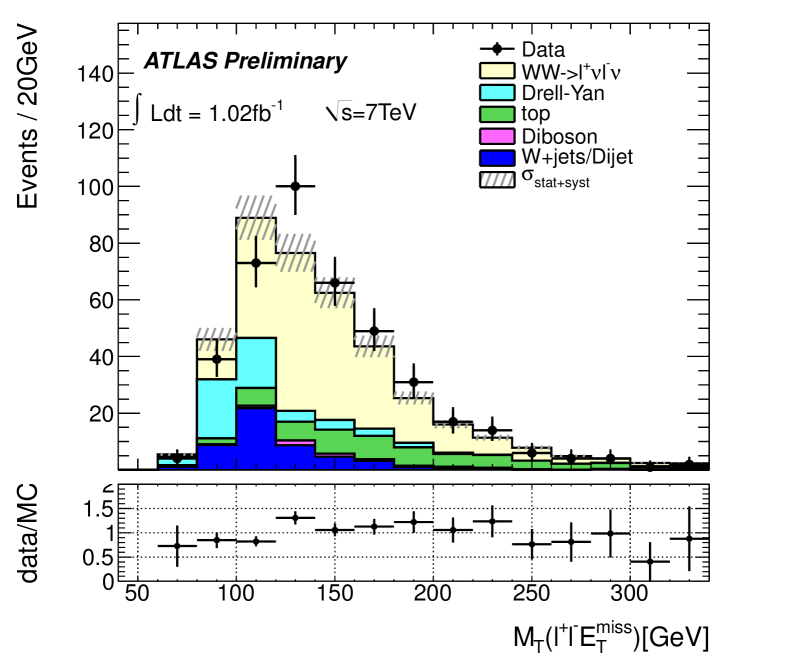
Figure 1 presents the distribution of the transverse mass of the di-lepton plus system after selection: no significant deviation from the SM expectation is observed. The event yield is converted to the total cross section , which is compatible with the SM prediction at next-to-leading order (NLO) of .
4
candidates are selected from events containing three isolated leptons ( or ) and missing transverse energy RefWZ , where two of the leptons have a corresponding invariant mass compatible with an on-shell decay. In comparison with the analysis, the analysis benefits from a three-lepton requirement which reduces most of the background. For that reason, and in order to increase the analysis acceptance, slightly looser lepton requirements are applied for the leptons making the Z candidate than for the one entering the . After selection, a total of events are observed in a sample of integrated luminosity . The total estimated background is of events, composed of and top events with a jet mis-identified as a lepton (estimated with a data-driven technique), and (estimated from the MC).
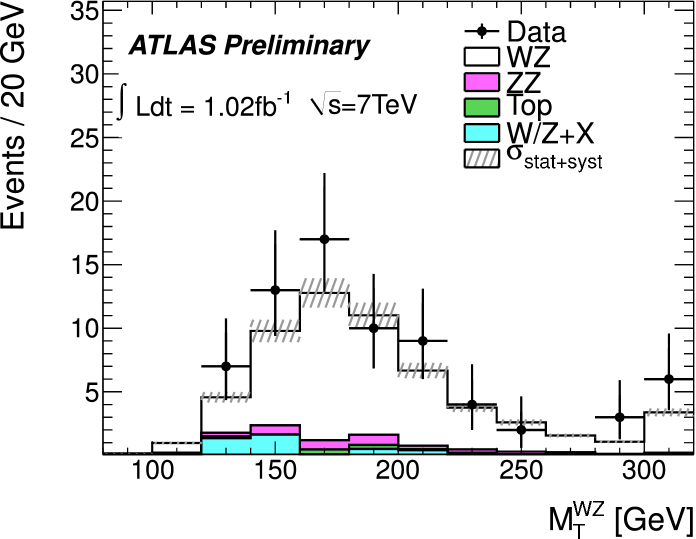
Figure 2 shows the distribution of the transverse mass of the three leptons plus system after selection. The distribution is compatible with the expectation from the SM. The event yield is converted to the cross section , compatible with SM prediction at NLO of .
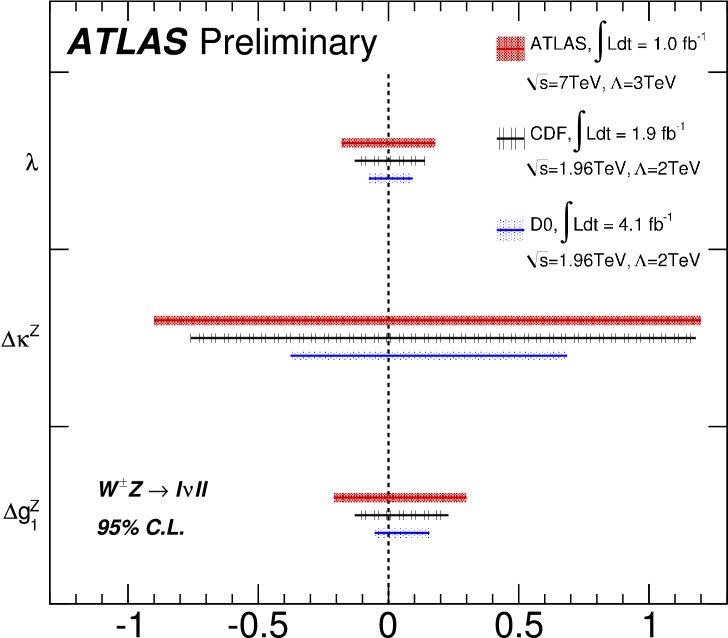
events are additionally used to research for possible aTGC terms. Expressions for the most general effective Lagrangian for a TGC vertex may be found in RefHagiwara and RefEllison . Three terms of this effective lagrangian describing aTGCs are presently accessible with the ATLAS data: , and . The cross-section measurement is used to determine 95% frequentist confidence intervals on these three terms, which are shown in figure 3, and are compared to Tevatron limits. The limits set by ATLAS are compatible with those of Tevatron, which have the best sensitivity at the moment. In the future, ATLAS will use the information in the kinematic distributions of the system to improve these limits.
5
The researched signature for the signal RefZZ is events containing two pairs of isolated leptons ( or ), compatible with on-shell decays. Events with four leptons at the LHC are extremely rare, making the analysis effectively background free. A total of twelve events are observed for an integrated luminosity . The backgrounds considered in this analysis are inclusively events or , where is a jet mis-identified as a lepton (such final states may be found in top and events). Most of these events are rejected by the isolation requirement. A data-driven technique is used to estimate this background and results in events.
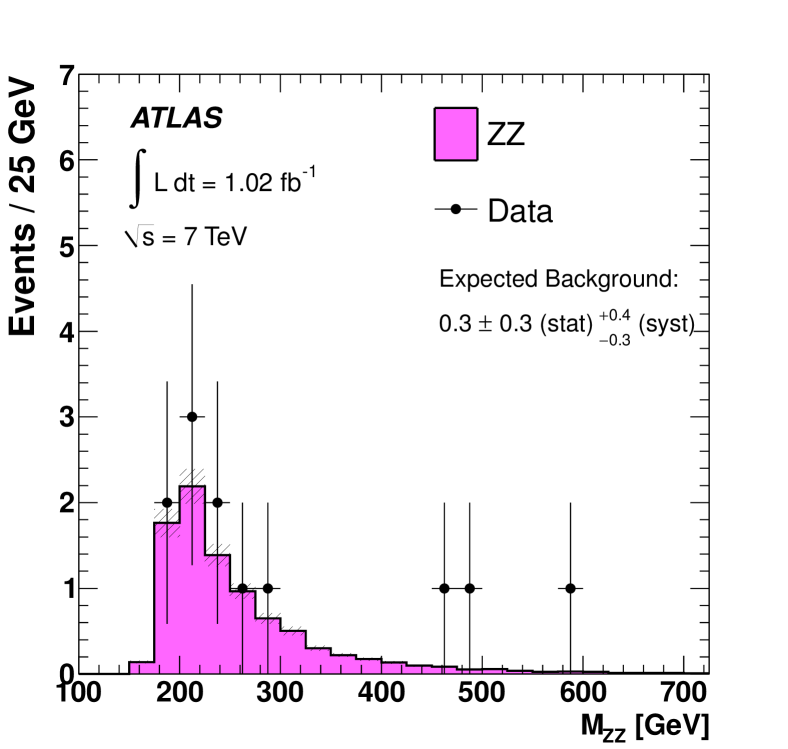
Figure 4 presents the invariant mass distribution of the four-lepton system after selection. Although three events are observed at an invariant mass , the distribution is estimated to be compatible with the SM expectation. The event yield is used to estimate the total cross section , consistent with the SM prediction at NLO of .
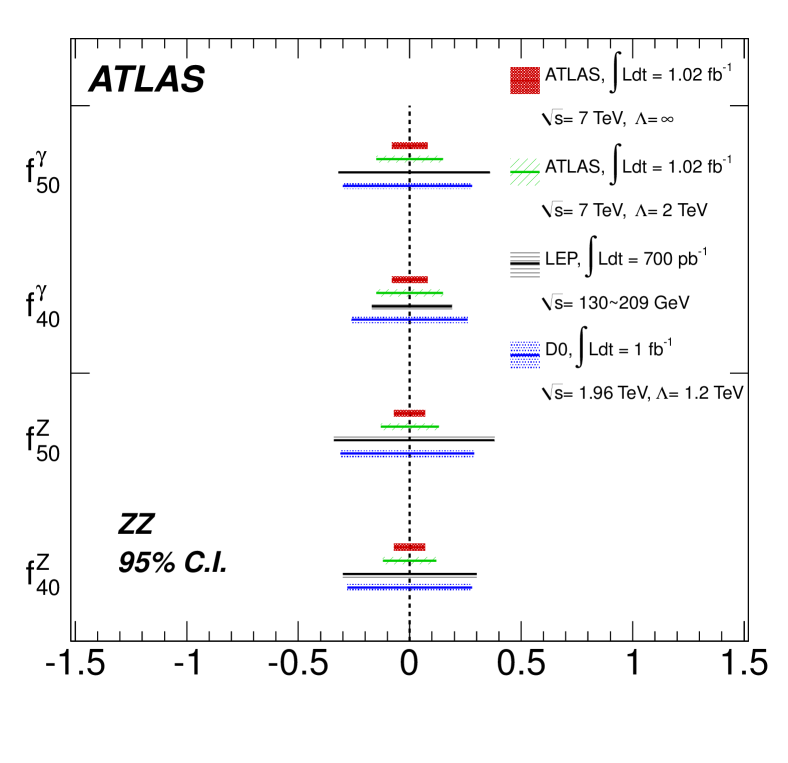
Similarly to the analysis, possible aTGC terms are researched using the selected event yield. In the general effective lagrangian, four aTGC vertices are accessible in ATLAS data: , , and . 95% frequentist confidence intervals are set on these four terms and are presented in figure 5. The limits set by ATLAS for neutral TGC terms are compatible, and exceed in precision, the limits set by previous experiments from LEP and Tevatron.
6 and
The researched signals and contain a leptonic or candidate, and a highly energetic photon RefVg . The signal is defined with phase space cuts on the photon energy (), separation from closest lepton (), and isolation at parton level (). With these cuts, 8% of the signal comes from photons originating from the fragmentation process, and no effort is made to disentangle them from the photon production of the hard process.
An integrated luminosity of of 2010 LHC data is analysed and results in 192 candidates and 48 candidates. The background is estimated with a data-driven technique and accounts for of the selection and of the selection.
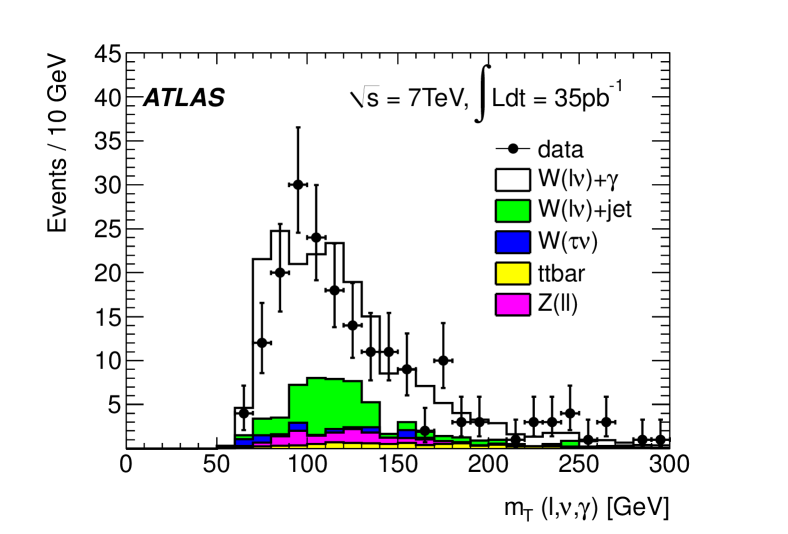
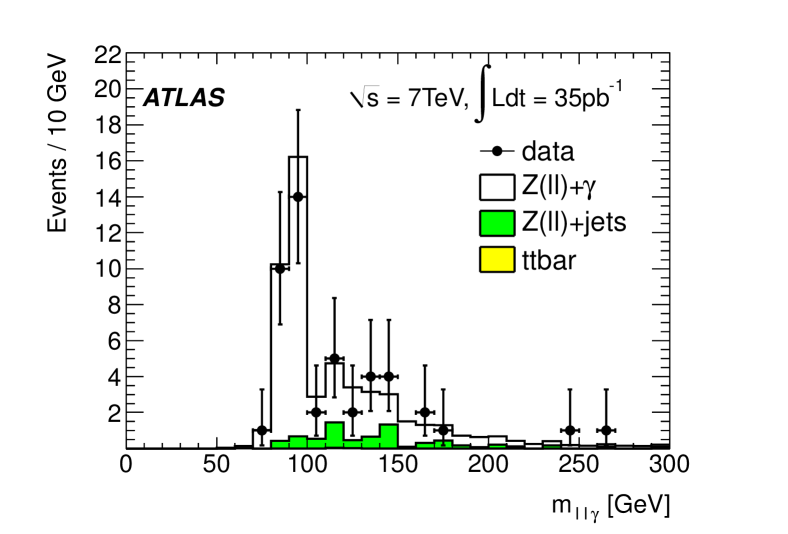
Figure 6 presents the distribution of the transverse mass of the system for the selected candidates, and figure 7 the invariant mass of the system for the candidates. The kinematic distributions are compatible with the expectation from the SM. The event yields are converted to cross section measurements after background subtraction. For , the cross section is measured , for a SM prediction at NLO of . For , the measurement is , for a SM prediction of . Both cross sections are compatible with the SM expectation.
7 Conclusion
Measurements of the production cross sections , , , and have been performed with the ATLAS detector at center-of-mass energy, using samples of and of 2011 and 2010 LHC data. The total production cross sections are compatible with the SM predictions, and the kinematic distributions of the various di-boson systems do not show evidence of new physics. Since the di-boson production is sensitive to the predicted three-boson coupling of the Standard Model, two of the di-boson measurements ( and ) have been used to set first ATLAS limits on possible anomalous TGC terms.
References
- (1) ATLAS Collaboration, JINST 3, S08003 (2008)
- (2) ATLAS Collaboration, ATLAS-CONF-2011-110 (2011) https://cdsweb.cern.ch/record/1373412
- (3) ATLAS Collaboration, ATLAS-CONF-2011-099 (2011) https://cdsweb.cern.ch/record/1369214
- (4) K. Hagiwara et al., Nucl. Phys. B282 (1987) 253
- (5) J. Ellison et al., Ann. Rev. Nucl. Part. Sci. 48 (1998) 33
- (6) CDF Collaboration, http://www-cdf.fnal.gov/physics/ewk/2008/WZatgc/
- (7) D0 Collaboration, Phys. Lett. B695 (2011) 67
- (8) ATLAS Collaboration, arXiv:1110.5016 [hep-ex] (2011), accepted by Phys. Rev. Lett.
- (9) LEP Collaborations, arXiv:hep-ex/0612034v2 (2006)
- (10) D0 Collaboration, Phys. Rev. Lett. 100 (2008) 131801
- (11) ATLAS Collaboration, JHEP 09 (2011) 072