The HST/ACS Coma Cluster Survey. VIII. Barred Disk Galaxies in the Core of the Coma Cluster11affiliation: Based on observations with the NASA/ESA Hubble Space Telescope obtained at the Space Telescope Science Institute, which is operated by the Association of Universities for Research in Astronomy, Inc., under NASA contract NAS 5-26555. These observations are associated with program GO10861.
Abstract
We use high resolution () F814W ACS images from the Hubble Space Telescope ACS Treasury survey of the Coma cluster at 0.02 to study bars in massive disk galaxies (S0s), as well as low-mass dwarf galaxies in the core of the Coma cluster, the densest environment in the nearby Universe. Our study helps to constrain the evolution of bars and disks in dense environments and provides a comparison point for studies in lower density environments and at higher redshifts. Our results are: (1) We characterize the fraction and properties of bars in a sample of 32 bright (, ) S0 galaxies, which dominate the population of massive disk galaxies in the Coma core. We find that the measurement of a bar fraction among S0 galaxies must be handled with special care due to the difficulty in separating unbarred S0s from ellipticals, and the potential dilution of the bar signature by light from a relatively large, bright bulge. The results depend sensitively on the method used: the bar fraction for bright S0s in the Coma core is 50 11%, 65 11%, and 60 11% based on three methods of bar detection, namely strict ellipse fit criteria, relaxed ellipse fit criteria, and visual classification. (2) We compare the S0 bar fraction across different environments (the Coma core, Abell 901/902, and Virgo) adopting the critical step of using matched samples and matched methods in order to ensure robust comparisons. We find that the bar fraction among bright S0 galaxies does not show a statistically significant variation (within the error bars of 11%) across environments which span two orders of magnitude in galaxy number density ( 300–10,000 gal/Mpc3), and include rich and poor clusters, such as the core of Coma, the Abell 901/902 cluster, and Virgo. We speculate that the bar fraction among S0s is not significantly enhanced in rich clusters compared to low density environments due to two reasons. Firstly, S0s in rich clusters are less prone to bar instabilities as they are dynamically heated by harassment and are gas poor as a result of ram pressure stripping and accelerated star formation. Secondly, high-speed encounters in rich clusters may be less effective than slow, strong encounters in inducing bars. (3) We also take advantage of the high resolution of the ACS ( 50 pc) to analyze a sample of 333 faint () dwarf galaxies in the Coma core. Using visual inspection of unsharp-masked images, we find only 13 galaxies with bar and/or spiral structure. An additional eight galaxies show evidence for an inclined disk. The paucity of disk structures in Coma dwarfs suggests that either disks are not common in these galaxies, or that any disks present are too hot to develop instabilities.
1 Introduction
Mounting evidence suggests that at 1, major mergers among massive galaxies are not very frequent (e.g., Bell et al. 2006; Jogee et al. 2009; Robaina et al. 2009; Weinzirl et al. 2009) and have not contributed significantly to the cosmic star formation rate (SFR) density (e.g., Bell et al. 2005; Wolf et al. 2005; Jogee et al. 2009; Robaina et al. 2009) or to the building of bulges in massive spirals (Weinzirl et al. 2009; Kormendy & Fisher 2008; Laurikainen et al. 2007) since . Other processes, such as minor mergers (Jogee et al. 2009; Weinzirl et al. 2009), or internal secular processes (Laurikainen et al. 2007; Kormendy & Fisher 2008) are increasingly invoked.
The most efficient internal driver of evolution in disk galaxies are stellar bars. They effectively redistribute angular momentum in the disk and dark matter (DM) halo, and drive large gas inflows to the central regions of galaxies. The resulting central dense gas concentrations ignite powerful starbursts (Schwarz 1981; Sakamoto 1999; Jogee 1999; Jogee et al. 2005; Sheth et al. 2005). In this way, bars are thought to build disky central components known as pseudobulges (Hohl 1975; Kormendy 1979; Combes & Sanders 1981; Combes 1990; Kormendy 1993; Jogee 1999, Jogee et al. 2005).
We describe below some of the recent progress made in exploring the bar fraction (defined as the fraction of disk galaxies hosting a large-scale bar) in terms of methodology, dependence on Hubble type, redshift, and environment. For a long time, statistics on the optical bar fraction in the local universe came from visual classification of the galaxies in the Third Reference Catalog of Bright Galaxies (RC3; deVaucouleurs et al. 1991). In the RC3, over all disk galaxies (S0–Im), the visual optical bar fraction is 30% for strong bars (SB), and 30% for weak bars (SAB), giving 60% overall. The RC3 optical bar fraction suffers from two limitations: firstly, it denotes the optical bar fraction averaged over a broad range of Hubble types, and secondly, it is based on visual classification to identify and characterize bars, thus giving no quantitative measurements of their properties (such as size, shape, strength). In fact, the former limitation has persisted in many recent studies which focus on the average bar fraction over disks of all Hubble types (Eskridge et al. 2000; Knapen et al. 2000; Hunt & Malkan 1999; Mulchaey & Regan 1997; Laine et al. 2002; Laurikainen et al. 2004; Block et al. 2004; although see Odewahn 1996).
Recent studies have made important headway on both fronts. Firstly, quantitative methods such as ellipse fitting (e.g., Wozniak et al. 1995, Friedli et al. 1996; Regan & Elmegreen 1997; Mulchaey & Regan 1997; Jogee et al. 1999, 2002, 2004; Knapen et al. 2000; Laine et al. 2002; Sheth et al. 2003, 2008; Elmegreen et al. 2004; Menéndez-Delmestre et al. 2007; Marinova & Jogee et al. 2007, hereafter MJ07; Aguerri et al. 2009), and bulge-bar-disk decomposition (e.g., Laurikainen et al. 2005; Reese et al. 2007, Weinzirl et al. 2009, Gadotti 2011) are being used to reduce the level of subjectivity. Secondly, evidence is mounting that the bar fraction varies across galaxies of different Hubble types (Barazza, Jogee, & Marinova 2008, hereafter BJM08; Aguerri et al. 2009; Marinova et al. 2009, hereafter M09) and depends non-monotonically on the host galaxy properties, such as bulge-to-total ratio (), luminosity, stellar mass, and color, at a range of redshifts and environments (M09; Barazza et al. 2009; Weinzirl et al. 2009; Laurikainen et al. 2009; Nair & Abraham 2010a; Cameron et al. 2010; Gadotti 2011).
Most of the results described above have focused on field galaxies at low redshifts, while much less is known about barred disks at higher redshifts (Abraham et al. 1999; Sheth et al. 2003; Jogee et al. 2004; Sheth et al. 2008; Cameron et al. 2010), and in dense environments. Dense environments such as clusters can be an important laboratory for studying the co-evolution of bars and their host disks, as there are many physical processes, which are unique to such environments and impact disks and bars. For example, we can study how the cumulative effect of frequent weak galaxy encounters (‘harassment’; Moore et al. 1996), the effect of the intra-cluster medium (ICM) on galaxies (Gunn & Gott 1972; Larson et al. 1980; Quilis et al. 2000), and the influence of the cluster potential as a whole (e.g., Byrd & Valtonen 1990; Gnedin 2003) affect the properties of bars and disks. Theoretical studies exploring these processes give conflicting predictions. For example, although the numerous tidal encounters in a dense cluster core can induce bars in unbarred disks in the case of a prograde encounter, they can also have little or no effect in terms of inducing a bar (or affecting the strength of an already existing bar) in the case of retrograde encounters (Gerin, Combes, & Athanassoula 1990; Romano-Díaz et al. 2008; Aguerri & González-García 2009). Determining the fraction and properties of barred galaxies in such extreme environments and comparing them to those of galaxies in environments of varying densities, can give clues to the outstanding problems in understanding the formation and growth of bar instabilities in disks, and therefore to understanding disk evolution. In addition, identifying barred disks in cluster environments can provide a lower limit to the fraction of disk systems in clusters (e.g., M09; Méndez-Abreu et al. 2010).
Quantitative results addressing this issue are only starting to emerge. Several recent studies of non-dwarf galaxies at a range of redshifts from (Barazza et al. 2009; Aguerri et al. 2009; M09), find that the optical bar fraction shows at most a modest variation () between field and intermediate density environments (e.g., moderately rich clusters). But what happens at really high densities (i.e., dense cluster cores)? Some studies (Thompson 1981; Andersen 1996; Barazza et al. 2009) have suggested that, within a galaxy cluster, the bar fraction may be higher in the dense core regions than the outskirts. However, this has remained an open question for cluster cores due to issues such as limited number statistics, projection effects, poor quality or inhomogeneous data, and uncertainties in cluster membership. We make progress in two ways with this study. Firstly, we are able to establish cluster membership for all galaxies in our bright S0 sample (see ) using spectroscopic redshifts. Although we are still limited by line-of-sight projection effects from within the Coma cluster itself, the number density of galaxies in the core of Coma is a factor of 10-100 times higher than at larger cluster radii, so we expect the impact of such line-of-sight contamination to be low. Secondly, the high-resolution ACS data is vital in identifying bars in S0s, especially in the types of cases we discuss in Section 3.2.2, namely, where a relatively large bulge, in combination with a relatively short bar and projection effects combine to make bar detection difficult in low-resolution ground-based images.
In this paper, we provide baseline results for the densest environment in the local Universe: the central regions of Coma. We conduct two explorations using two different samples. In the first part of this paper ( 3), we focus on the sample of bright () non-dwarf S0 galaxies, which comprise 94% of our sample of bright disk galaxies in the Coma core. We characterize their disk and bar properties and present results on the optical bar fraction for bright S0 galaxies from ellipse fitting and visual classification. We compare with the results of other studies of S0 galaxies in Coma, and less dense clusters (Abell 901/902 and Virgo).
In the second part of this paper ( 4), we take advantage of the exquisite 50 pc resolution of the ACS images to search for bars and other disk features (spiral arms, inclined disks) in the faint, dwarf () galaxies of the Coma cluster core. The prevalence or paucity of bar structures in early-type dwarf galaxies can not only provide clues on the evolutionary history of these dwarf systems, but also has implications for the conditions necessary for bar formation and growth in galaxies. Are bar/spiral arm instabilities commonplace for dwarf galaxies? Some early-type dwarfs in clusters are believed to have originated from late-type spirals or dwarf irregulars (e.g., Lin & Faber 1983; Kormendy 1985) that have been stripped of their gas by external processes. This is especially true in a cluster setting where environmental processes like ram-pressure stripping and harassment are commonplace. If the progenitor galaxy hosted a stellar bar or spiral arms, these stellar features can persist even after the galaxy’s gas has been processed by the cluster environment. In fact, a number of early-type dwarf galaxies in Virgo have been observed to host stellar disk features such as a lens, a bar, or spiral arms (e.g., Sandage & Binggeli 1984; Binggeli & Cameron 1991; Jerjen et al. 2000; Barazza et al. 2002; Lisker et al. 2006; Lisker et al. 2007; Lisker & Fuchs 2009) thus supporting the above scenario. Graham et al. (2003) discovered the first two early-type dwarf galaxies with spiral-like structure in the Coma cluster using unsharp masking, concluding that such galaxies may provide the ‘missing link’ in the evolution of faint spiral galaxies into dwarf spheroidals due to cluster processes.
The layout of this paper is as follows: In 2 we describe our dataset and sample selection. Section 3 deals with our bright () Coma core sample. In this section we outline our methods for identifying bright S0 galaxies ( 3.1), our methods for identifying bars in these galaxies ( 3.2 and 3.3), our results for S0 galaxies in the Coma core ( 3.4– 3.7), and the implications of these results for bar and disk formation and evolution in dense environments ( 3.8). In 4, we present our investigation of the faint, dwarf galaxies in our Coma core sample. We describe our methods for finding disk features (bar, spiral arms, inclined disk) in these galaxies ( 4.2), as well as our results and discussion for dwarf galaxies in 4.3. We summarize all of our results in 5.
2 Data and Selection of a Cluster Sample
Our data come from the Hubble Space Telescope () Advanced Camera for Surveys (ACS) Treasury survey of the Coma cluster at 0.023 (Carter et al. 2008). Originally designed to cover a large area of the core and infall region of Coma, the survey remains only 28% complete because of the failure of ACS in 2007. Nevertheless, the available data span 274 arcmin2, where approximately 75% of the data are within 0.5 Mpc of the cluster center. The data cover approximately 70% of the core region of Coma (assuming 0.2 Mpc) and are therefore representative of the core and the immediate surroundings, namely the region where the galaxy number density is 10,000 galaxies Mpc-3 before it drops sharply as a function of distance from the cluster center (The & White 1986). This dataset contains thousands of sources down to a limiting magnitude of 26.8 mag in F814W (AB mag). The ACS point-spread function (PSF) is , which corresponds to 50 pc at the distance of the Coma cluster, assuming a distance of Mpc.111We assume in this paper a flat cosmology with and =70 km s-1 Mpc-1.. source catalogs are available as a part of the Coma survey data releases. The second data release (DR2) is described in detail in Hammer et al. (2010). Throughout the paper, as well as SDSS and magnitudes are given in the AB system, while and magnitudes are in the Vega system.
We first use the eyeball catalog of Trentham et al. (in preparation) to select cluster members. In this catalog, galaxies are visually assigned a cluster membership class from 0 to 4. Galaxies with membership class 0 are spectroscopically confirmed members, while galaxies with class 4 are visually deemed to be likely background objects. The intermediate membership classes from 1 (very probable cluster member) to 3 (plausible cluster member), are assigned based on a visual estimation taking into account both surface brightness and morphology (Trentham et al. in prep). We select objects with apparent magnitude 24 (AB mag) and membership class 0 to 3, resulting in a sample of 469 cluster galaxies. For these galaxies, 41% are spectroscopically confirmed members (class 0), while 7%, 27%, and 25% have membership classes 1 to 3, respectively.
We derive and magnitudes (in Vega mag) for the Coma galaxies using SDSS and (in AB mag). For the bright sample, we use the , , , and magnitudes (instead of the ACS F814W) for ease of comparison to other studies. In addition, Hammer et al. (2010) find that for bright galaxies ( AB mag) in the Coma survey, it is more reliable to use the SDSS rather than ACS magnitudes, as the latter may be unreliable for some galaxies with large, diffuse stellar halos. We use the following transformations from Jester et al. (2005) to convert the SDSS and (AB) to and (Vega)222The transformation equation tables can be found at http://www.sdss.org/dr7/algorithms/sdssUBVRITransform.html:
| (1) |
| (2) |
We calculate absolute magnitudes assuming a distance modulus of 35.0 (Carter et al. 2008).
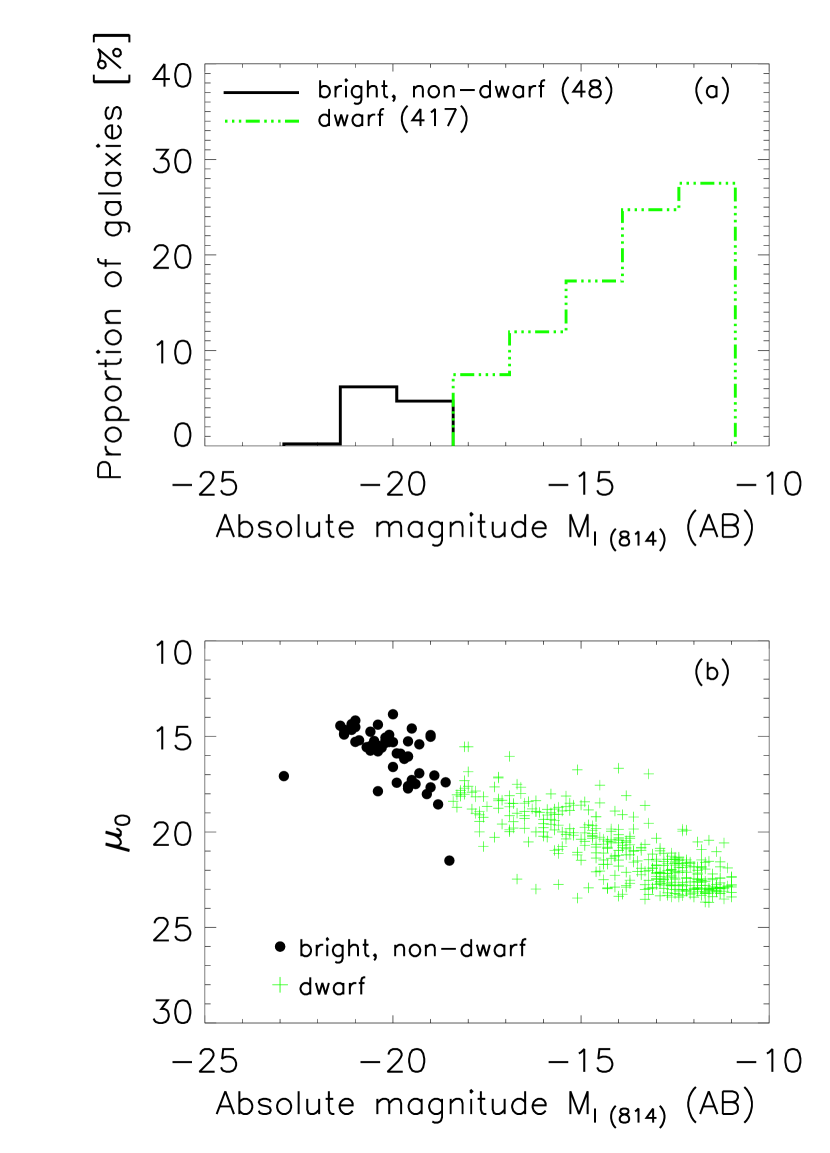
In this paper, we explore the optical bar fraction in two regimes: bright, non-dwarf S0 disks ( 3) and faint (dwarf) galaxies ( 4). To separate these two regimes, we apply a magnitude cut of , roughly equivalent to or for our sample. We choose a cut at because it tends to separate well the regimes where normal and dwarf galaxies dominate on the luminosity functions of clusters (Binggeli et al. 1988; Trentham 1988; Trentham & Hodgkin 2002; Mobasher et al. 2003). Luminosity cuts at magnitudes are often used to separate dwarf and non-dwarf galaxies in the literature (Matković & Guzmán 2005; Aguerri et al. 2005; van Zee 2001; Barazza et al. 2006). This cut gives 52 galaxies brighter than, and 417 galaxies fainter than . From the 52 bright galaxies, we discard four galaxies (two are a close/merging pair and two galaxies are partially off the edge of a tile) bringing our initial bright sample to 48 galaxies. We discuss the methods for selecting S0 galaxies from this bright sample in 3.1.
3 Bars in bright S0 galaxies in the central region of the Coma cluster
3.1 Identifying Bright S0 Galaxies
Due to the fact that bars are inherently a disk phenomenon, the bar fraction is traditionally defined as
| (3) |
where and represent the number of barred and unbarred disk galaxies, respectively. Therefore, from the bright sample of 48 galaxies, we need a sample of disk galaxies (e.g., S0–Im) for analysis. As discussed in 1, recent work has shown that a bar fraction averaged over a wide range in Hubble types gives only limited information. The bar fraction is a strong function of galaxy properties, such as , luminosity, stellar mass, and color. Because our sample is too small to split into fine bins by morphological type, and because most (94%) of bright disk galaxies in our Coma core sample are S0s (see below), our analysis of bright galaxies in this paper focuses on S0s only. The goal of our study is to provide the bar fraction for the densest low redshift ( 0.02) environment and to serve as a comparison point for studies of barred S0 galaxies in field and intermediate-density environments at different redshifts.
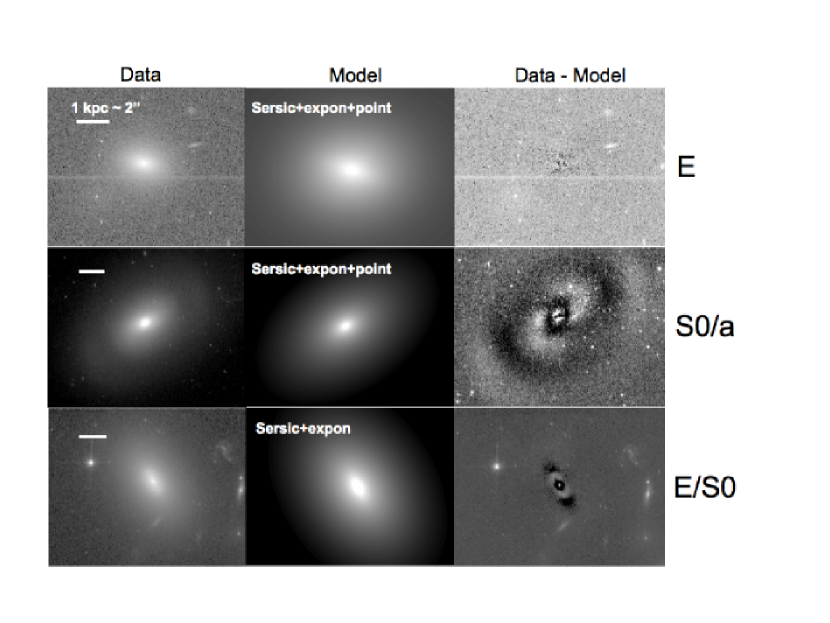
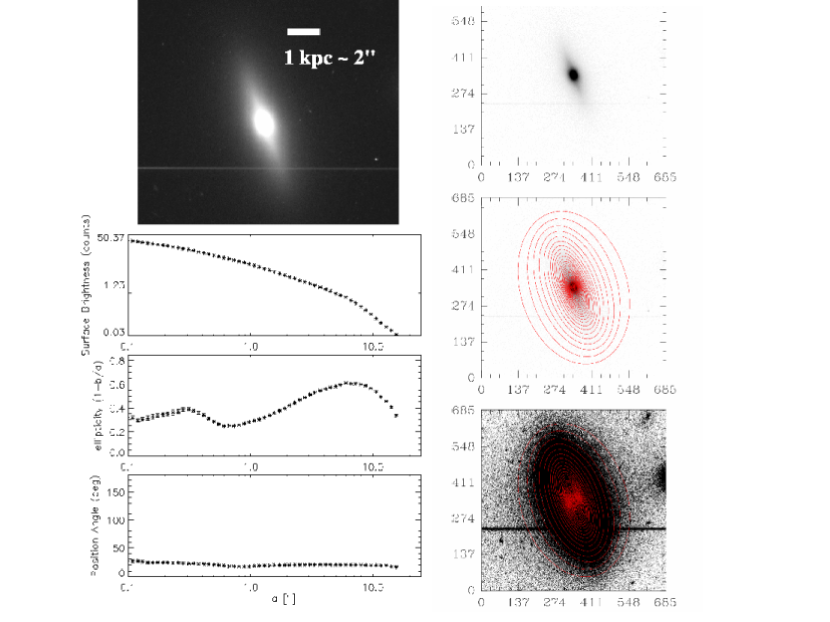
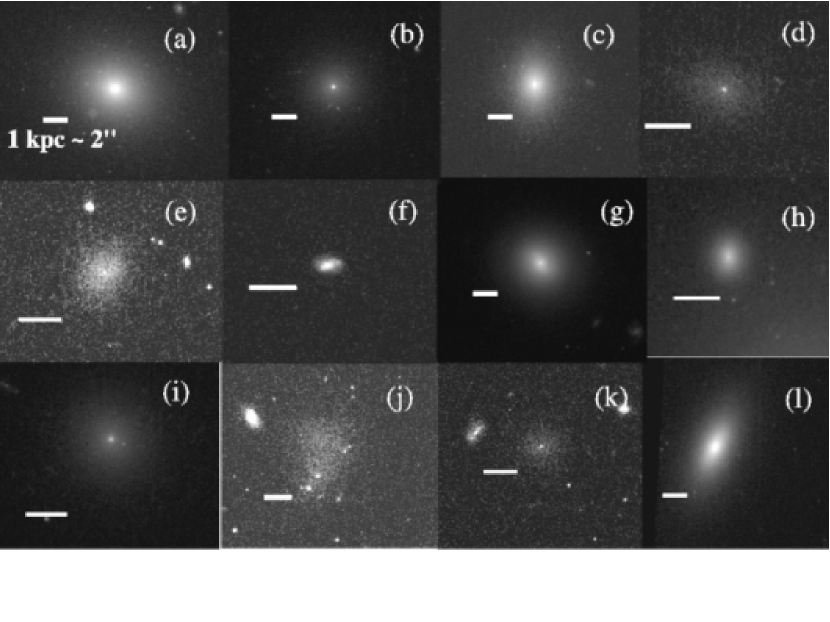
Starting with the bright sample of 48 galaxies, we use visual classification to separate the galaxies into ellipticals, S0s, visually ambiguous E/S0, and spirals. We note that our visually-identified class of ‘S0’ galaxies includes all Hubble type S0 sub-types from S0- to S0/a (numerical T-types -3 to 0). It is fairly easy to separate S0s and ellipticals visually when the S0s host bars. However, unbarred S0s are harder to separate from ellipticals since an unbarred S0 hosts a disk, which is effectively featureless and devoid of tell-tale disk signatures, such as a bar or spiral arms. We find a group of 10 bright galaxies that are visually ambiguous E/S0s. For each of these 10 galaxies, we perform multiple component structural decomposition with the GALFIT code (Peng et al. 2002) by fitting the two-dimensional (2D) light distribution taking into account the PSF, following the procedure described in Weinzirl et al. (2009). In brief, we fitted each galaxy with three models: a single-component Sérsic model, a two-component (‘bulge’+disk) model, and a three component (‘bulge’+disk+bar) model. The disk is represented by an exponential (Sérsic ) model, while the ‘bulge’ is a Sérsic model with a free-floating Sérsic index . The bar is typically associated with a Sérsic model of low . If needed, a point source component was added to represent the point sources, which are common in the center of these galaxies. For each model, GALFIT finds the optimum solution using the Levenberg-Marquardt algorithm. The goodness of fit is determined iteratively by calculating . GALFIT continues to adjust the model parameters until the gradient is very small (e.g., 10-4) for 10 continuous iterations. Out of the three models (Sérsic, ‘bulge’+disk, ‘bulge’+disk+bar), the best one was selected by considering a number of factors, including the values, the strength and spatial distribution of the residuals, and the physical viability of output parameters (e.g., effective radii of the Sérsic and bulge component; scale length, axial ratio, and position angle of the disk). These factors were used to decide whether the galaxy is likely an elliptical or an S0. Examples of the data, model, and residuals for three representative galaxies classified as E, S0/a, and E/S0 after decomposition are shown in Figure 2.
Out of the 10 visually ambiguous E/S0 galaxies, we find from multi-component decompositions that one is an elliptical, eight are S0 or S0/a, and one is still ambiguous E/S0. The ambiguous galaxy may be a disk galaxy with complex structure or an elliptical with an inner debris disk. In 3.4 we use this galaxy to estimate the uncertainty in the optical bar fraction by calculating (see Equation 1) for the two cases where this galaxy is either included or excluded in the number of unbarred disks ().
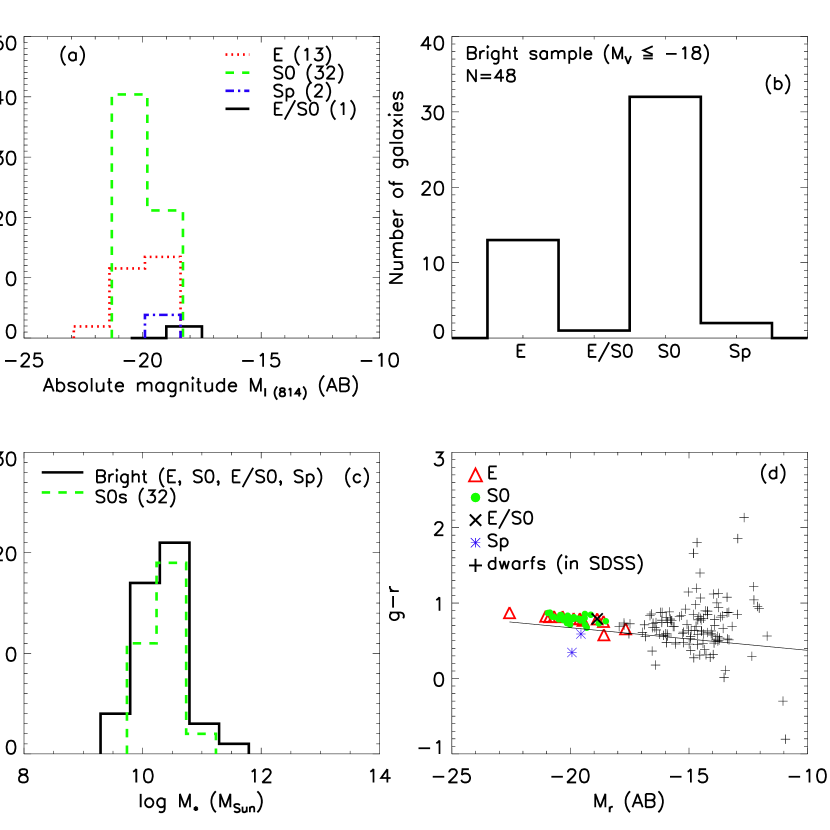
The absolute magnitude distribution of the bright Coma core sample is shown in Fig. 3a. The final morphological breakdown of our bright sample (13 ellipticals, 1 ambiguous E/S0, 32 S0s, and 2 spirals) is shown in Fig 3b. It is clear that S0s dominate among the bright disk galaxies in our Coma core sample, which is expected for the central regions of a dense cluster. We find a ratio of E : S0 : Sp of 28% : 68% : 4%. This is at the extreme end of the morphology-density relation found in dense environments by Dressler (1980). Fig. 3c shows the distribution of stellar mass for the S0 disk sample as well as all bright () galaxies. Stellar masses are calculated using the relations from Borch et al. (2006)333The Kroupa IMF offset term is reported as -0.15 in Bell et al. (2003). However this value was calculated assuming unrealistic conditions (Bell, E., private communication). The correct value of -0.1 was recalculated and reported in Borch et al. (2006). assuming a Kroupa et al. (1993) initial mass function:
| (4) |
where
| (5) |
Galaxies in our S0 disk sample have stellar masses between 109.5 and 10. Fig. 3d shows a color vs. magnitude diagram. Almost all ellipticals and most disk galaxies fall on the red sequence. We overplot the relation from Blanton et al. (2005a) for the break between the red sequence and blue cloud using the equation (modified with an offset of -0.77 for )
| (6) |
We also plot a subsample of the dwarf galaxies () for which SDSS data are available ( 30%).
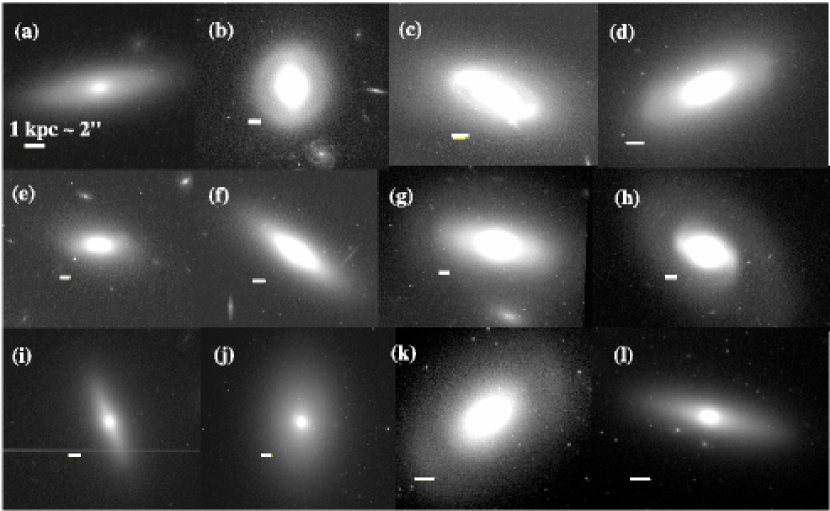
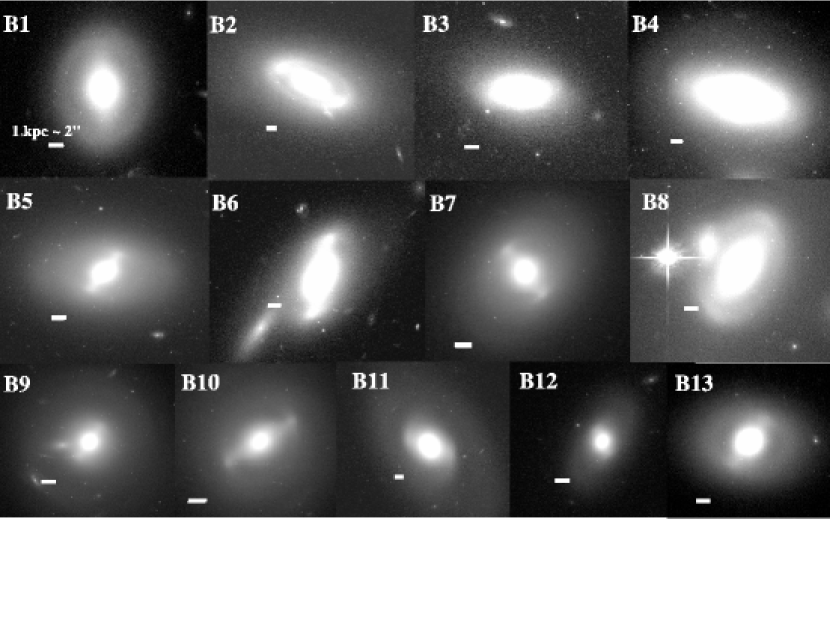
We show examples from our final bright S0 sample of 32 galaxies in Figure 4. We note that all 32 S0s in the bright sample are spectroscopically confirmed cluster members.
3.2 Identification of bars in S0s via ellipse fits
Ellipse fitting is our primary method of detecting bars in the bright S0 sample (e.g., Wozniak et al. 1995, Friedli et al. 1996; Regan et al. 1997; Mulchaey & Regan 1997; Jogee et al. 1999, 2002, 2004; Knapen et al. 2000; Laine et al. 2002; Sheth et al. 2003, 2008; Elmegreen et al. 2004; Menéndez-Delmestre et al. 2007; MJ07; Aguerri et al. 2009). To detect bars through ellipse fitting we use the standard IRAF task in conjunction with an adaptive wrapper (Jogee et al. 2004), which runs iteratively on each galaxy until the best fit is found or up to a maximum number of times specified by the user. Ellipses are fit to the galaxy isophotes out to a maximum distance () where the brightness of the isophotes reaches the noise level. We note that the value of depends on the depth of the image, as will reach larger values for deeper images. However for the purpose of bar detection, it is only necessary for the radial profile to extend beyond the bar into the more circular region of the disk. We typically set the maximum allowed iterations to 300, however for most galaxies a good fit is achieved in only a few iterations. A good fit is one where an ellipse can be fitted at every isophote out to . Residuals characterizing how well each isophote is fitted by its corresponding ellipse are given by the harmonic amplitudes A3, B3, A4, and B4 (e.g., Carter 1978; Jedrzejewski 1987; Carter 1987). For our barred galaxies, we find typical amplitudes of 5–10%. For a detailed discussion on the advantages and drawbacks of using ellipse fitting to characterize bars we refer the reader to MJ07.
Once the galaxies are fitted, we use an interactive visualization tool to display the overlays of the fit on the galaxy image, as well as the radial profiles of surface brightness, ellipticity (), and position angle (PA). Using the radial profiles of ellipticity () and PA, we classify the galaxies as ‘highly inclined’, ‘barred’, or ‘unbarred’. We discuss these classes in more detail below.
3.2.1 Detecting and removing highly inclined galaxies
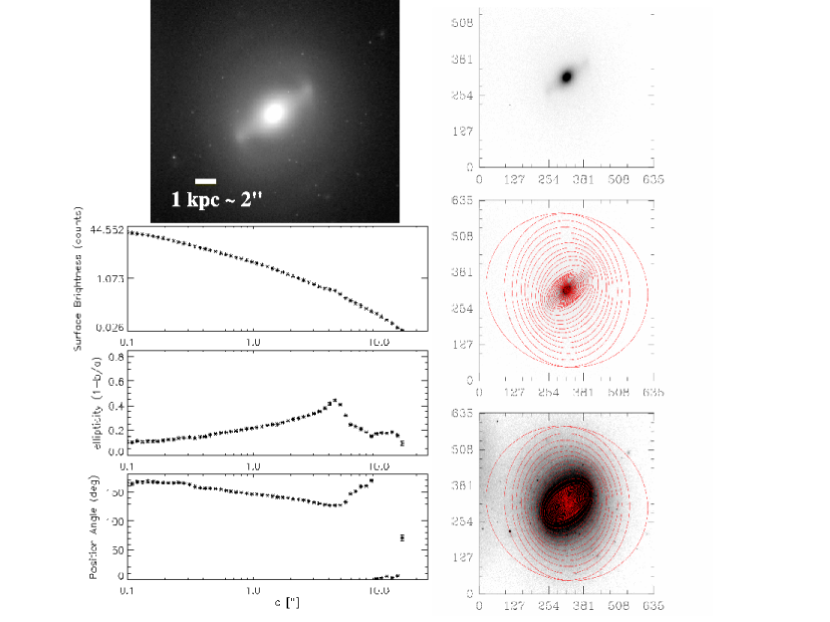
In studies of bars, it is conventional to exclude highly inclined galaxies as the large inclination precludes accurate structural classification, making it particularly difficult to identify systems as barred or unbarred. We use two ways to identify highly inclined galaxies in the bright S0 sample. The first is via the ellipse fit criteria, where the observed outermost disk isophote (at ) has , corresponding to . We find eight galaxies that fit this criterion. This method works well for spirals of intermediate to late Hubble types, but does not capture all highly inclined disks for S0s because for some edge-on or highly inclined S0s, a rounder, thickened outer stellar component can sometimes dilute the outermost isophote so that the outermost ellipticity is below 0.5 although the galaxy is highly inclined.
Therefore, our second method is to visually identify highly-inclined S0s. We visually identify these systems using the criteria that a thinner, high-surface brightness, highly-inclined disk appears embedded in a thick, diffuse stellar component, which could be a mix of thick disk, bulge, and bar stars. A typical example of one of these galaxies is shown in Fig. 5. We encounter four such cases, where the galaxy appears visually to be close to edge-on, and is classified as highly inclined. We distinguish these cases from a face-on galaxy with a bar because (1) the thin, highly-inclined disk and the thicker stellar component are always oriented along the same position angle, (2) the thick outer stellar component in these highly-inclined S0 galaxies appears much fainter and more diffuse than a face-on disk, and (3) in three out of these four galaxies, a box or X-shaped bulge is present, suggesting that the galaxy is seen edge-on (e.g., Athanassoula 2005). We therefore exclude from further analysis the 12 highly-inclined systems that we find in the sample.
3.2.2 Detecting barred galaxies
Traditionally, when ellipse fits are used to identify bars, a galaxy is classified as barred if the radial profiles of the ellipticity and PA fulfill the following requirements: (1) the rises to a global maximum, , while the PA remains relatively constant (within ), and (2) the drops by at least 0.1 and the PA changes by more than 10∘ at the transition between the bar and disk region. An example of a barred S0 galaxy in our sample that meets the traditional criteria is shown in Fig. 6.
These criteria will identify primary stellar bars in the vast majority of spirals, particularly those of intermediate to late Hubble types (Sb–Sm). However, they can marginally fail in some galaxies due to a rare set of circumstances, which we describe in detail below. These circumstances are particularly likely to occur in S0s with large bulge-to-disk ratios.
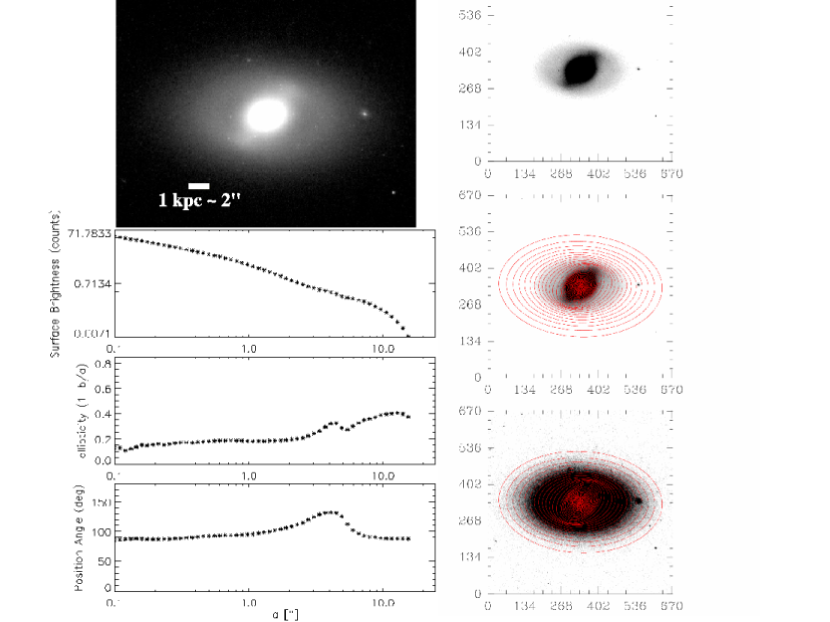
In some S0s, a combination of structural parameters and viewing angle causes the observed (i.e., not deprojected) maximum bar ellipticity (; typically measured from the isophote crossing the end of the bar) to become a local maximum of the ellipticity radial profile rather than the global maximum. In these rare cases, the ellipticity () of the outer disk becomes the global maximum in the radial profile of ellipticity. This can happen in the case of a barred galaxy, where all or most of the following conditions are satisfied: (i) The galaxy has a moderate to large inclination (e.g., ). This causes the outer circular disk of the galaxy to appear elongated along the line of nodes (LON) in the projected image of the galaxy on the sky, leading to a higher measured . (ii) A large fraction of the length of the bar lies within a fairly axisymmetric bulge, which is much more luminous than the bar. In this case, the bulge light dilutes the ellipticity of the bar by ‘circularizing’ the isophote crossing the bar end, thus causing , measured from this isophote to be significantly lower than the true ellipticity of the bar. (iii) The bar major axis has a large offset () with respect to the LON, such that projection effects make the disk appear more elongated, while the bar appears more round. The most extreme example occurs when the bar is perpendicular to the LON (i.e., ). Such situations can potentially cause the observed ellipticity of the disk to exceed that of the bar. Thus, a combination of factors (i) to (iii) can cause the measured to fall below so that is a local maximum in the radial profiles. In this case, the bar can still be identified through ellipse-fits if the traditional criterion that the measured maximum bar ellipticity must be a global maximum is relaxed, and a local maximum be deemed acceptable.
In the case of barred S0s, the conditions (i) to (iii) can be satisfied in a larger fraction of galaxies than for a sample of barred intermediate-to-late Hubble type (Sb–Sm) spirals due to the following reasons. Many barred cluster S0s host bulges that are bright, have large bulge-to-disk light ratios, and encompass a large fraction of the length of the bar. Indeed, among our sample of 20 moderately-inclined cluster S0s, we find three such cases and an example is shown in Fig. 7. For this reason, we quote two bar fractions derived through ellipse fits: the first bar fraction (), where we use the strict criteria (1) and (2) above, and the second bar fraction () where for galaxies satisfying (i) to (iii), we relax the criterion that the maximum bar ellipticity must be a global maximum (however we still require it to rise above ). We note that all bars identified with the strict ellipse-fitting criteria (‘ES’) are also picked up under the relaxed ellipse-fitting criteria (‘ER’). We further note that, for the galaxies where the bar is detected only through the relaxed criteria, if the radial profiles of the ellipticity and PA are deprojected ( 3.7), the bar ellipticity does become the global maximum. However, because many large studies of bars do not deproject the radial profiles (e.g., M09), we use the observed radial profiles to detect the bars as described above for ease of comparison.
3.3 Identification of bars in S0s via visual classification
In addition to ellipse fitting, we also present the optical bar fraction for bright S0s in Coma from visual classification performed by I.M., S.J., and P.E. This facilitates comparison to other work where bars are identified visually ( 3.5).
A galaxy is classified as ‘barred’ through visual classification if it has a significant elongated feature extending from the center of the disk with an axial ratio (estimated from the image with ) and a PA that differs from the PA of the outer disk by at least 10∘. A galaxy is classified as ‘unbarred’ if there is no elongated structure present that fits the above criteria.
All of the bright barred S0s we identify in the Coma sample through ellipse fitting and visual classification are listed in Table 1. The methods through which the bar is detected are shown in column (5).
3.4 Optical S0 bar fraction in the central region of the Coma cluster
The optical bar fractions for our sample of bright S0 galaxies in the Coma cluster core are presented in Table 2.
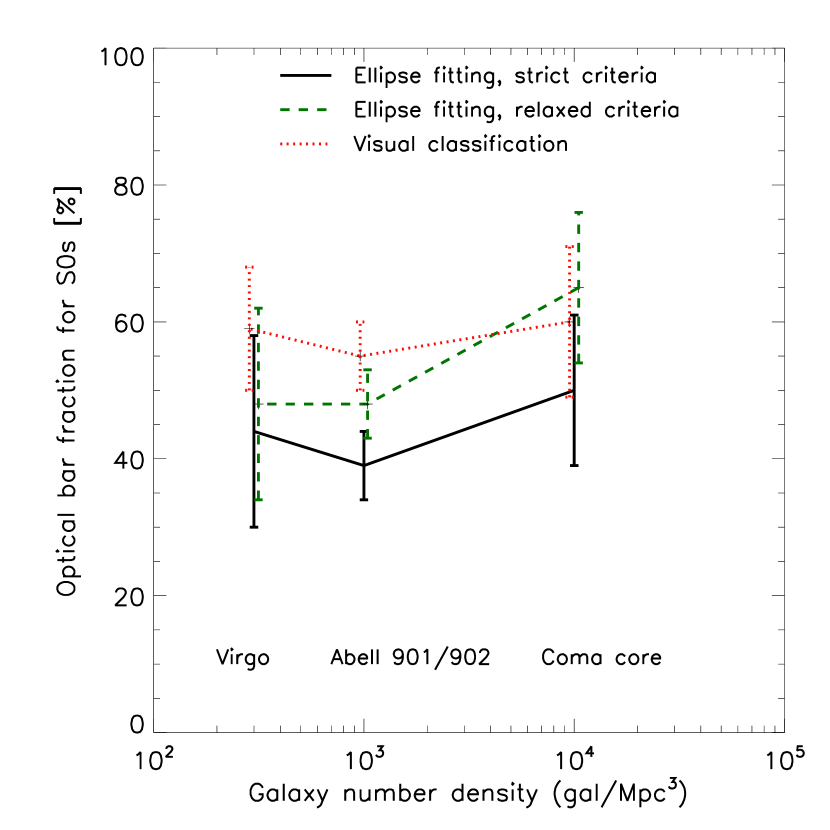
Using the strict ellipse fitting criteria ( 3.2.2), we find that the optical bar fraction for the bright S0s is 50 11% (10/20). Using the relaxed ellipse fitting criteria, we find 65 11% (13/20). Visual classification gives an optical bar fraction of 60 11% (12/20). All errors are binomial errors. The barred S0 galaxies identified through ellipse fitting and visual classification are shown in Fig. 8.
To correctly derive the bar fraction for S0s in clusters, we need to accurately estimate the number of unbarred S0s ( in Eq. 1). As S0s are devoid of typical disk features such as spiral arms, star-forming rings, etc., it is particularly challenging to visually identify all unbarred S0s and separate them from ellipticals. Therefore, in 3.1, we identified S0s through both visual classification and two-dimensional structural decomposition of the images into single-component Sérsic models, bulge+disk models, and bulge+disk+bar models. We found 13 Es, 32 S0s, and one E/S0 case, which still remains ambiguous even after decomposition. This ambiguous E/S0 case is not included in the optical bar fraction in Table 2. If it is included as an unbarred S0 in our analysis, the optical bar fractions fall to: 48 11%, 62 11%, and 57 11% from visual classification. We therefore estimate that the uncertainties associated with determining the number of unbarred S0s can lead us to overestimate the optical bar fraction by only a small factor of 1.05.
We note that in the field, the bar fraction is lower in the optical than in the NIR by factor of 1.3 (Eskridge et al. 2000; M07) for intermediate (Sab–Sc) Hubble types due to obscuration by gas, dust, and star formation. However in S0s, where there is little gas and dust on large scales, we don’t expect the difference between the optical and NIR bar fractions to be significant.
3.5 S0 bar fraction across different environments
Due to the fact that different bar detection methods can yield different bar fraction results, it is important to compare studies using the same methods for consistency. In addition, as discussed in 1, the bar fraction depends on host galaxy properties such as Hubble type or (Odewahn 1996; BJM08; Aguerri et al. 2009; M09; Weinzirl et al. 2009; Laurikainen et al. 2009), luminosity (Barazza et al. 2009; M09), stellar mass, and color (Nair & Abraham 2010a; Cameron et al. 2010). Therefore we use comparison samples that are matched as well as possible to our Coma sample in Hubble type (S0s), luminosity (), color, and method of bar detection. We compare our results for S0s to those of other studies in Coma and lower-density clusters (Abell 901/902 and Virgo).
First, we compare to another study in the very dense environment of the central regions of the Coma cluster (galaxy number density 10,000 galaxies/Mpc3) by T81. T81 uses visual classification on ground-based Kitt Peak National Observatory (KPNO) plates to detect bars in S0s brighter than (very similar to our magnitude cutoff of ). Therefore we compare his result to our optical bar fraction from visual classification ( 3.3). Table 3 shows that our optical bar fraction from visual classification for S0s (6011%) in the Coma core is higher than the result (427%) that T81 obtained after correcting raw galaxy counts for projection effects444This correction is used by T81 to account for the effects of foreground and background objects contaminating the cluster field in the absence of spectroscopic data. Since all bright S0s in our Coma core sample are spectroscopically-confirmed cluster members, we compare to the corrected bar fraction from T81.. A clue to the reason for this difference comes from our finding that in many S0s in our sample, the bar ellipticity and its overall signature are diluted because the bulge is bright compared to the bar and it is large enough to encompass a large fraction of the bar length. In such cases, as discussed in section 3.2.2, the bar is harder to detect via any method, be it visual classification or ellipse fits, unless the image is of high quality and the classifier has significant expertise. In the case of T81, the visual classification was performed on ground-based optical plates, which are of lower quality than CCD images, making it even more difficult to detect such diluted or/and short bars. It is not possible to directly compare our case-by-case results with T81, as he does not publish the list of galaxies he classifies as barred and does not provide the lengths and ellipticities of the bars. However, we perform two indirect tests to gauge the impact of missing diluted, weak, and/or short bars. In our sample, seven of the 13 barred S0s have an observed peak bar ellipticity (Fig. 12). If all of these galaxies were classified as unbarred, the bar fraction would drop to 30%. Alternatively, if the shorter ( kpc) bars are excluded, the bar fraction would drop to 45%. These tests suggest that it is likely that the lower optical bar fraction of T81 is due to his missing some of these diluted or/and short bars.
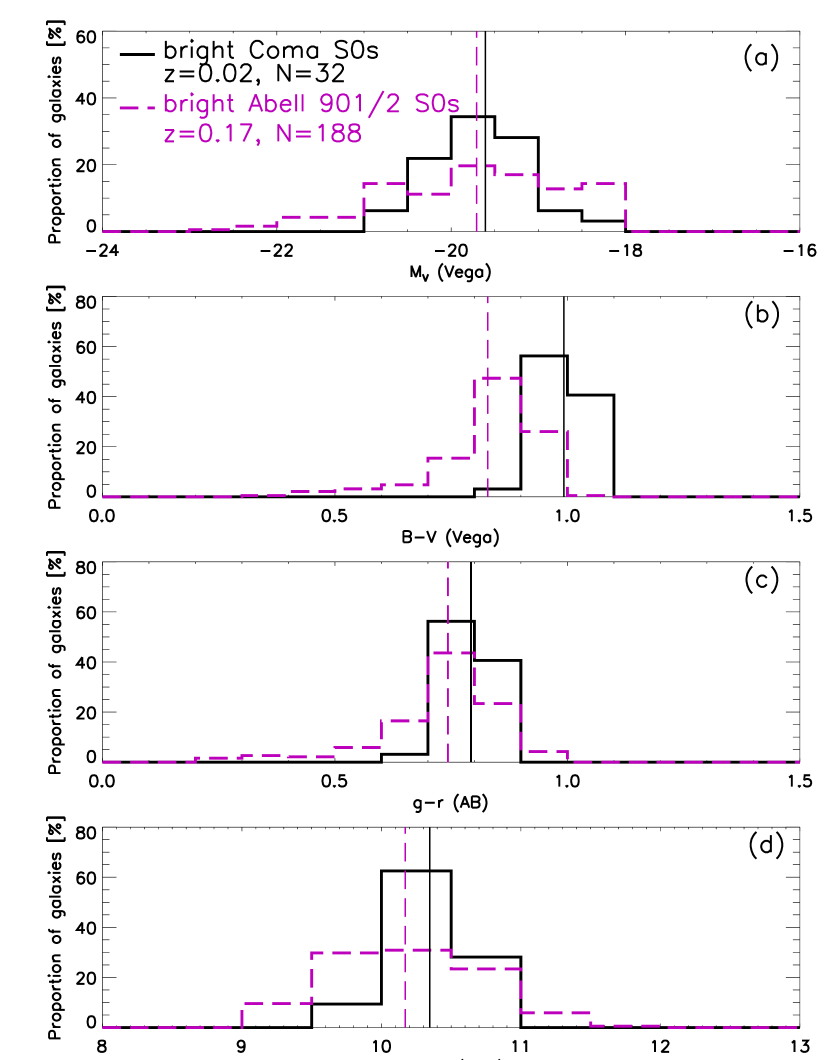
For a comparison to intermediate-density cluster environments, we use the study of M09 for the Abell 901/902 cluster system ( 0.165; 1000 galaxies/Mpc3, see Table 5 in Heiderman et al. 2009). To match our sample, we pick S0 galaxies from the M09 study with , using classifications performed by the members of the STAGES collaboration for the Abell 901/902 cluster system (Gray et al. 2009; see Wolf et al. 2009 for more details). In M09, inclined galaxies were picked as those with outer disk ellipticity , as traditionally done in bar studies using ellipse fitting. However, since we are only focusing on S0 galaxies (which sometimes have large bulges/diffuse, thick stellar components that can dilute the below 0.5 even for edge-on S0s, as discussed in 3.2.1) we apply the same additional visual criteria outlined in 3.2.1 to the M09 S0 sample to detect and remove highly inclined S0s.
Figure 9 shows the host galaxy properties of the Abell 901/902 and Coma S0 samples. The two samples are well-matched in the mean luminosity, color, and stellar mass. However, the results of a Kolmogorov-Smirnov (KS) test show differences in the overall distributions of color and stellar mass (KS (, ) and (0.005, 0.3), respectively), and are inconclusive for the distributions of (KS (, )). This is likely due to the fact that the Abell 901/902 sample has a tail of galaxies with masses both lower and higher than the Coma core sample, translating, respectively, into a tail of bluer colors and brighter absolute magnitudes. Oddly, there appears to be a significantly larger offset between the Abell 901/902 cluster and the Coma core if one uses the color (Figure 9b) rather than the color (Figure 9c): Abell 901/902 S0s appear 0.2 mag bluer in color compared to the Coma core, and the KS test suggests a large difference (KS (, )). However, we believe that this color offset is not real and is caused by the fact that the color transformations derived by Jester et al. (2005) for stars may not be adequate for S0s.
In M09 bars were detected on optical ( ACS F606W) images via the strict ellipse-fitting criteria only. We therefore also derive the bar fraction through visual classification and using the ‘relaxed’ ellipse-fitting criteria for the S0s in the M09 sub-sample in order to derive the corresponding bar fractions for comparison to Coma S0s. As shown in Table 3, we find no statistically significant difference in the S0 bar fraction in Abell 901/902 and Coma clusters when detecting bars through visual classification, strict ellipse fit criteria, or relaxed ellipse fit criteria. For instance, from visual classification (Table 3, bottom section), the Coma bar fraction (6011%) is slightly higher than the A901/902 bar fraction (555%), but the difference is not statistically significant as the values are consistent within the error bars. Similarly, via the relaxed ellipse fitting criteria (Table 3, middle section), the Coma bar fraction is 6511%, while the A901/902 bar fraction is 485%, (barely) consistent within the error bars. A comparison of the bar and disk properties (such as and ) in Coma and the Abell 901/902 cluster system is discussed in 3.7.
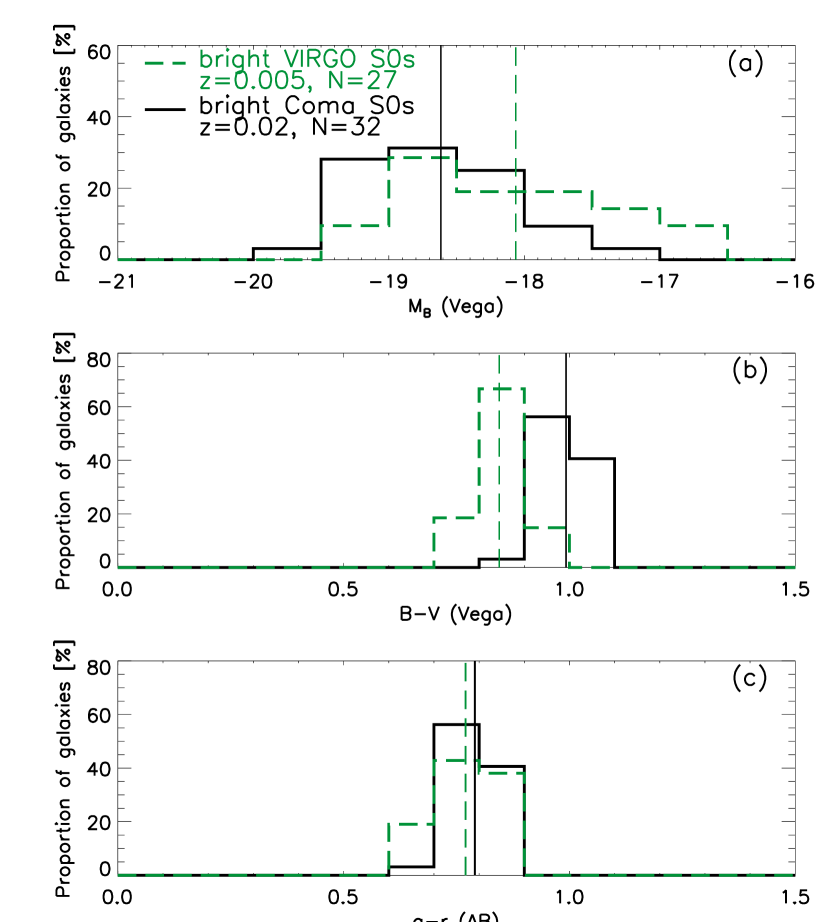
Next, we compare to results in Virgo from Erwin et al. (in preparation; E11). Virgo is the most nearby cluster ( 20 Mpc, 0.005) and is representative of a low-density cluster environment ( 300 galaxies/Mpc3 in the core region). We note however, that different environmental tracers paint different pictures in Virgo. While the number density ( 300 galaxies/Mpc3) is lower than that of Abell 901/902 ( 1000 galaxies/Mpc3) or the Coma core ( 10,000 galaxies/Mpc3), the velocity dispersions in Virgo can be as high as 750 km/s (Binggeli et al. 1987), comparable to those seen in Abell 901/902 and much higher than in groups ( 100 km/s; Tago et al. 2008). These properties are relevant for the discussion of our results in 3.8. Our Virgo comparison sample consists of S0 galaxies brighter than from E11. Fig. 10c shows that the two samples agree well in color (KS ()), but Fig. 10b shows that the colors of the Virgo S0s are significantly bluer (by 0.15 mag, on average, and with KS values of (, )). We believe that this color offset between Coma and Virgo is not real since the measured colors for the two samples agree well. We again think this offset is likely caused by the possibility that the color transformations derived by Jester et al. (2005) for stars may not be adequate for S0s. We compare optical bar fractions derived with all three methods: strict ellipse fitting criteria (ES), relaxed ellipse fitting criteria (ER), and visual classification performed by P.E., I.M., and S.J. according to the criteria outlined in 3.3. Again, we do not find a statistically significant difference in the optical bar fraction (within the errors) for S0s in the Coma core and those in Virgo using any of the three bar-detection methods above (see Table 3)555We note that Giordano et al. 2010 quote a much lower bar fraction ( 30%) using visual classification for Virgo S0 galaxies. This lower value is likely due to the fact that Giordano et al. 2010 include much fainter galaxies (down to ), use a higher inclination cutoff (), and a different method for selecting cluster members..
A graphical representation of the trend of the bar fraction for S0s as a function of environment density is shown in Fig. 11. We note that Fig. 11 shows a hint of an increase in the mean bar fraction toward the dense core of the Coma cluster, however given the error bars, we cannot say whether this trend is significant. A comparison of the bar and disk properties, for S0s in Coma and the Virgo cluster is discussed in 3.7.
We note that to compare to the lowest-density environments (i.e., field galaxies), we would ideally like to have a comparison sample where bar detection is done quantitatively via ellipse fits, and where the sample is matched to ours in both Hubble type (S0 galaxies), luminosity (), and color. However, there is as of yet no field comparison sample that fulfills all of the above requirements. The two large ellipse fit bar studies of field galaxies (BJM08 and Aguerri et al. 2009) are not adequate because they are mismatched in Hubble type and color (BJM08) or luminosity (Aguerri et al. 2009). Therefore, a comparison with these samples could be misleading, in light of recent results showing that the bar fraction varies non-monotonically with Hubble type, host galaxy luminosity, and color (Nair & Abraham 2010a). A comparison of the bar fraction derived through visual classification to a matched subset of S0s from the RC3 is complex, because RC3 galaxies are a mix of field and Virgo cluster members. The best candidate for a field comparison is the recently released public catalog by Nair & Abraham 2010b, containing visual morphologies for 14,000 SDSS galaxies. However, such a study is beyond the scope of this paper and therefore we defer this comparison to a later work.
Recently Méndez-Abreu et al. (2010) used the Coma Treasury survey data to analyze the properties of barred galaxies in the Coma cluster (using visual classification to detect bars). They do not select a disk sample but look for bars in all galaxies (including ellipticals and dwarfs). It is problematic and unconventional to quote the bar fraction from a sample of disk galaxies and ellipticals, particularly in the context of studying the bar fraction as a function of environment, as variations in this bar fraction can then be caused by the fact that the proportion of ellipticals to S0s to spirals changes strongly as a function of environment. For this reason, our study and other studies quote the bar fraction as the fraction of disk galaxies hosting bars. Comparison of our work with the results of Méndez-Abreu et al. (2010) is therefore not straightforward, but nonetheless we attempt a comparison to check whether our findings are consistent. If we include all galaxies from our sample in the magnitude range , to match their sample, we find a total (visual) bar fraction of 72% (14/188), while Méndez-Abreu et al. (2010) find 9% (secure bars) and 14% (weak/uncertain bars). Although our results are broadly consistent within the uncertainties, there are several further caveats to this comparison. Méndez-Abreu et al. (2010) apply the axial ratio constraint to their whole sample, regardless of morphology, while we only apply an inclination cutoff to our bright disk galaxies. In addition to the inclination cutoff, we also exclude S0 galaxies deemed to be highly-inclined/edge-on by eye, since as discussed in 3.2.1, using only the cut misses highly-inclined and edge-on S0s with a more circular, thickened stellar component. Furthermore, in the process of selecting cluster members, Méndez-Abreu et al. (2010) apply a color cut where they discard all galaxies that have color greater than 0.2 above their fit to the cluster red sequence.
3.6 Observed and deprojected properties
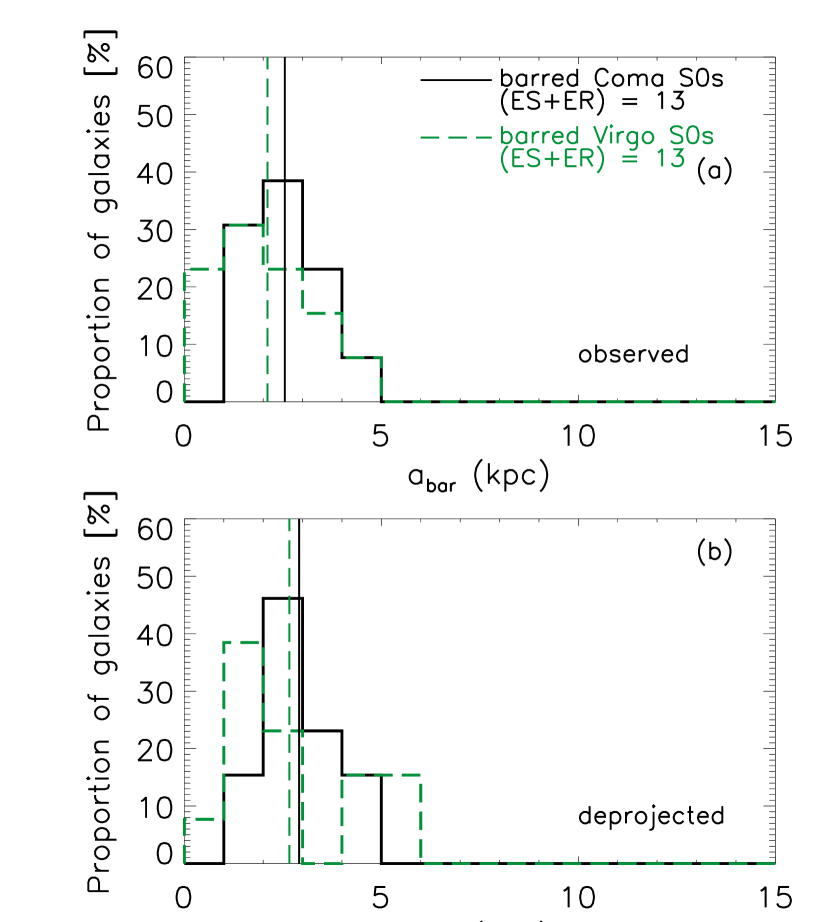
In Figure 12 we show the observed (solid line) and deprojected (dotted line) distributions of the bar semi-major axis () and bar ellipticity () for the 13 barred S0 galaxies detected through ellipse fitting (using both strict and relaxed criteria). In MJ07, we found that deprojecting the bar semi-major axis and ellipticity for a large sample makes only a very small statistical difference (a factor of 1.2), on average. However, since our Coma core sample is small, we deproject the observed radial profiles of ellipticity and PA and derive deprojected values of and . We perform the deprojection using a code developed by Laine et al. (2002) and used previously in Laine et al. (2002), Jogee et al. (2002a,b), and MJ07.
We find an observed mean bar size of 2.51 kpc (2.91 kpc deprojected; Fig. 13) and the mean observed and deprojected bar ellipticity is 0.40.1. It is evident that deprojection does not make a large difference in the mean and . The observed and deprojected values of and of the three bars detected through the relaxed criteria only are shown as filled and open circles, respectively in Fig. 12. These galaxies satisfy the relaxed ellipse fit criteria, where the peak ellipticity of the bar is a local and not a global maximum due to the combination of factors discussed in 3.2.2. After deprojection removes the projection effects, which cause the ellipticity of the disk to be artificially boosted compared to the bar ellipticity, the peak bar ellipticity then becomes a global maximum in these three galaxies. Thus, after deprojection, these three barred galaxies also pass the strict ellipse fit criteria. The observed and deprojected for these galaxies are shorter than average. We note, however, that the bars of the three galaxies that failed to meet the strict ellipse fit criteria before deprojection are not necessarily weak bars. The intrinsic ellipticities of these three bars after deprojection are similar to the mean value of the whole sample (0.40.1). This can be understood from the combination of factors discussed in 3.2.2, particularly the relative orientation of the bar with respect to the LON and projection effects.
Fig. 13 shows that the mean observed and deprojected bar lengths () in our bright S0 Coma core sample are similar to those of S0s in the Virgo cluster (E11). The results from a KS test are consistent with similar distributions (giving KS () and (0.2, 0.4) for panels (a) and (b) of Fig 13, respectively). We explore the comparison of the bar and disk properties as a function of environment density in more detail below.
3.7 Properties of disks and bars in the Coma core
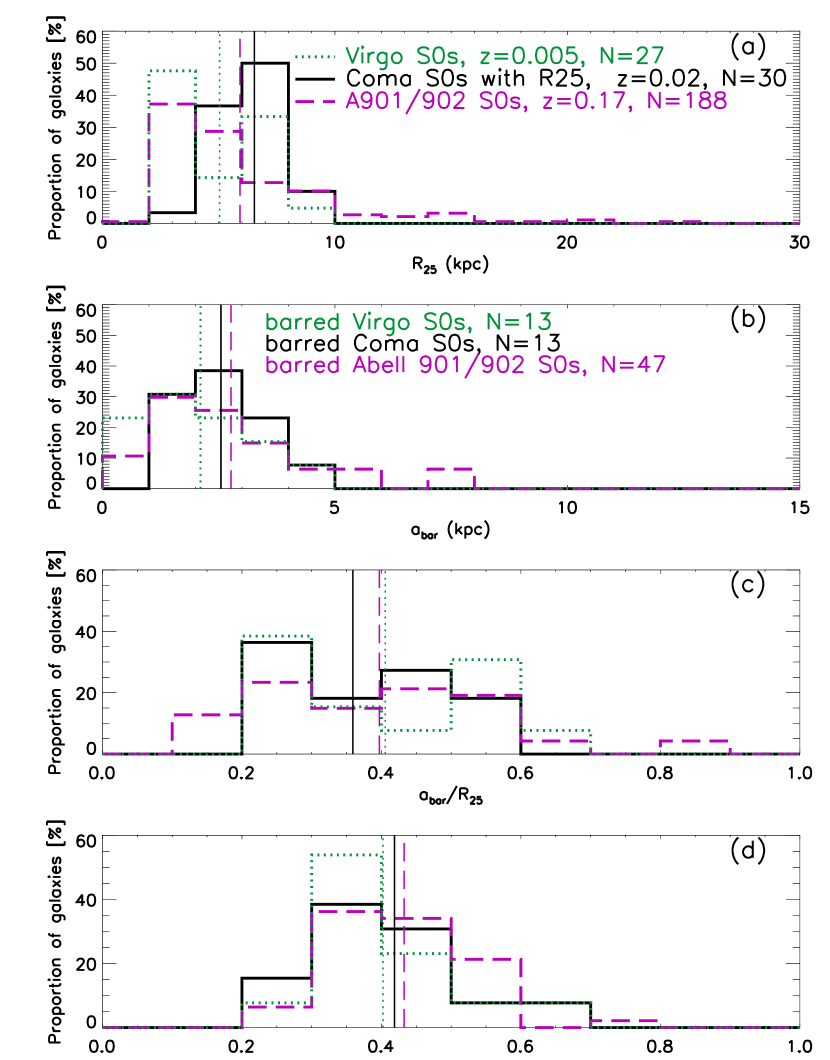
We compare our sample of Coma cluster core S0s to the properties of S0s in less dense environments, namely to those in the intermediate-density Abell 901/902 cluster system ( 0.165; M09) and those in the low density Virgo cluster ( 0.005; E11).
Figure 14 shows the distributions of (a) the galaxy disk (the isophotal radius where reaches 25 mag arcsec-2), (b) bar semi-major axis , measured at the peak bar ellipticity for all bars identified through ellipse fitting (ER+ES), (c) the / ratio, and (d) peak bar ellipticity for the Coma, Abell 901/902, and Virgo (E11) S0 samples. values for the E11 Virgo sample are from the RC3. for the Coma sample is estimated by ellipse fitting the galaxies on the ACS F475W images, which approximately correspond to SDSS band. We calibrate the radial profiles of surface brightness to mag/arcsec2, then convert them from band (AB) to mag arcsec-2 (Vega) using Equation 2. For two galaxies, we could not measure radius because a good fit could not be obtained of the outer disk of the galaxy due to the presence of a close companion. For the M09 Abell 901/902 sample, is calculated from the absolute magnitudes according to
| (7) |
from Schneider (2006). This formula is derived from an empirical relation measured for local spirals. To double-check its validity, we use it to calculate radii for the Virgo S0s, where we already know from RC3. Comparing the calculated values with those from RC3 confirms that the measured values from RC3 do follow the above relation, however it under-predicts the true by 1.6 kpc on average. All three samples have similar mean bar and disk properties, but the bar semi-major axis and disk distributions for Abell 901/902 S0s have a tail to larger values. This tail corresponds to the tail of brighter S0s present in the Abell 901/902 sample. The mean values of for the Coma, Abell 901/902, and Virgo S0s are 6.51.3 kpc, 5.92.8 kpc, and 5.02.0 kpc, respectively. The KS statistic reflects these differences in the Coma, STAGES, and Virgo distributions giving (, ) between Coma and Virgo and (, ) between Coma and Abell 901/902. The Abell 901/902 and Virgo S0s have similar mean / ratios of 0.40.16, although the range in values is large ( 0.1–0.9). The KS statistic is consistent with similar distributions, giving (, ) and (0.6, 0.3) between Coma and Abell 901/902 and Coma and Virgo, respectively. Coma S0s have a slightly lower mean / 0.350.12. An / ratio of 0.30.2 has also been found for field galaxies averaged over all Hubble types (e.g., MJ07, Menendez-Delmestre et al. 2007) and for S0 galaxies (Erwin 2005). We note that the range of / spanned by the three samples is quite large ( 0.1–0.9), however although our number statistics are small, this range is similar to that found for local field galaxies in MJ07.
All three samples have very similar distributions in bar ellipticity (KS 0.9 and 0.2). The observed bar ellipticities we find for S0s in the Coma cluster as well as those for S0s in Virgo and Abell 901/902 are skewed toward lower values (e.g., mean 0.3–0.4) compared to the bar ellipticities in samples dominated by intermediate- to late-type galaxies (e.g., MJ07; BJM08; mean 0.5–0.7). This difference could be intrinsic (i.e., the bars in S0 galaxies are really less elliptical than those in later Hubble types), or it could be due to the dilution by the bright bulges of the isophotes crossing the end of the bar, where the ellipticity is measured (see 3.2.2). This effect has been demonstrated by Gadotti (2008).
3.8 Discussion: implications for the evolution of S0 bars and disks as a function of environment density
What do our results imply for the evolution of bars and disks in bright S0 galaxies as a function of environment? We first recapitulate our results. Using three detection methods (traditional ellipse fit criteria, relaxed ellipse fit criteria, and visual classification), we found an optical bar fraction of 5011%, 6511%, and 6011%, respectively for our sample of bright () S0 galaxies in the central region of the Coma cluster ( 3.4). We find that the bar fraction and properties (e.g., , ) in bright S0 galaxies derived through all three of the above methods do not show a statistically significant variation (greater than a factor of 1.3) between the dense central regions of Coma ( 10,000 gal/Mpc3), the intermediate-density Abell 901/902 clusters at 0.165 ( 1000 gal/Mpc3), and the low-density Virgo cluster ( 300gal/Mpc3; Table 3). We note that there is a hint that the mean bar fraction may show a slight increase as a function of environment density toward the dense core of the Coma cluster (Fig. 11), however given the error bars, we cannot say whether this trend is significant. Below, we explore what our results may imply for the formation and evolution of bars.
It has long been known that DM halo properties influence bar formation and evolution. At high redshifts (e.g., 5–8), recent theoretical studies of galaxy evolution using cosmological initial conditions find that bars are triggered by the triaxiality of DM halos and the asymmetric DM distribution as a whole (Romano-Díaz et al. 2008; Heller et al. 2007). These early bars are gas rich, and quickly decay. Subsequent bar generations form and are destroyed during the major-merger epoch (e.g., 2–4) due to the rapidly-changing potentials and gas dissipation associated with major mergers (Romano-Díaz et al. 2008). Although DM halos at early times can trigger bar formation due to their triaxiality, this triaxiality is diluted as disks and other central components form. The DM halos become more symmetric, on a timescale that is a function of mass (e.g., Dubinski 1994; Kazantzidis et al. 2004; Heller et al. 2007). By 1 disks have also become more massive and stable. Simulations find that large-scale stellar bars forming at around this epoch are long-lived (Romano-Díaz et al. 2008; Heller et al. 2007). Interestingly, new observational results find that the bar fraction for the most massive disks () does not change between 0.6 and 0.2 (Cameron et al. 2010). However, the picture is complicated by the fact that for intermediate-mass disk galaxies (–), the bar fraction builds up by a factor of two over that redshift range. In addition, at 0, the bar fraction and properties are a non-monotonic function of the host galaxy properties, such as stellar mass, luminosity, color, Hubble type, and SF history (BJM08; M09; Aguerri et al. 2009; Barazza et al. 2009; Weinzirl et al. 2009; Laurikainen et al. 2009; Gadotti 2011; Nair & Abraham 2010a).
The picture above does not directly discuss environmental effects. In fact, there are still few theoretical and observational studies addressing this aspect of bar evolution. However, increasingly the emerging picture is suggesting that the frequency and properties of bars do not appear to be a sensitive function of environment (van den Bergh 2002; Aguerri et al. 2009; M09; Barazza et al. 2009; Cameron et al. 2010; although see Giuricin et al. 1993 and Elmegreen et al. 1990).
How do the above results make sense in light of many theoretical studies that show that galaxy interactions can trigger bars in unbarred galaxies (e.g., Noguchi 1988; Mihos & Hernquist 1996)? We present a tentative picture below, considering the competing effects present in galaxy clusters. If a disk galaxy is sufficiently dynamically cold (i.e., Toomre ), it is susceptible to non-axisymmetric instabilities (e.g., bars) whether spontaneously induced (e.g., Toomre 1981; Binney & Tremaine 1987) or tidally induced (e.g., Noguchi 1988; Hernquist 1989; Heller & Shlosman 1994; Mihos & Hernquist 1996; Jogee 2006 and references therein). The effect of the interaction depends on the geometry (i.e., prograde or retrograde encounter), with retrograde encounters having little to no effect on an already existing bar (e.g., Gerin, Combes, & Athanassoula 1990; Steinmetz & Navarro 2002; Romano-Díaz et al. 2008; Aguerri & González-García 2009).
At , as clusters assemble and field galaxies fall into the existing cluster potential, let us now ask how the fraction and properties of bars in S0s might be expected to differ from the field environment. In a rich cluster, where the projected galaxy number density () and galaxy velocity dispersion () is high, the timescale for close interactions (or collision timescale, ) will be short. We can estimate this timescale using:
| (8) |
where is the galaxy number density, is the galaxy velocity dispersion, and is the cross-section for close interactions defined as
| (9) |
We assume is unity, 10 kpc. For the Coma core 900 km/s, and 10,000 gal/Mpc3 (The & White 1986) giving a short timescale for close interactions 90 Myr.
However, although these close galaxy-galaxy interactions are frequent in a rich cluster, the large galaxy velocity dispersions present mean that each single encounter will be a high speed one. Unlike single slow, strong encounters, a single high-speed encounter will typically not induce a large amount of tidal damage and not lead to major mergers. As a result, three factors may make it difficult for new bars to be induced in disk galaxies in a cluster. Firstly, single high-speed encounters may not be as effective in inducing bars as slow, strong encounters, because the timescale over which gravitational torques act is short. Secondly, over time, the cumulative effect of many high-speed and weak encounters (galaxy harassment), can tidally heat disks (e.g., Moore et al. 1996; Aguerri & González-García 2009), making such disks dynamically hot (with Toomre ), and thus less susceptible to bar instabilities. Finally, in a cluster environment, the accelerated star formation history (e.g., Balogh et al. 2004, Blanton et al. 2005b; Hogg et al. 2003) as well as physical processes such as ram pressure stripping (Gunn & Gott 1972; Larson et al. 1980; Quilis et al. 2000) will make S0 disks gas-poor, thus making them less bar-unstable. We therefore speculate that these three factors, namely the predominance of high speed encounters over slow ones, the tidal heating of S0 disks, and the low gas content of S0s in rich clusters, make it difficult for many new bars to be induced in S0 disks as they infall from a field-like to a cluster-like environment. This scenario may explain, at least in part, our findings that there is no strong variation in the optical bar fraction of S0s across the range of low density to high density environments characterized by Coma, Virgo, and Abell 901/902 in our study, as well as claims by other studies that there is no difference in the bar fraction between clusters and the field (van den Bergh 2002, Aguerri et al. 2009, Barazza et al. 2009; M09). Our interpretation for the result that the bar fraction is not greatly enhanced in the dense Coma cluster is also in agreement with that of Méndez-Abreu et al. (2010).
We note that it is possible that in rich clusters, the above effects, particularly the tidal heating, may cause existing bars to weaken. However, this effect is hard to robustly demonstrate observationally as the measured bar ellipticity is diluted by relatively large bulges in S0s (which dominate the disk population in clusters), while in the field, the disk population is dominated by spirals where such a dilution is not as severe (see 3.7).
It is also important to note that the arguments above, which explain why the bar fraction might not be greatly enhanced in rich clusters compared to the field, would lead to a rather different prediction for how the bar fraction in groups would compare to that in the field. In a group, the number density is moderately high ( 10) but the galaxy velocity dispersions are typically low ( 100; Tago et al. 2008). Therefore slow, strong encounters are expected to be frequent in groups. Such encounters are likely to induce extra bars in disk galaxies compared to the field, particularly given the fact that the disks will not be stripped of their cold gas in groups as they would in rich clusters. In this context, we note that indeed higher bar fractions have been reported for early-type galaxies in binary pairs (Elmegreen et al. 1990) and early-type galaxies that are disturbed/interacting (Varela et al. 2004).
4 Bars and disk features in Coma dwarfs
In addition to investigating bars in high-mass galaxies, we also take advantage of the exquisite resolution of the ACS ( 50 pc at the distance of Coma) to search for bars and other disk features (e.g., spiral arms, edge-on disks) in the numerous dwarf galaxies in the central regions of the Coma cluster. Are some of these galaxies the remnants of late-type spirals that have gone through processing in a dense cluster environment? In Virgo, some early-type dwarfs are known to host features (e.g., lenses, bars, spiral arms; Sandage & Binggeli 1984; Binggeli & Cameron 1991; Jerjen et al. 2000; Barazza et al. 2002; Lisker et al. 2006; Lisker et al. 2007; Lisker & Fuchs 2009) suggesting the presence of a disk. Not only can such features provide clues to the formation history of these systems, but the presence or absence of bar structures has implications for the conditions necessary for bar formation and growth in galaxies (e.g., Méndez-Abreu et al. 2010).
4.1 Identifying dwarf galaxies
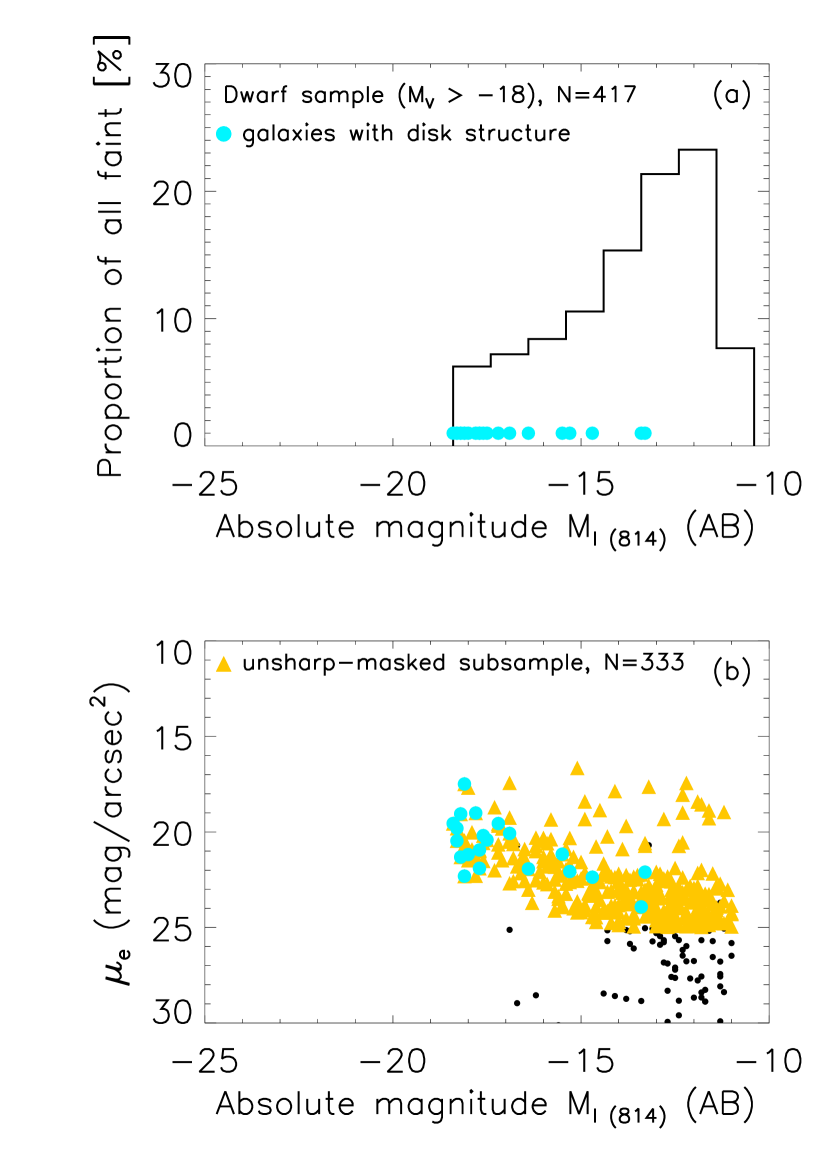
As outlined in 2, we use a magnitude cut at (AB mag), (roughly corresponding to Vega mag) to separate dwarf and normal galaxies. A montage of some of the faint, low-mass dwarfs in our Coma core sample is shown in Fig. 15. Fig. 16a shows the distribution of absolute magnitude of the galaxies in the faint dwarf sample. Fig. 16b shows where the dwarf galaxies lie on a plot of the (the surface brightness at ) vs. absolute magnitude . Effective radii and are from Hoyos et al. (2010), derived through single-component Sérsic fits.
Prior to applying the unsharp masking technique ( 4.2) on the dwarf sample, we pick out good candidates through a cut in surface brightness ( mag arcsec-2) and radius ( pc). These cuts remove very low surface-brightness objects, and those where we are unlikely to resolve disk structure. We choose a size cut at pc, which is twice the ACS PSF at the distance of Coma. Out of the 417 dwarf galaxies, we find 333 dwarfs that satisfy these criteria. The vs. distribution of these galaxies is plotted with yellow triangles in Fig. 16b.
4.2 Identifying bars and other disk features in dwarfs
In many dwarf galaxies disk features may not be readily apparent by eye (or traditional quantitative methods such as ellipse fitting) because their amplitude is very low and is overwhelmed by the smooth light from the galaxy. Which method is sensitive enough to detect faint spiral/bar structure in such systems? Jerjen et al. (2000) used residuals from subtracting the azimuthally-averaged light profile of the galaxy from the original image to discover hidden spiral features in IC 3328 with deep VLT observations. They analyzed the spiral structure using Fourier expansion, finding that the amplitude of the spiral is only 3 to 4%. However, upon further analysis of a larger sample of 20 Virgo dwarfs, Barazza et al. (2002) find that some spiral or bar-resembling residuals may be artifacts from the combination of the increasing ellipticity and twisting isophotes (due to triaxiality) present in these galaxies and not actual spiral structure. Fourier decomposition is similarly unsuccessful in many galaxies. Barazza et al. (2002) find that a much better method seems to be unsharp masking (e.g., Schweizer & Ford 1985; Mendez et al. 1989; Buta & Crocker 1993; Colbert et al. 2001; Erwin & Sparke 2003). In this method, no assumptions about the light profile/inclination of the galaxy are necessary. Recently, Lisker et al. (2006) also successfully employed unsharp masking on 470 Virgo dwarfs to look for evidence of bar/spiral structure. Graham et al. (2003) discovered two dwarf galaxies with spiral structure in the Coma cluster using unsharp masking as well as subtracting a symmetrical model to reveal non-symmetrical disk features (one of these galaxies is COMAi125937.988p28003.56 in Table 4, while the other is not covered by the Coma ACS Treasury survey). Chilingarian et al. (2008) use unsharp masking to find disk features in dwarf galaxies in Abell 496. We therefore use the unsharp masking method to seek out bar (or spiral) structures in the Coma cluster core dwarf sample.
We perform unsharp masking for the 333 dwarf galaxies that fit the criteria outlined in 4.1. First, we smooth the galaxy images by convolving with a Gaussian using the IRAF task . Then we divide the original galaxy image by the smoothed image. We choose the Gaussian smoothing kernel size to be 25 pixels, corresponding to 625 pc for our galaxies. We also try a range of smoothing lengths from 15–45 pixels ( 375–1125 pc) for a subsample of the galaxies and find no substantial change in the results. A point made by Lisker et al. (2006) is that in some cases, it is desirable to use an elliptical smoothing aperture matched to the outer ellipticity and PA of the galaxy, in order to avoid spurious detections that resemble an edge-on disk. For this reason, in all cases where we suspect that the galaxy host an inclined/edge-on disk, we also perform the unsharp masking using an elliptical PSF to ensure that the structures found are not spurious detections.
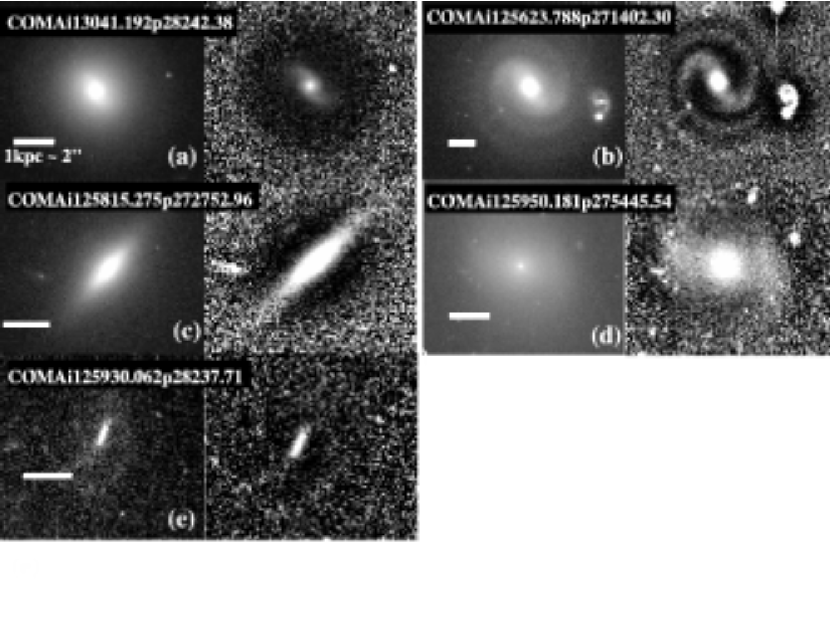
We find bars and/or spiral arms in 13 galaxies out of the 333 dwarfs in the unsharp-masked subsample. An additional eight galaxies show evidence of an inclined disk (or ambiguous inclined disk or bar). The galaxies where we find structure are listed in Table 4. Fig. 17 shows examples of the residuals due to different types of structures: (a) spiral arms only, (b) bar and spiral arms, (c) inclined disk, (d) bar and/or spiral, (e) ambiguous bar or inclined disk embedded in a stellar halo. The galaxies with disk structure are overplotted as cyan points in Fig. 16. Most (76%) of the galaxies where we find disk structure are brighter than (AB mag). We discuss the possible implications of these results below.
4.3 Discussion: barred dwarf galaxies in the Coma core
Using visual inspection and unsharp masking we find only 13 galaxies with bars and/or spiral arms in our Coma core dwarf subsample of 333 galaxies with mag arcsec-2 and pc. Does this result imply that faint/dwarf galaxies with disks are very rare within the Coma population, or rather that any existing disks in these galaxies are too dynamically hot to be unstable to disk instabilities?
Studies have long been finding early-type dwarf galaxies with spiral/bar structure in Virgo and Fornax (e.g., Sandage & Binggeli 1984; Binggeli & Cameron 1991; Jerjen et al. 2000; Barazza et al. 2002; Lisker et al. 2006; Lisker et al. 2007; Lisker & Fuchs 2009). Lisker et al. (2006) search through 476 Virgo early-type dwarfs and find unambiguous stellar disk structure (bar/spiral) in 14 of them, while another 27 have probable or possible disk features. Some authors have speculated that anywhere from 5% to 50% of Virgo early-type dwarfs have disk structure, depending on the magnitude range under scrutiny (Lisker et al. 2006; Lisker & Fuchs 2009).
Approaching the search for disks in early-type dwarfs a different way, Aguerri et al. (2005) investigate a sample of galaxies in Coma with and classify them into two types dE or dS0 depending on their surface brightness profile. Galaxies whose surface brightness profiles are well fitted by a single Sérsic law are classified as dEs, and those with surface brightness profiles fitted with a Sérsic plus exponential profile are classified as dS0s. Aguerri et al. (2005) find that about 30% of their Coma dwarf sample cannot be fitted well by a single Sérsic law, suggesting that early-type dwarfs with disks may not be scarce in Coma. Graham & Guzman (2003) found evidence for outer disks in three out of a sample of 18 Coma early-type dwarfs, modeling the surface brightness profiles using a Sersic function in combination with either a central point source or a resolved central Gaussian component using high-resolution images.
While it is still unclear whether all early-type dwarfs with disk structure represent a distinct class of galaxies that are the product of a single formation mechanism, one plausible scenario is that they are formed through processing of faint, late-type spirals and irregulars in cluster environments (e.g., Kormendy 1985; Lin & Faber 1983; Graham et al. 2003; Lisker et al. 2006). This processing includes the loss of their gas through ram-pressure stripping (e.g., Gunn & Gott 1972) as well as the cumulative effects of harassment in a cluster environment (e.g., Moore et al. 1996). The simulations of Mastropietro et al. (2005) have shown that indeed late-type spirals can be reprocessed into early-type dwarfs through cluster processes (such as harassment), and that these dwarfs do retain their stellar disk structure. On the other hand, observations of a small number of isolated early-type dwarf galaxies (e.g., Fuse et al. 2008; Hernández-Toledo et al. 2010) argue against cluster transformation processes as the sole explanation for the formation of these objects.
We find evidence of only 13 dwarfs hosting disk instabilities (bar and/or spiral arms) in our unsharp-masked subsample of 333 dwarfs. This result is in broad agreement with the findings of Méndez-Abreu et al. (2010), who find a paucity of barred disks for Coma galaxies fainter than . As also suggested by Méndez-Abreu et al. (2010), these results imply that although it is possible that as many as 30% of dwarf galaxies in Coma may have a disk component (Aguerri et al. 2005), the majority do not have the necessary conditions to form or maintain bar and spiral instabilities, namely a disk that is dynamically cold. This result is consistent with previous studies, showing a paucity of thin disks in lower-luminosity dwarf galaxies (Sánchez-Janssen et al. 2010; Yoachim & Dalcanton 2006).
5 Summary
We use ACS F814W images from the Hubble Space Telescope ACS Treasury survey of the Coma cluster at 0.02 to study the fraction and properties of barred galaxies in the central region of Coma, the densest environment in the nearby Universe. The available data span 274 arcmin2, where approximately 75% of the data are within 0.5 Mpc of the cluster center, and contain thousands of sources down to a limiting magnitude of 26.8 mag in F814W (AB mag). We initially select 469 cluster members and split the sample with a magnitude cut at (Vega mag). Using this magnitude cut, we investigate two different regimes: (1) the fraction and properties of bright S0 galaxies and (2) the presence of bars and other disk features (e.g., bars and spiral arms) in faint/dwarf galaxies in the Coma core. Our results for the two populations are described below.
(1) For S0 galaxies: We select a sample of 32 bright S0 galaxies based on visual classification supplemented by multi-component decompositions in ambiguous cases ( 3.1). After discarding 12 highly-inclined galaxies, we identify and characterize bars in the remaining 20 moderately-inclined S0s using three methods: ellipse fits where the bar is detected through strict criteria (the peak bar ellipticity is required to be a global maximum in the radial profile of ellipticity); ellipse fits where the bar is detected through relaxed criteria (which do not require the peak bar ellipticity to be a global maximum); and visual classification. We find:
-
•
The optical bar fraction for our bright S0 sample is: 50 11%, 65 11%, and 60 11% based on ellipse fits with traditional and relaxed criteria, and visual classification, respectively (Table 2).
-
•
We compare to results from studies in less dense environments (Abell 901/902 and Virgo) and find that the bar fraction, as well as the mean quantitative properties of the S0 bars and disks (e.g., , , ) do not show a statistically significant variation, within the error bars, for samples of matched S0s in environment densities ranging from 300 gal/Mpc3 (Virgo), 1000 gal/Mpc3 (Abell 901/902), and 10,000 gal/Mpc3 (Coma), with high galaxy velocity dispersions 800 km/s (Table 3, Fig. 14). We note that there is a hint that the mean bar fraction may show a slight increase as a function of environment density toward the dense core of the Coma cluster (Fig. 11), however given the error bars, we cannot say whether this trend is significant. We speculate that the bar fraction among S0s is not dramatically enhanced in rich clusters compared to low density environments due to several factors. Firstly, S0s in rich clusters are likely to be more stable to bar instabilities because they are dynamically heated by the cumulative effect of many high-speed, weak encounters (galaxy harassment), and additionally are gas poor as a result of ram pressure stripping and accelerated star formation. Secondly, individual high-speed encounters in rich clusters may be less effective than individual slow strong encounters in inducing bars. The combination of these effects precludes an enhancement in the bar fraction for S0 galaxies in cluster environments compared to the field. Our results are in agreement with recent observational studies which find no difference in the fraction of barred galaxies with environment density over all Hubble types.
(2) For faint/dwarf galaxies: We select a sample of
417 galaxies fainter than (AB mag; 4.1)
where we utilize our 50 pc
resolution to look for disk structures such as bars and spiral arms
using visual classification of unsharp-masked images. After applying unsharp
masking to a subsample of 333 dwarfs
( mag arcsec-2, pc; 4.2),
we find only 13 dwarf galaxies with a
bar and/or spiral arms, and an additional eight galaxies where an inclined disk may be present
(Fig. 17). These results suggest that either disks
are not common in these galaxies in the Coma cluster core, or that any
disks present are too hot to form instabilities.
I.M., S. J,. and T. W. acknowledge support from the National Aeronautics and Space Administration (NASA) LTSA grant NAG5-13063, NSF grant AST-0607748, and grants GO-11082 and GO-10861 from STScI, which is operated by AURA, Inc., for NASA, under NAS5-26555. SJ thanks the Excellence Cluster Origin and Structure of the Universe in Garching, Germany, sponsored by TUM, the Ludwig-Maximilians-Universitt (LMU), the Max-Planck-Institutes, and the European Southern Observatory (ESO). P.E. was supported by DFG Priority Program 1177 (‘Witnesses of Cosmic History: Formation and evolution of black holes, galaxies and their environment’). DC acknowledges support from the UK Science and Technology Facilities Council under grant ST/H002391/1.
References
- Abraham et al. (1999) Abraham, R. G., Merrifield, M. R., Ellis, R. S., Tanvir, N. R., & Brinchmann, J. 1999, MNRAS, 308, 569
- Aguerri & González-García (2009) Aguerri, J. A. L., & González-García, A. C. 2009, A&A, 494, 891
- Aguerri et al. (2005) Aguerri, J. A. L., Iglesias-Páramo, J., Vílchez, J. M., Muñoz-Tuñón, C., & Sánchez-Janssen, R. 2005, AJ, 130, 475
- Aguerri et al. (2009) Aguerri, J. A. L., Méndez-Abreu, J., & Corsini, E. M. 2009, A&A, 495, 491
- Andersen (1996) Andersen, V. 1996, AJ, 111, 1805
- Athanassoula (2005) Athanassoula, E. 2005, MNRAS, 358, 1477
- Barazza et al. (2002) Barazza, F. D., Binggeli, B., & Jerjen, H. 2002, A&A, 391, 823
- Barazza et al. (2006) Barazza, F. D., et al. 2006, ApJ, 643, 162
- Barazza et al. (2008) Barazza, F. D., Jogee, S., & Marinova, I. 2008, ApJ, 675, 1194 (BJM08)
- Barazza et al. (2009) Barazza, F. D., et al. 2009, A&A, 497, 713
- Balogh et al. (2004) Balogh, M. L., Baldry, I. K., Nichol, R., Miller, C., Bower, R., & Glazebrook, K. 2004, ApJL, 615, L101
- Bell et al. (2003) Bell, E. F., McIntosh, D. H., Katz, N., & Weinberg, M. D. 2003, ApJS, 149, 289
- Bell et al. (2005) Bell, E. F., et al. 2005, ApJ, 625, 23
- Bell et al. (2006) Bell, E. F., Phleps, S., Somerville, R. S., Wolf, C., Borch, A., & Meisenheimer, K. 2006, ApJ, 652, 270
- Binggeli et al. (1987) Binggeli, B., Tammann, G. A., & Sandage, A. 1987, AJ, 94, 251
- Binggeli et al. (1988) Binggeli, B., Sandage, A., & Tammann, G. A. 1988, ARAA, 26, 509
- Binggeli & Cameron (1991) Binggeli, B., & Cameron, L. M. 1991, A&A, 252, 27
- Binney & Tremaine (1987) Binney, J., & Tremaine, S. 1987, Princeton, NJ, Princeton University Press, 1987, 747 p.,
- Blanton et al. (2005) Blanton, M. R., Eisenstein, D., Hogg, D. W., Schlegel, D. J., & Brinkmann, J. 2005b, ApJ, 629, 143
- Blanton et al. (2005) Blanton, M. R., Eisenstein, D., Hogg, D. W., Schlegel, D. J., & Brinkmann, J. 2005a, ApJ, 629, 143
- Block et al. (2004) Block, D. L., Buta, R., Knapen, J. H., Elmegreen, D. M., Elmegreen, B. G., & Puerari, I. 2004, AJ, 128, 183
- Borch et al. (2006) Borch, A., Meisenheimer, K., Bell, E. F., et al. 2006, A&A, 453, 869
- Buta & Crocker (1993) Buta, R., & Crocker, D. A. 1993, AJ, 106, 939
- Byrd & Valtonen (1990) Byrd, G., & Valtonen, M. 1990, ApJ, 350, 89
- Cameron et al. (2010) Cameron, E., et al. 2010, arXiv:1001.1736
- Carter (1978) Carter, D. 1978, MNRAS, 182, 797
- Carter (1987) Carter, D. 1987, ApJ, 312, 514
- Carter et al. (2008) Carter, D., et al. 2008, ApJS, 176, 424
- Chilingarian et al. (2008) Chilingarian, I. V., Cayatte, V., Durret, F., Adami, C., Balkowski, C., Chemin, L., Laganá, T. F., & Prugniel, P. 2008, A&A, 486, 85
- Colbert et al. (2001) Colbert, J. W., Mulchaey, J. S., & Zabludoff, A. I. 2001, AJ, 121, 808
- Combes & Sanders (1981) Combes, F., & Sanders, R. H. 1981, A&A, 96, 164
- Combes et al. (1990) Combes, F., Debbasch, F., Friedli, D., & Pfenniger, D. 1990, A&A, 233, 82
- deVaucoulers et al. (1991) de Vaucouleurs, G., de Vaucouleurs, A., Corwin Jr., H. G., Buta, R. J., Paturel, G., & Fouque, P. 1991, Third Reference Catalogue of Bright Galaxies (New York: Springer) (RC3)
- Dressler (1980) Dressler, A. 1980, ApJ, 236, 351
- Dubinski (1994) Dubinski, J. 1994, ApJ, 431, 617
- Elmegreen et al. (1990) Elmegreen, D. M., Elmegreen, B. G., & Bellin, A. D. 1990, ApJ, 364, 415
- Elmegreen et al. (2004) Elmegreen, B. G., Elmegreen, D. M., & Hirst, A. C. 2004, ApJ, 612, 191
- Erwin & Sparke (2003) Erwin, P., & Sparke, L. S. 2003, ApJS, 146, 299
- Erwin (2005) Erwin, P. 2005, MNRAS, 364, 283
- Eskridge et al. (2000) Eskridge, P. B., et al. 2000, AJ, 119, 536
- Friedli et al. (1996) Friedli, D., Wozniak, H., Rieke, M., Martinet, L., & Bratschi, P. 1996, A&A Suppl., 118, 461
- Fuse (2008) Fuse, C. R. 2008, Ph.D. Thesis,
- Gadotti (2008) Gadotti, D. A. 2008, MNRAS, 384, 420
- Gadotti (2011) Gadotti, D. A. 2011, MNRAS, 888
- Gerin et al. (1990) Gerin, M., Combes, F., & Athanassoula, E. 1990, A&A, 230, 37
- Giordano et al. (2010) Giordano, L., Tran, K.-V. H., Moore, B., & Saintonge, A. 2010, arXiv:1002.3167 (G10)
- Giuricin et al. (1993) Giuricin, G., Mardirossian, F., Mezzetti, M., & Monaco, P. 1993, ApJ, 407, 22
- Gnedin (2003) Gnedin, O. Y. 2003, ApJ, 589, 752
- Graham et al. (2003) Graham, A. W., Jerjen, H., & Guzmán, R. 2003, AJ, 126, 1787
- Graham & Guzmán (2003) Graham, A. W., & Guzmán, R. 2003, AJ, 125, 2936
- Gray et al. (2009) Gray, M. E., et al. 2009, MNRAS, 393, 1275
- Gunn & Gott (1972) Gunn, J. E., & Gott, J. R., III 1972, ApJ, 176, 1
- Hammer et al. (2010) Hammer, D., et al. 2010, arXiv:1005.3300
- Heiderman et al. (2009) Heiderman, A., et al. 2009, ApJ, 705, 1433
- Heller & Shlosman (1994) Heller, C. H., & Shlosman, I. 1994, ApJ, 424, 84
- Heller et al. (2007) Heller, C. H., Shlosman, I., & Athanassoula, E. 2007, ApJ, 671, 226
- Hernquist (1989) Hernquist, L. 1989, Nature, 340, 687
- Hernández-Toledo et al. (2010) Hernández-Toledo, H. M., Vázquez-Mata, J. A., Martínez-Vázquez, L. A., Choi, Y.-Y., & Park, C. 2010, AJ, 139, 2525
- Hohl (1975) Hohl, F. 1975, Dynamics of the Solar Systems, 69, 349
- Hogg & SDSS Collaboration (2003) Hogg, D. W., & SDSS Collaboration 2003, Bulletin of the American Astronomical Society, 35, 770
- Hoyos et al. (2010) Hoyos, C., et al. 2010, arXiv:1010.2352
- Hunt & Malkan (1999) Hunt, L. K., & Malkan, M. A. 1999, ApJ, 516, 660
- Jedrzejewski (1987) Jedrzejewski, R. I. 1987, MNRAS, 226, 747
- Jerjen et al. (2000) Jerjen, H., Kalnajs, A., & Binggeli, B. 2000, A&A, 358, 845
- Jester et al. (2005) Jester, S., et al. 2005, AJ, 130, 873
- Jogee (1999) Jogee, S. 1999, Ph.D. thesis, Yale University
- Jogee et al. (2002) Jogee, S., Knapen, J. H., Laine, S., Shlosman, I., Scoville, N. Z., & Englmaier, P. 2002a, ApJL, 570, L55
- Jogee et al. (2002) Jogee, S., Shlosman, I., Laine, S., Englmaier, P., Knapen, J. H., Scoville, N., & Wilson, C. D. 2002b, ApJ, 575, 156
- Jogee et al. (2004) Jogee, S., Barazza, F., Rix, H.-W., Shlosman, I. et al. 2004a, ApJl, 615, L105
- Jogee et al. (2005) Jogee, S., Scoville, N., & Kenney, J. D. P. 2005, ApJ, 630, 837
- Jogee (2006) Jogee, S. 2006, Physics of Active Galactic Nuclei at all Scales, 693, 143
- Jogee et al. (2009) Jogee, S., et al. 2009, ApJ, 697, 1971
- Kazantzidis et al. (2004) Kazantzidis, S., Kravtsov, A. V., Zentner, A. R., Allgood, B., Nagai, D., & Moore, B. 2004, ApJL, 611, L73
- Knapen et al. (2000) Knapen, J. H., Shlosman, I., & Peletier, R. F. 2000, ApJ, 529, 93
- Kormendy (1979) Kormendy, J. 1979, ApJ, 227, 714
- Kormendy (1985) Kormendy, J. 1985, ApJ, 295, 73
- Kormendy (1993) Kormendy, J. 1993, Galactic Bulges, 153, 209
- Kormendy & Fisher (2008) Kormendy, J., & Fisher, D. B. 2008, Astronomical Society of the Pacific Conference Series, 396, 297
- Kroupa et al. (1993) Kroupa, P., Tout, C. A., & Gilmore, G. 1993, MNRAS, 262, 545
- Laine et al. (2002) Laine, S., Shlosman, I., Knapen, J. H., & Peletier, R. F. 2002, ApJ, 567, 97
- Larson et al. (1980) Larson, R. B., Tinsley, B. M., & Caldwell, C. N. 1980, ApJ, 237, 692
- Laurikainen et al. (2004) Laurikainen, E., Salo, H., Buta, R., & Vasylyev, S. 2004, MNRAS, 355, 1251
- Laurikainen et al. (2005) Laurikainen, E., Salo, H., & Buta, R. 2005, MNRAS, 362, 1319
- Laurikainen et al. (2007) Laurikainen, E., Salo, H., Buta, R., & Knapen, J. H. 2007, MNRAS, 381, 401
- Laurikainen et al. (2009) Laurikainen, E., Salo, H., Buta, R., & Knapen, J. H. 2009, ApJL, 692, L34
- Lin & Faber (1983) Lin, D. N. C., & Faber, S. M. 1983, ApJL, 266, L21
- Lisker et al. (2006) Lisker, T., Grebel, E. K., & Binggeli, B. 2006, AJ, 132, 497
- Lisker et al. (2007) Lisker, T., Grebel, E. K., Binggeli, B., & Glatt, K. 2007, ApJ, 660, 1186
- Lisker & Fuchs (2009) Lisker, T., & Fuchs, B. 2009, A&A, 501, 429
- Marinova & Jogee (2007) Marinova, I., & Jogee, S. 2007, ApJ, 659, 1176 (MJ07)
- Marinova et al. (2009) Marinova, I., et al. 2009, ApJ, 698, 1639 (M09)
- Mastropietro et al. (2005) Mastropietro, C., Moore, B., Mayer, L., Debattista, V. P., Piffaretti, R., & Stadel, J. 2005, MNRAS, 364, 607
- Matković & Guzmán (2005) Matković, A., & Guzmán, R. 2005, MNRAS, 362, 289
- Mendez et al. (1989) Mendez, M., Orsatti, A. M., & Forte, J. C. 1989, ApJ, 338, 136
- Méndez-Abreu et al. (2010) Méndez-Abreu, J., Sánchez-Janssen, R., & Aguerri, J. A. L. 2010, ApJL, 711, L61
- Menéndez-Delmestre et al. (2007) Menéndez-Delmestre, K., Sheth, K., Schinnerer, E., Jarrett, T. H., & Scoville, N. Z. 2007, ApJ, 657, 790
- Mihos & Hernquist (1996) Mihos, J. C., & Hernquist, L. 1996, ApJ, 464, 641
- Mobasher et al. (2003) Mobasher, B., et al. 2003, ApJ, 587, 605
- Moore et al. (1996) Moore, B., Katz, N., Lake, G., Dressler, A., & Oemler, A. 1996, Nature, 379, 613
- Mulchaey & Regan (1997) Mulchaey, J. S., & Regan, M. W. 1997, ApJL, 482, L135
- Nair & Abraham (2010) Nair, P. B., & Abraham, R. G. 2010a, ApJL, 714, L260
- Nair & Abraham (2010) Nair, P. B., & Abraham, R. G. 2010b, ApJS, 186, 427
- Noguchi (1988) Noguchi, M. 1988, A&A, 203, 259
- Odewahn (1996) Odewahn, S. C. 1996, IAU Colloq. 157: Barred Galaxies, 91, 30
- Peng et al. (2002) Peng, C. Y., Ho, L. C., Impey, C. D., & Rix, H.-W. 2002, AJ, 124, 266
- Quilis et al. (2000) Quilis, V., Moore, B., & Bower, R. 2000, Science, 288, 1617
- Reese et al. (2007) Reese, A. S., Williams, T. B., Sellwood, J. A., Barnes, E. I., & Powell, B. A. 2007, AJ, 133, 2846
- Regan & Elmegreen (1997) Regan, M. W., & Elmegreen, D. M. 1997, AJ, 114, 965
- Robaina et al. (2009) Robaina, A. R., et al. 2009, ApJ, 704, 324
- Romano-Díaz et al. (2008) Romano-Díaz, E., Shlosman, I., Heller, C., & Hoffman, Y. 2008, ApJL, 687, L13
- Sakamoto et al. (1999) Sakamoto, K., Okumura, S. K., Ishizuki, S., & Scoville, N. Z. 1999, ApJ, 525, 691
- Sánchez-Janssen et al. (2010) Sánchez-Janssen, R., Méndez-Abreu, J., & Aguerri, J. A. L. 2010, MNRAS, 406, L65
- Sandage & Binggeli (1984) Sandage, A., & Binggeli, B. 1984, AJ, 89, 919
- Schneider (2006) Schneider, P. 2006, Extragalactic Astronomy and Cosmology, by Peter Schneider. Berlin: Springer, 2006.,
- Schwarz (1981) Schwarz, M. P. 1981, ApJ, 247, 77
- Schweizer & Ford (1985) Schweizer, F., & Ford, W. K., Jr. 1985, New Aspects of Galaxy Photometry, 232, 145
- Sheth et al. (2003) Sheth, K., Regan, M. W., Scoville, N. Z., & Strubbe, L. E. 2003, ApJL, 592, L13
- Sheth et al. (2005) Sheth, K., Vogel, S. N., Regan, M. W., Thornley, M. D., & Teuben, P. J. 2005, ApJ, 632, 217
- Sheth et al. (2008) Sheth, K., et al. 2008, ApJ, 675, 1141
- Steinmetz & Navarro (2002) Steinmetz, M., & Navarro, J. F. 2002, New Astronomy, 7, 155
- Tago et al. (2008) Tago, E., Einasto, J., Saar, E., Tempel, E., Einasto, M., Vennik, J., Muller, V. 2008, A&A, 479, 927
- The & White (1986) The, L. S., & White, S. D. M. 1986, AJ, 92, 1248
- Thompson (1981) Thompson, L. A. 1981, ApJL, 244, L43 (T81)
- Trentham (1998) Trentham, N. 1998, MNRAS, 293, 71
- Trentham & Hodgkin (2002) Trentham, N., & Hodgkin, S. 2002, MNRAS, 333, 423
- Toomre (1981) Toomre, A. 1981, Structure and Evolution of Normal Galaxies, 111
- van den Bergh (2002) van den Bergh, S. 2002, AJ, 124, 782
- van Zee (2001) van Zee, L. 2001, AJ, 121, 2003
- Varela et al. (2004) Varela, J., Moles, M., Márquez, I., Galletta, G., Masegosa, J., & Bettoni, D. 2004, A&A, 420, 873
- Weinzirl et al. (2009) Weinzirl, T., Jogee, S., Khochfar, S., Burkert, A., & Kormendy, J. 2009, ApJ, 696, 411
- Wolf et al. (2005) Wolf, C., et al. 2005, ApJ, 630, 771
- Wolf et al. (2009) Wolf, C., et al. 2009, MNRAS, 393, 1302
- Wozniak et al. (1995) Wozniak, H., Friedli, D., Martinet, L., Martin, P., & Bratschi, P. 1995, A&A Suppl., 111, 115
- Yoachim & Dalcanton (2006) Yoachim, P., & Dalcanton, J. J. 2006, AJ, 131, 226
| Bar ID | Galaxy ID | RA | DEC | Bar detection method | |||||
|---|---|---|---|---|---|---|---|---|---|
| (AB mag) | obs | dep | obs (kpc) | dep (kpc) | |||||
| (1) | (2) | (3) | (4) | (5) | (6) | (7) | (8) | (9) | (10) |
| B1 | COMAi125710.767p272417.44 | 194.29486 | 27.404846 | -20.1 | ES, ER, V | 0.35 | 0.26 | 2.97 | 2.99 |
| B2 | COMAi125833.136p272151.77 | 194.63806 | 27.364383 | -20.0 | ES, ER, V | 0.68 | 0.54 | 3.19 | 3.52 |
| B3 | COMAi125928.728p28225.90 | 194.86970 | 28.040531 | -19.7 | ES, ER | 0.49 | 0.40 | 2.26 | 2.44 |
| B4 | COMAi125929.956p275723.26 | 194.87481 | 27.956462 | -21.1 | ES, ER, V | 0.47 | 0.51 | 4.36 | 5.04 |
| B5 | COMAi125946.775p275825.88 | 194.94490 | 27.973856 | -20.6 | ES, ER, V | 0.39 | 0.70 | 2.22 | 2.82 |
| B6 | COMAi125956.707p275548.62 | 194.98628 | 27.930173 | -19.9 | ES, ER, V | 0.55 | 0.46 | 3.42 | 4.00 |
| B7 | COMAi13022.156p28249.08 | 195.09231 | 28.046968 | -20.6 | ES, ER, V | 0.37 | 0.46 | 1.92 | 2.23 |
| B8 | COMAi13038.731p28052.22 | 195.16137 | 28.014507 | -20.3 | ES, ER, V | 0.47 | 0.31 | 3.57 | 3.77 |
| B9 | COMAi13042.753p275816.88 | 195.17814 | 27.971355 | -21.3 | ES, ER, V | 0.25 | 0.31 | 1.46 | 1.55 |
| B10 | COMAi13042.833p275746.98 | 195.17846 | 27.963052 | -20.3 | ES, ER, V | 0.43 | 0.46 | 2.48 | 2.64 |
| B11 | COMAi125930.825p275303.42 | 194.87843 | 27.884283 | -21.1 | ER, V | 0.33 | 0.35 | 1.99 | 2.33 |
| B12 | COMAi13017.020p28350.10 | 195.07092 | 28.063917 | -19.0 | ER, V | 0.29 | 0.40 | 1.14 | 1.45 |
| B13 | COMAi13027.971p275721.54 | 195.11654 | 27.955985 | -20.1 | ER, V | 0.31 | 0.47 | 2.09 | 2.79 |
Note. — (1) Bar ID; (2) Galaxy ID as given in the Coma Treasury survey DR2 (Hammer et al. 2010); (3) RA (J2000); (4) DEC (J2000); (5) absolute magnitude in AB mag; (6) Bar detection method: ‘ES’ - strict ellipse fit criteria ( 3.2.2), ‘ER’ - relaxed ellipse fit criteria ( 3.2.2), and ‘V’ - visual classification on direct image ( 3.3; (7) Observed peak bar ellipticity ; (8) Deprojected peak bar ellipticity; (9) Observed bar semi-major axis measured at ; (10) Deprojected bar semi-major axis ( 3.7).
| Method | Unbarred | Barred | |
|---|---|---|---|
| Ellipse fit, strict | 10 | 10 | 5011% |
| Ellipse fit, relaxed | 7 | 13 | 6511% |
| Visual classification | 8 | 12 | 6011% |
Note. — optical bar fraction for the 20 moderately inclined () bright () S0 galaxies. Barred galaxies are characterized through: (1) ellipse fitting using the strict criteria (where is required to be a global maximum in the ellipticity profile), (2) ellipse fitting using relaxed criteria ( can be a local maximum), and (3) visual classification.
| Study | Environment | Number density (gal/Mpc3) | Velocity dispersion (km/s) | S0 for |
|---|---|---|---|---|
| (1) | (2) | (3) | (4) | (5) |
| Bars identified through ellipse fitting (strict criteria; 3.2.2) | ||||
| this work | Coma central region, 0.02 | 10,000 | 900(a) | 5011% (10/20) |
| M09(b) | Abell 901/902 clusters, 0.165 | 1000 | 800–1200(c) | 395% (38/98) |
| E11 | Virgo, 0 | 300 | 400–750(d) | 4414% (12/27) |
| Bars identified through ellipse fitting (relaxed criteria; 3.2.2) | ||||
| this work | Coma central region 0.02 | 10,000 | 900 | 6511% (13/20) |
| M09(b) | Abell 901/902 clusters, 0.165 | 1000 | 800–1200 | 485% (47/98) |
| E11 | Virgo, 0 | 300 | 400–750 | 4814% (13/27) |
| Bars identified through visual classification | ||||
| this work | Coma central region, 0.02 | 10,000 | 900 | 6011% (12/20) |
| T81(e) | Coma central region, 0.02 | 10,000 | 900 | 427% (19/45) |
| M09(b) | Abell 901/902 clusters, 0.165 | 1000 | 800–1200 | 555% (54/98) |
| E11(f) | Virgo, 0 | 300 | 400–750 | 599% (16/27) |
Note. — T81: Thompson 1981; M09: Marinova et al. 2009; E11: Erwin et al. (in prep.)
(a) The & White (1986)
(b) We use a sub-sample from M09, with the criteria outlined in 3.5.
(c) Heiderman et al. (2009)
(d) Binggeli et al. (1987)
(e) Bar classification is performed on ground-based KPNO plates.
(f) For this paper, visual classification is performed on the E11 sample by P.E., I.M., and S.J. using the criteria outlined in 3.3.
| Galaxy ID | RA | DEC | Visit | Structure | |
|---|---|---|---|---|---|
| (1) | (2) | (3) | (4) | (5) | (6) |
| COMAi13030.949p28630.18 | 195.12895 | 28.10838 | 02 | -17.6 | inclined disk |
| COMAi13041.192p28242.38 | 195.17163 | 28.04510 | 08 | -17.8 | spiral |
| COMAi13018.883p28033.55 | 195.07867 | 28.00931 | 09 | -18.1 | bar |
| COMAi13013.398p28311.81 | 195.05583 | 28.05328 | 10 | -17.7 | inclined disk |
| COMAi13007.727p28051.91 | 195.03219 | 28.01441 | 10 | -13.3 | inclined disk |
| COMAi125930.062p28237.71 | 194.87525 | 28.04380 | 13 | -13.4 | bar/inclined disk |
| COMAi125904.792p28301.21 | 194.76997 | 28.05033 | 14 | -18.3 | bar |
| COMAi125911.545p28033.38 | 194.79811 | 28.00927 | 14 | -18.2 | inclined disk |
| COMAi125953.930p275813.76 | 194.97471 | 27.97048 | 18 | -16.9 | spiral |
| COMAi125937.988p28003.56 | 194.90827 | 28.00098 | 19 | -18.0 | bar + spiral |
| COMAi13035.418p275634.05 | 195.14758 | 27.94279 | 22 | -17.7 | bar |
| COMAi13024.823p275535.89 | 195.10342 | 27.92663 | 23 | -18.2 | bar + spiral |
| COMAi125950.181p275445.54 | 194.95909 | 27.91265 | 25 | -17.5 | bar |
| COMAi125820.533p272546.03 | 194.58555 | 27.42945 | 45 | -18.3 | spiral |
| COMAi125815.275p272752.96 | 194.56364 | 27.46471 | 45 | -17.2 | inclined disk |
| COMAi125814.969p272744.81 | 194.56237 | 27.46244 | 45 | -15.5 | bar + spiral |
| COMAi125825.308p271200.04 | 194.60545 | 27.20001 | 59 | -18.4 | bar + spiral |
| COMAi125623.788p271402.30 | 194.09912 | 27.23397 | 63 | -18.1 | bar + spiral |
| COMAi125638.099p271304.09 | 194.15875 | 27.21780 | 63 | -16.4 | bar |
| COMAi125845.297p274650.75 | 194.68873 | 27.78076 | 75 | -15.3 | bar/inclined disk |
| COMAi125845.906p274655.90 | 194.69126 | 27.78219 | 75 | -14.7 | bar/inclined disk |
Note. — (1) Galaxy ID as given in the Coma Treasury survey DR2 (Hammer et al. 2010); (2) RA (J2000); (3) DEC (J2000); (4) visit number; (5) absolute magnitude in AB mag; (6) type of disk structure detected through unsharp masking (see 4.2).