Absence of long-range superconducting correlations in the frustrated -filled band Hubbard model
Abstract
We present many-body calculations of superconducting pair-pair correlations in the ground state of the half-filled band Hubbard model on large anisotropic triangular lattices. Our calculations cover nearly the complete range of anisotropies between the square and isotropic triangular lattice limits. We find that the superconducting pair-pair correlations decrease monotonically with increasing onsite Hubbard interaction for inter-pair distances greater than nearest neighbor. For the large lattices of interest here the distance dependence of the correlations approaches that for noninteracting electrons. Both these results are consistent with the absence of superconductivity in this model in the thermodynamic limit. We conclude that the effective -filled band Hubbard model, suggested by many authors to be appropriate for the -(BEDT-TTF)-based organic charge-transfer solids, does not explain the superconducting transition in these materials.
pacs:
71.10.Fd,71.30.+h,74.20.MnI Introduction
The two dimensional (2D) Hubbard model has been extensively investigated because at -filling it can successfully describe the antiferromagnetic (AFM) phases found in many strongly-correlated materials. Since AFM phases often occur in materials displaying unconventional superconductivity (SC), such as the high- cuprates and the organic -(BEDT-TTF)2X (hereafter -(ET)2X) charge transfer solid (CTS) superconductors, it has frequently been suggested that some small modification of the model can yield a superconducting state where the residual AFM fluctuations mediate an attractive pairing interaction. In the case of the cuprates, this modification involves a change in the carrier concentration (“doping”); the doped 2D Hubbard model has been intensively investigated with numerous analytic and numerical methods, but whether or not SC occurs within this model is still controversial.
The AFM state in the 2D Hubbard model can also be destroyed at fixed carrier concentration by the introduction of lattice frustration. The model on the anisotropic triangular lattice (see Fig. 1) has been used to describe the -(ET)2X family of CTS, where SC occurs at fixed carrier density under application of moderate pressure. The ET layers here consist of strongly dimerized anisotropic triangular lattices, with the intradimer hopping integrals much larger than the interdimer ones. Each (ET) dimer contains one hole carrier on the average. This has been used to justify replacing each dimer unit cell with a single site, and the underlying -filled cation band with an effective -filled band Kanoda and Kato (2011).
We investigate ground state superconducting pair-pair correlations within the Hamiltonian,
| (1) | |||||
In Eq. 1, creates an electron of spin on site and . is the on-site Hubbard interaction. We consider a square lattice with hopping integral along and -directions and frustrating hopping along the -direction (see Fig. 1). The limits and 1 correspond to the square and the isotropic triangular lattices, respectively. All quantities with dimensions of energy will be expressed hereafter in units of . We consider only the -filled band corresponding to an electron density per site .
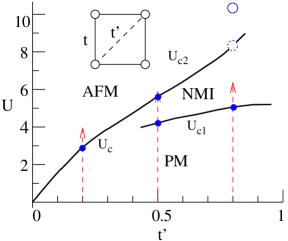
The non-superconducting phases of this model, shown schematically in Fig. 1, are relatively well established. As is increased in strength, frustration destroys the q=(,) AFM ground state, replacing it with either a paramagnetic metallic (PM) state or a non-magnetic insulator (NMI) state Kashima and Imada (2001a); Morita et al. (2002). Numerical calculations on this model and the related model with two diagonal bonds in each plaquette have confirmed the presence of the PM, AFM, and NMI phases Kashima and Imada (2001a); Morita et al. (2002); Watanabe (2003); Parcollet et al. (2004); Mizusaki and Imada (2006); Kyung and Tremblay (2006); Sahebsara and Sénéchal (2006); Koretsune et al. (2007); Clay et al. (2008); Lee et al. (2008); Sahebsara and Sénéchal (2008); Watanabe et al. (2008); Ohashi et al. (2008); Tocchio et al. (2009); Yoshioka et al. (2009); Guertler et al. (2009); Liebsch et al. (2009); Yu and Yin (2010). The NMI phase has been suggested as a candidate state Morita et al. (2002) that explains the apparent quantum spin liquid (QSL) behavior seen in the strongly frustrated -(ET)2Cu2(CN)3 Kanoda and Kato (2011). As the NMI phase has already been extensively investigated Morita et al. (2002); Watanabe (2003); Mizusaki and Imada (2006); Koretsune et al. (2007); Tocchio et al. (2009); Yoshioka et al. (2009), in the present work we will not consider the properties of this phase any further, but will rather focus on the possibility of SC within the model.
Numerous mean-field theories have suggested that unconventional SC occurs adjacent to AFM-PM phase boundaries Schmalian (1998); Kino and Kontani (1998); Kondo and Moriya (1998); Vojta and Dagotto (1999); Baskaran (2003); Liu et al. (2005); Kyung and Tremblay (2006); Sahebsara and Sénéchal (2006); Nevidomskyy et al. (2008). Similar superconducting states have been suggested for the closely related Hubbard-Heisenberg model on the same lattice Gan et al. (2005); Powell and McKenzie (2005); Gan et al. (2006); Powell and McKenzie (2007); Rau and Kee (2011). Because of the proximity of (,) AFM order, the suggested symmetry of the SC order parameter is . For the magnetic ordering q shifts to (,) corresponding to the 120∘ ordering found in the triangular lattice antiferromagnetic Heisenberg model, and consequently superconducting other order parameter symmetries have been suggested Powell and McKenzie (2007). The estimated value of for the -ET materials is however smaller than 1 (see below) Kandpal et al. (2009); Nakamura et al. (2009), and also no evidence for 120∘ AFM order is found experimentally within the -ET family Kanoda and Kato (2011).
Superconducting pair-pair correlations calculated with numerical methods going beyond mean field theory provide a more accurate assessment of the presence of SC, provided finite-size effects can be adequately controlled. Two criteria must be satisfied to confirm SC within the model: (i) the superconducting pair-pair correlations must be enhanced over the values over at least a range of , and (ii) the pair-pair correlations must extrapolate to a finite value at long inter-pair distances. We have previously calculated pair-pair correlations for the 44 lattice using exact diagonalization Clay et al. (2008). No enhancement of the pair-pair correlations by was found in these calculations, except for a trivial short-distance enhancement Clay et al. (2008) (see also below). Our present work allows more careful analyses of the distance dependence of the pair-pair correlations, as well as the U-dependence of the longer-range components of these correlations, that were not possible within the earlier small cluster calculation.
Pair-pair correlations for lattices comparable to those in the present work have also been calculated using variational quantum Monte Carlo (VMC) methods Watanabe et al. (2006); Yokoyama et al. (2006); Watanabe et al. (2008); Tocchio et al. (2009); Guertler et al. (2009). VMC results however depend to a great degree on the choice of the variational wavefunction, and there is considerable differences of opinion within the existing VMC literature. Clearly, studies of pair-pair correlations on large lattices, using many-body methods that do not depend on an a priori choice of the wavefunction are desirable. A candidate method for calculations of strongly-correlated systems is the recently developed Path Integral Renormalization Group (PIRG) method Imada and Kashima (2000); Kashima and Imada (2001b); Mizusaki and Imada (2004); Imada and Mizusaki (2006). Like VMC, PIRG is also variational and does not suffer from a fermion sign problem as do standard quantum Monte Carlo methods. Unlike VMC methods however, instead of an assumed functional form of the wavefunction, PIRG uses an unconstrained sum of Slater determinants that is optimized using a renormalization procedure Imada and Kashima (2000); Kashima and Imada (2001b); Mizusaki and Imada (2004); Imada and Mizusaki (2006). The NMI phase within Eq. 1 was first identified using PIRG Kashima and Imada (2001a); Morita et al. (2002). Previous PIRG calculations Kashima and Imada (2001a); Morita et al. (2002); Mizusaki and Imada (2006); Watanabe (2003); Yoshioka et al. (2009) investigated the metal-insulator transition, AFM ordering, and properties of the NMI phase in detail, but did not discuss superconducting pair-pair correlations. Here we revisit the model with PIRG and calculate pair-pair correlations as a function of and . As explained in Section III, we use the most accurate version of the PIRG ground-state method, Quantum Projection-PIRG (QP-PIRG), which combines symmetries with the renormalization procedure Mizusaki and Imada (2004). As explained in Section III, we also performed an “annealing” procedure to help prevent the method from converging to local minima.
While early tight-binding bandstructures calculated using the extended Hückel method found some -ET superconductors to have nearly isotropic triangular lattices with , recent ab-initio methods have determined that in the experimental systems lie within the range Kandpal et al. (2009); Nakamura et al. (2009). Importantly, in this range of anisotropy the 120∘ AFM order is not relevant. Furthermore, the AFM order is known experimentally to be of the conventional Neél pattern Miyagawa et al. (1995, 2002). Consequently, we limit our calculations to . Specifically, we perform our calculations for three distinct , 0.5, and 0.8, as shown in Fig. 1. The two large values chosen bracket the estimated frustration in the -ET superconductors Kandpal et al. (2009); Nakamura et al. (2009). We choose a smaller in addition because it has been suggested in some studies that SC is present even in the weakly frustrated region of the phase diagram Powell and McKenzie (2007); Nevidomskyy et al. (2008); Guertler et al. (2009). The phase diagram (Fig. 1) is qualitatively different at because the NMI phase does not occur for Kashima and Imada (2001a); Morita et al. (2002); Mizusaki and Imada (2006). While the estimate for degree of frustration is remarkably consistent between different ab-inito methods Kandpal et al. (2009); Nakamura et al. (2009), the estimated value of for -(ET)2X is less certain. We therefore perform our calculations over a range of starting from .
II Order parameters
To determine whether SC is present near the metal-insulator (MI) transition, in addition to superconducting correlations we need order parameters to distinguish between metallic and insulating phases. To locate the MI transition we use two different quantities. The first is the double occupancy . As increases, a discontinuous decrease in occurs at the MI transition Morita et al. (2002). In addition, we calculate the bond order between sites and ,
| (2) |
In the following we have labeled the bond order between sites linked by the bond as . This particular bond order is nonzero in the PM phase but tends to zero in the AFM Neél ordered phase because there electrons on sites connected by have parallel spin projections Clay et al. (2008).
The operator creates a singlet pair on lattice sites and :
| (3) |
The pair-pair correlation function is defined as
| (4) |
In Eq. 4 the phase factor determines the symmetry of the superconducting order parameter. We consider two possible pairing symmetries, pairing ( in our nomenclature below) where and , and pairing () where and .
In the presence of superconducting long-range order, for the ground state in the appropriate pairing channel must converge to a nonzero value for . This is seen clearly for example in the 2D Hubbard model Scalettar et al. (1989); Moreo et al. (1992); Huscroft and Scalettar (1998). In the thermodynamic limit the long-distance limit of the pair-pair correlation function, , is proportionalAimi and Imada (2007) to the square of the superconducting order parameter, . The magnitude of may further be used to set limitsAimi and Imada (2007) on the superconducting condensation energy, gap amplitude, and .
III Method
The PIRG method has been previously used for a variety of strongly-correlated systems including the 2D Hubbard model Kashima and Imada (2001b), -filled frustrated 2D Hubbard models Kashima and Imada (2001a); Morita et al. (2002); Mizusaki and Imada (2004, 2006); Yoshioka et al. (2009), and the -filled Hubbard model on the checkerboard lattice Yoshioka et al. (2008a, b). Details of the method are well described in these references. Here we discuss details of our PIRG implementation, and present comparisons with exact results which demonstrate the accuracy of the method for calculating pair-pair correlations.
The PIRG method uses a basis of Slater determinants, . For this coincides with the Hartree-Fock (HF) approximation. In practical calculations, maximum ’s of a few hundred are used. The method is initialized with the HF wavefunction or a similar random starting wavefunction, and the PIRG renormalization procedure Kashima and Imada (2001b) is used to minimize the energy by optimizing through the action of the operator . One potential problem with the PIRG renormalization procedure is that the method can become trapped in a local minimum and not reach the true ground state Yoshioka et al. (2008a). Yoshioka et al. introduced a technique for avoiding local trapping by introducing global modifications to the wavefunction Yoshioka et al. (2008a). Following Ref. Yoshioka et al., 2008a, we also introduced similar global modifications of the PIRG wavefunctions (“iteration A” in Ref. Yoshioka et al., 2008a), which modify determinants in a global manner by acting on the wavefunction with defined by a random set of Hubbard-Stratonovich variables. In addition, we also introduced updates to the based on adding a random variation to the matrix elements of . The amplitude of the variations is decreased systematically in a manner similar to simulated annealing. We found the addition of these two global updates to significantly improve the accuracy of the results.
We also incorporated lattice and spin-parity symmetries in the calculation Mizusaki and Imada (2004). Reference Mizusaki and Imada, 2004 introduced two different methods of using symmetry projection: (i) PIRG-QP, where symmetry projectors are applied to the ground state wavefunction after it has optimized using PIRG; and (ii) QP-PIRG, where symmetry projectors are applied at each step of the PIRG optimization. Here we have used the second more accurate of these two approaches, QP-PIRG. The lattice symmetries we used included translation, inversion, and mirror-plane symmetries, a total of 4 symmetries where is the number of lattice sites. We also applied the spin-parity projection operator after the PIRG process. An advantage of QP-PIRG is that much smaller basis sizes can be used Mizusaki and Imada (2004).
Following reference Kashima and Imada, 2001b we define the energy variance . is used to correct for the finite basis size . For each set of parameters we performed the annealing and A iterations for successively larger basis sizes . Each correlation function was then extrapolated to by performing a linear fit. The error bars reported in our results are the standard errors estimated from the linear fit. The largest used here for 66 and 88 lattices was 256. The smallest results we used in the fitting process depended on the value of : for we found that even as small as 4 fit gave a good linear variance extrapolation, while for larger we only used results in the fit.
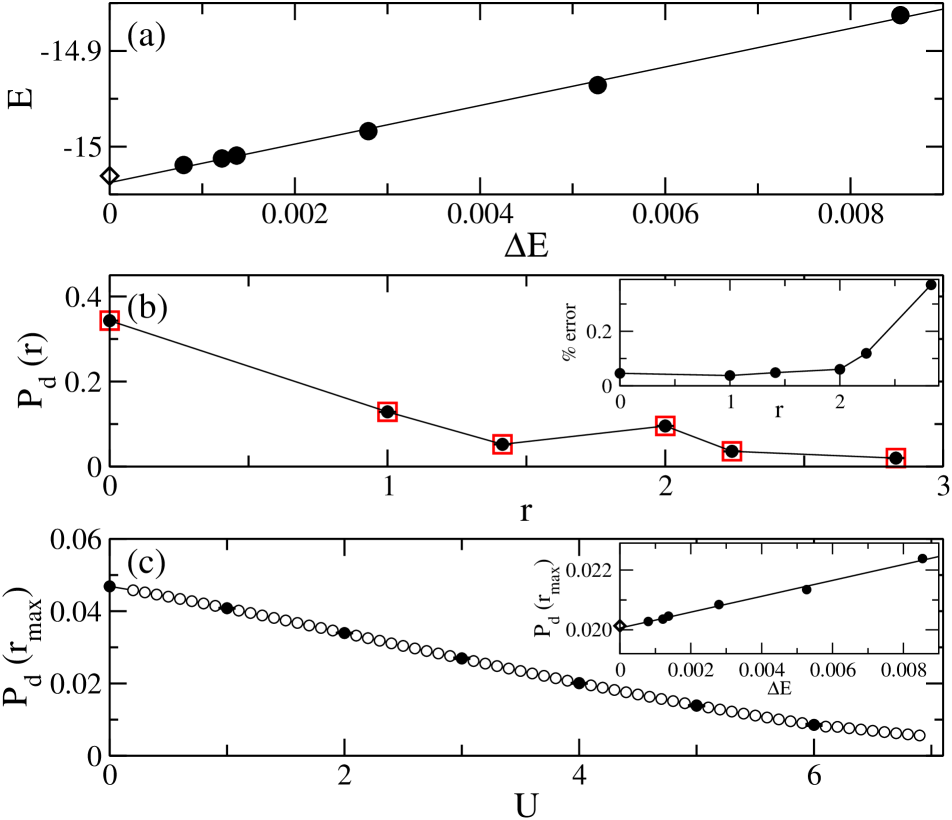
In Fig. 2, we compare results from our PIRG code with exact diagonalization results for the 44 lattice Clay et al. (2008). Here of up to 256 were used. Fig. 2(a) shows the variance extrapolation of the energy for . The extrapolated value for ground state energy is -15.0370.002 compared to the exact ground state of -15.031. In Fig. 2(b) we plot the pair-pair correlation as a function of distance for =4. The inset shows the percent relative error in as a function of . The maximum relative error is for =2 and is smaller than 0.4. Fig. 2(c) shows the d-wave correlation at the furthest distance, as a function of for 44, . The inset here shows the variance extrapolation for for =4. Again, as in Fig. 2(a) the extrapolation of the physical quantity is well within the statistical error.
Our PIRG code was further verified against quantum Monte Carlo (QMC) results for larger lattices in the limit where QMC does not suffer from the fermion sign problem at -filling. For the lattice, the QMC estimate for the ground state energy Mizusaki and Imada (2004) of Eq. 1 with and is = -30.870.05. Previous QP-PIRG calculations using lattice translations and spin-parity during the PIRG projection process, followed by a total-spin projection obtainedMizusaki and Imada (2004) = -30.879. The extrapolated energy with our choice of 4 lattice symmetries, spin-parity projection, and a maximum of 256 was almost identical, =-30.890.04.
IV Results
IV.1
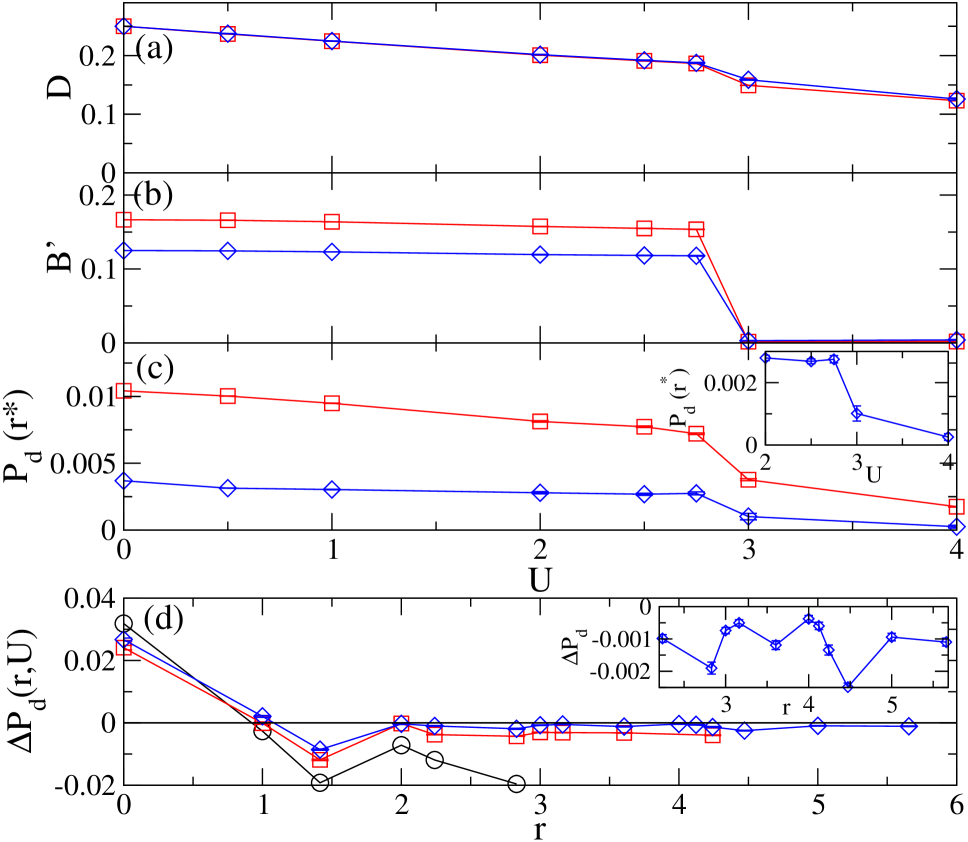
At a single transition is expected between PM and AFM phases Morita et al. (2002); Clay et al. (2008). In Fig. 3(a)-(b) we plot and as a function of . The transition from the PM to an insulating phase is clearly seen as a discontinuous decrease in and at . is only weakly size dependent at —for the 44 latticeClay et al. (2008) , while for and lattices we found 2.753.00. We estimate 2.7 in the thermodynamic limit.
For all of the values we considered, we found that pair-pair correlations were of larger magnitude than correlations (in Section IV.3 below we show an explicit comparison between the two). Fig. 3(c) shows the pair-pair correlations as a function of . The distance is defined as the next-to-furthest possible separation between two lattice points on the finite lattice; , 3.61, 5.00 for 44, 66, and 88 lattices, respectively. Here we use rather than the furthest distance because of finite-size effectsAimi and Imada (2007) associated with . The 44 correlations are considerably larger in magnitude because of the larger on that lattice and we have not included them on Fig. 3(c). As seen in Fig. 3(c), has a tendency to decrease monotonically with and is smaller at all nonzero compared to . At decreases discontinuously.
In addition to the -dependence, it is also important to examine the distance-dependence of pair-pair correlations. In Fig. 3(d) we plot , defined as , as a function of for =2.75. Positive indicates enhanced pairing correlations over the noninteracting limit. We choose in the PM state and close to the PM-AFM boundary where the greatest enhancement of pair-pair correlations from AFM fluctuations might be expected from prior work. Fig. 3(d) includes the exact as well. Our results in Figs. 3(c)-(d) show that as the system size increases, the long-range pair-pair correlation function approaches that of noninteracting fermions. We have confirmed similar behavior of , viz., absence of enhancement for other values of (not shown here) in either the PM or AFM regions.
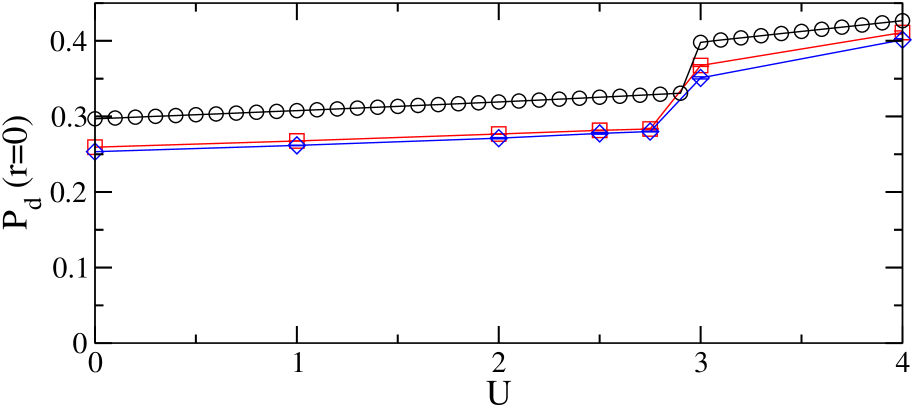
As seen in Fig. 3(d), the only enhancement by in the pairing correlations is at . The enhancement occurs because contains a component proportional to the nearest-neighbor spin-spin correlation function; the enhancement of AFM order by leads to an increaseAimi and Imada (2007) in . In Fig. 4 we plot as a function of . Precisely at there is a discontinuous increase in , even as the system becomes semiconducting, due to the increase in the magnitude of AFM spin-spin correlations. Importantly, only pair separations of should be used to judge the enhancement of pairing correlations, because for pairs overlap on the lattice Clay et al. (2008). Here we find that for distances beyond nearest-neighbor pair separation always decrease monotonically with increasing . As we discuss further in Section V, the spurious increase of short-range correlations is the primary reason that mean-field calculations find SC near the MI transition.
IV.2
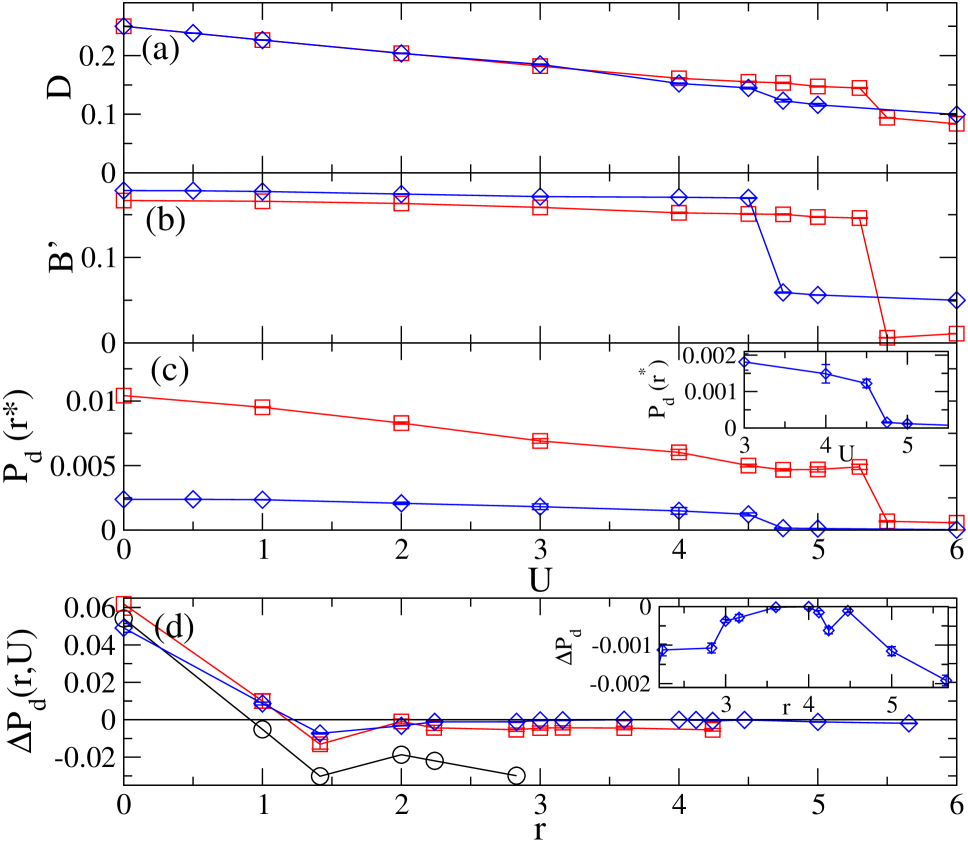
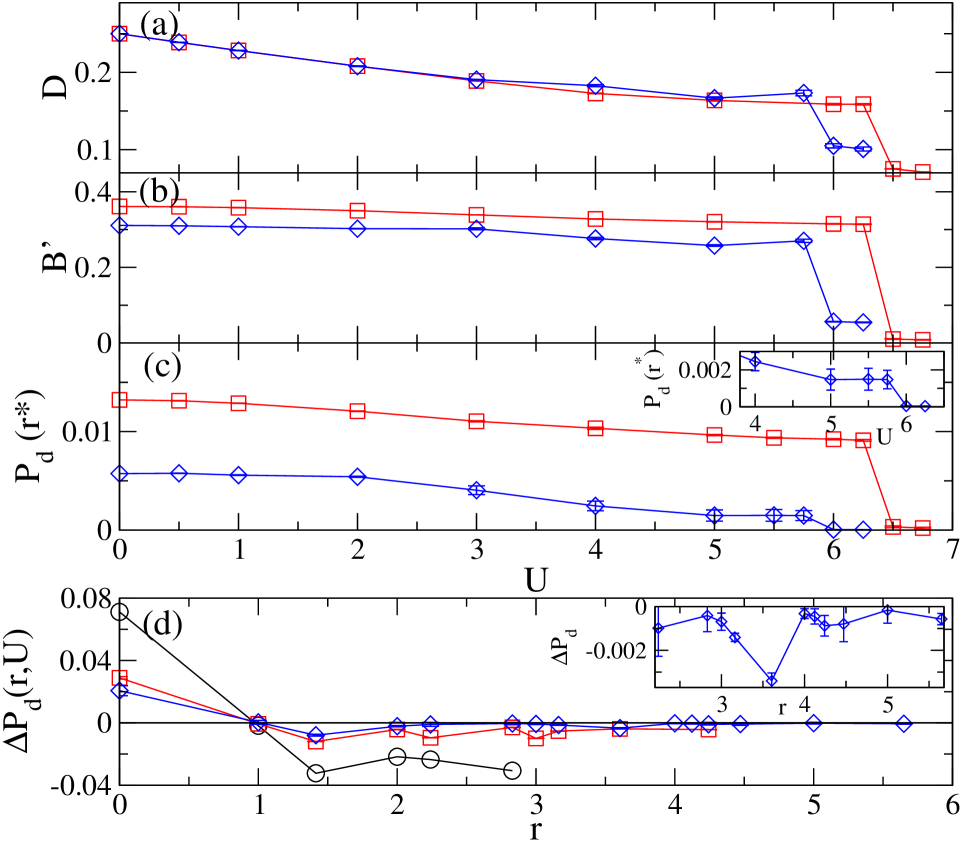
Fig. 5 shows , , and for . Not surprisingly, compared to , depends here more strongly on lattice size, decreasing with increasing system size ( and in the 66 and lattices, respectively). Previous PIRG calculations found after performing finite-size scaling Morita et al. (2002). Our results are consistent with this value.
In contradiction to (see Fig. 3(b)), here is nonzero on the insulating side of the MI transition, suggesting that the nature of the insulating phase is different. We have also calculated the spin structure factor (not shown here). For , a peak appears in at . However, appears to extrapolate to zero as , based on the three lattice sizes we have considered. This indicates that the system does not have long-range AFM order at for , consistent with the NMI phase previously identified in this parameter region Kashima and Imada (2001a); Morita et al. (2002). Note that the larger in the NMI phase than in the AFM phase is also consistent with our previous exact diagonalization calculation (see Fig. 2 in Ref. Clay et al., 2008.) The properties of the NMI phase and the subsequent NMI-AFM transition at even larger have both been extensively discussed in the literature before Kashima and Imada (2001a); Morita et al. (2002); Watanabe (2003); Mizusaki and Imada (2006); Tocchio et al. (2009); Yoshioka et al. (2009). Here therefore we focus on the strength of pair-pair correlations as a function of and distance.
Fig. 5(c) shows as a function of . As at , decreases monotonically with . At , decreases discontinuously and is of very small magnitude in the NMI phase. The magnitude of does not increase as is increased further approaching the AFM phase. Fig. 5(d) shows as a function of distance for =0.5 for =4.5. As in Fig. 4, at increases at the MI transition due to the increase in strength of nearest-neighbor AFM correlations, while long distance correlations are again weaker at nonzero than at .
IV.3
Our results for , shown in Fig. 6, are similar to those for . Here the PM region extends to somewhat largerMorita et al. (2002) . As at and there is no enhancement of the pairing correlations. again shows an increase at the MI transition. From finite-size scaling we estimated the value for = 5.0 0.3 from our data. This value is identical to earlier resultsMorita et al. (2002).
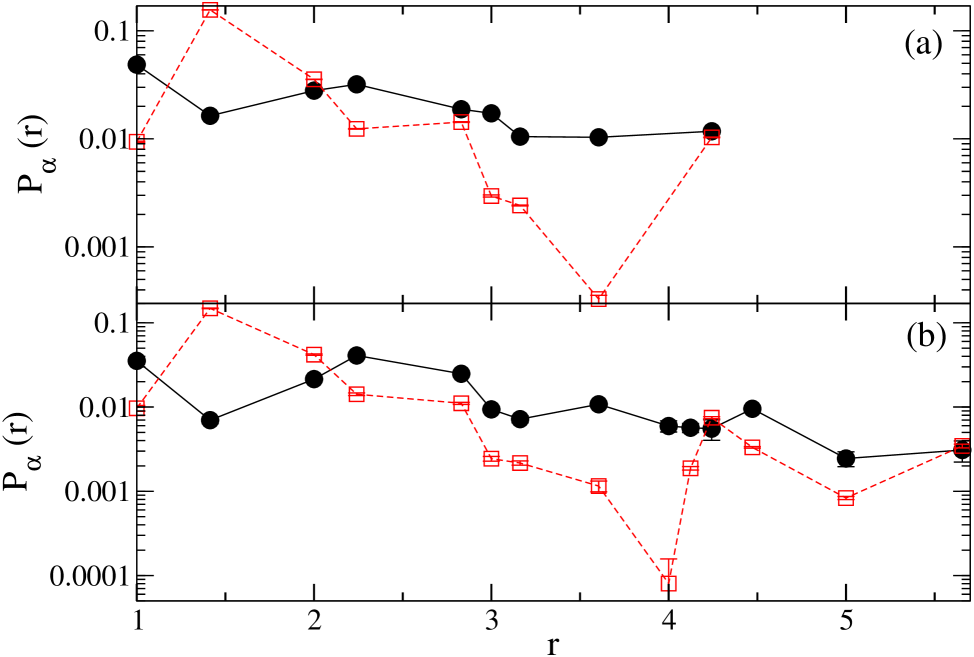
Several authors have suggested that the symmetry of the superconducting order parameter changes from to or in the region of the phase diagram close to the isotropic triangular lattice limit Liu et al. (2005); Powell and McKenzie (2007). In Fig. 7 we compare the and correlations for as a function of . Except at specific small where pairs can overlap each other on the latticeClay et al. (2008), we find that correlations are always stronger than correlations. Plots of the versus also show a monotonic decrease with increasing , and similarly approaches zero for large .
V Discussion
In Section IV we presented superconducting pair-pair correlations for the ground state of the -filled band Hubbard model on the anisotropic triangular lattice calculated using the PIRG method. Our main results are that (i) in all cases the superconducting pair-pair correlations at all finite are clearly weaker than in the noninteracting limit, except for an enhancement of the very short-range component, and (ii) at large distances the distance dependence of the pair-pair correlations approaches that of the noninteracting system. These results, in conjunction with earlier exact diagonalization results Clay et al. (2008), which show exactly the same trends, strongly suggest that the superconductivity is not present in the model. Since many of the earlier works did find SC within the same model Hamiltonian, it is useful to compare these approaches and results with ours. Broadly speaking, two different kinds of methods had predicted SC within the triangular lattice Hubbard model, mean-field and the VMC. We discuss them separately.
Mean-field approaches: In all cases, mean-field methods find a superconducting phase between the PM and AFM phases Kino and Kontani (1998); Kondo and Moriya (1998); Kyung and Tremblay (2006); Sahebsara and Sénéchal (2006). A NMI phase is found by some mean-field methodsKino and Kontani (1998); Kyung and Tremblay (2006); Sahebsara and Sénéchal (2006) but not othersKondo and Moriya (1998). However, there are further inconsistencies—for example, the paramagnetic insulating (PMI) phase in reference Kino and Kontani, 1998 in some regions of the phase diagram unrealistically occurs at a temperature higher than that of the PM phase. In the NMI phase the nearest-neighbor AFM correlations are strong but AFM long-range order is not present. At fixed , increasing drives the system from the PM to NMI phases. Upon entering the NMI the correlation at increases in strength because the correlation is proportional to the nearest-neighbor spin-spin correlations. Our present results show that at the same time as this trivial short-range correlation increases, the strength of longer-ranged correlations decrease greatly. Mean-field methods cannot capture these longer-ranged correlations and erroneously extrapolate from the short-distance limit.
VMC: Within VMC a functional form for the wavefunction is assumed at the outset. The three different phases found for intermediate (PM, NMI, and AFM) require three different assumptions for the functional form of the wavefunction. This makes determining the true ground state behavior extremely difficult using VMC, especially near the phase boundaries. PIRG uses instead an unconstrained superposition of Slater determinants which does not suffer from these problems. The assumption of a functional form is a serious disadvantage as evidenced from the variety of results from different VMC studies which are not consistent with one another. For example, reference Watanabe et al., 2006 did find SC in the model, while a later study by the same authors did not Watanabe et al. (2008). Liu et al. assume that the wavefunction is a Gutzwiller projected BCS function and find SC Liu et al. (2005). The appropriateness of such a wavefunction to describe SC is however a controversial assumption—Tocchio et al for example did not find SC within the same assumed wavefunction form Tocchio et al. (2009). The occurrence of the NMI phase within VMC methods seems to be as much of a problem as within mean-field methods—Tocchio et al do not find evidence for NMI at =0.6 while PIRG does Morita et al. (2002); Tocchio et al. (2009).
SC has also been found in several models that are closely related to the -filled Hubbard model on the anisotropic triangular lattice. These include the Hubbard-Heisenberg model Gan et al. (2005); Powell and McKenzie (2005); Gan et al. (2006); Powell and McKenzie (2007); Guertler et al. (2009); Rau and Kee (2011), and the Hubbard model with two diagonal bonds per square plaquette Yokoyama et al. (2006); Nevidomskyy et al. (2008). While we cannot compare directly our PIRG results with these models, in nearly all cases the methods used to study these models are identical to those that have erroneously predicted SC within the present model. We have begun a reinvestigation of these models.
We now return to the superconducting phase found in the organic CTS. Our results here cover the entire parameter region () thought to be appropriateKandpal et al. (2009); Nakamura et al. (2009) for the -phase CTS superconductors within the effective Hubbard model description for them, and clearly indicate that the -filled band Hubbard model is not sufficient to explain the occurrence of SC in -ET. It is important in this context to recall that in many CTS superconductors the insulator-superconductor transition is not from an AFM phase but from a different kind of exotic insulator. Examples include -(ET)2Cu2(CN)3, which lacks long-range AFM order even at the lowest temperatures of measurement and has been considered a QSL candidate Kanoda and Kato (2011), but is superconducting under pressure Kurosaki et al. (2005), and other CTS superconductors where the insulating phase adjacent to superconductivity is nonmagnetic and charge-ordered (CO) Dressel (2011). Once again mean-field theory, now within the -field band extended Hubbard Hamiltonian on anisotropic triangular lattices has suggested the possibility of a charge fluctuation mediated CO–SC transition Merino and McKenzie (2001). Based on our present work, there are reasons to doubt mean-field approaches to SC within correlated-electron models in general and these earlier results should be checked through many-body calculations.
The different natures of the unconventional semiconductors proximate to SC in the CTS confront theorists with a unique challenge. While mean-field theories suggest a different mechanism for each different semiconductor-superconductor transition, it appears unlikely to us that structurally similar materials, with identical molecular components in some cases, should require different mechanisms for SC. Given how difficult a problem correlated-electron SC has turned out to be we suggest that an alternate approach is to determine first how to construct a theoretical framework within which a unified theory of SC begins to look feasible, and then to search for the same. We have recently shown how it may be possible to construct such a framework for the CTS Li et al. (2010); Dayal et al. (2011); Mazumdar and Clay (2011); Mazumdar et al. (2012). In this picture, the -(ET)2X and other dimerized CTS should be described in terms of the underlying -filled band as with the other CTS superconductors Li et al. (2010); Dayal et al. (2011). In the presence of strong dimerization and relatively weak frustration, AFM wins. Under increasing frustration though, a transition occurs from AFM with uniform charge density on each dimer to a charge-ordered paired singlet state we have termed the Paired Electron Crystal (PEC) Li et al. (2010); Dayal et al. (2011). Experimental examples of the PEC in 2D CTS include -(meso-DMBEDT-TTF)2PF6 (reference Kimura et al., 2006) and -EtMe3P[Pd(dmit)2]2 (references Tamura and Kato, 2009; Yamamoto et al., 2011), which have precisely the same CO and bond patterns as in the PEC model Li et al. (2010); Dayal et al. (2011), and are superconducting under pressure. The application of pressure corresponds to a further increase in frustration and gives the possibility of a paired electron liquid superconductor Mazumdar and Clay (2008), a realization of the charged boson SC first proposed by Schafroth Schafroth (1955). Although more work will be necessary to prove this, this theoretical approach has the advantage that it leads to a single model for correlated-electron SC in the CTS. Even more interestingly, we have pointed out that there exist several frustrated strongly correlated inorganic -filled superconductors that can perhaps be described within the same model Dayal et al. (2011); Mazumdar and Clay (2011); Mazumdar et al. (2012).
Finally, the experimental observation of AFM Iwasa and Takenobu (2003) in expanded fullerides A3C60 has led to the modeling of these compounds in terms of a 3D nondegenerate -filled band Hubbard model Capone et al. (2009). The threefold degeneracy of the lowest antibonding molecular orbitals in C60 is removed by Jahn-Teller instability Iwasa and Takenobu (2003); Capone et al. (2009). The observation of a spingap in the antiferromagnetic state validates the nondegenerate description Capone et al. (2009). The dynamic mean-field theory (DMFT) proposed for the AFM to SC transition in the fullerides within this 3D effective -filled band Hubbard model Capone et al. (2009) is however very similar to the DMFT theories of SC in the 2D CTS Kyung and Tremblay (2006). Our results here suggest that a reexamination of the spin-fluctuation mechanism of SC in the fullerides may also be called for.
VI Acknowledgments
This work was supported by the US Department of Energy grant DE-FG02-06ER46315. RTC thanks the Institute for Solid State Physics of the University of Tokyo for hospitality while on sabbatical where a portion of this work was completed.
References
- Kanoda and Kato (2011) K. Kanoda and R. Kato, Annu. Rev. Condens. Matter Phys. 2, 167 (2011).
- Kashima and Imada (2001a) T. Kashima and M. Imada, J. Phys. Soc. Jpn. 70, 3052 (2001a).
- Morita et al. (2002) H. Morita, S. Watanabe, and M. Imada, J. Phys. Soc. Jpn. 71, 2109 (2002).
- Watanabe (2003) S. Watanabe, J. Phys. Soc. Jpn. 72, 2042 (2003).
- Parcollet et al. (2004) O. Parcollet, G. Biroli, and G. Kotliar, Phys. Rev. Lett. 92, 226402 (2004).
- Mizusaki and Imada (2006) T. Mizusaki and M. Imada, Phys. Rev. B 74, 014421 (2006).
- Kyung and Tremblay (2006) B. Kyung and A. M. S. Tremblay, Phys. Rev. Lett. 97, 046402 (2006).
- Sahebsara and Sénéchal (2006) P. Sahebsara and D. Sénéchal, Phys. Rev. Lett. 97, 257004 (2006).
- Koretsune et al. (2007) T. Koretsune, Y. Motome, and A. Furusaki, J. Phys. Soc. Jpn. 76, 074719 (2007).
- Clay et al. (2008) R. T. Clay, H. Li, and S. Mazumdar, Phys. Rev. Lett. 101, 166403 (2008).
- Lee et al. (2008) H. Lee, G. Li, and H. Monien, Phys. Rev. B 78, 205117 (2008).
- Sahebsara and Sénéchal (2008) P. Sahebsara and D. Sénéchal, Phys. Rev. Lett. 100, 136402 (2008).
- Watanabe et al. (2008) T. Watanabe, H. Yokoyama, Y. Tanaka, and J. Inoue, Phys. Rev. B 77, 214505 (2008).
- Ohashi et al. (2008) T. Ohashi, T. Momoi, H. Tsunetsugu, and N. Kawakami, Phys. Rev. Lett. 100, 076402 (2008).
- Tocchio et al. (2009) L. F. Tocchio, A. Parola, C. Gros, and F. Becca, Phys. Rev. B 80, 064419 (2009).
- Yoshioka et al. (2009) T. Yoshioka, A. Koga, and N. Kawakami, Phys. Rev. Lett. 103, 036401 (2009).
- Guertler et al. (2009) S. Guertler, Q. H. Wang, and F. C. Zhang, Phys. Rev. B 79, 144526 (2009).
- Liebsch et al. (2009) A. Liebsch, H. Ishida, and J. Merino, Phys. Rev. B 79, 195108 (2009).
- Yu and Yin (2010) Z. Q. Yu and L. Yin, Phys. Rev. B 81, 195122 (2010).
- Schmalian (1998) J. Schmalian, Phys. Rev. Lett. 81, 4232 (1998).
- Kino and Kontani (1998) H. Kino and H. Kontani, J. Phys. Soc. Jpn. 67, 3691 (1998).
- Kondo and Moriya (1998) H. Kondo and T. Moriya, J. Phys. Soc. Jpn. 67, 3695 (1998).
- Vojta and Dagotto (1999) M. Vojta and E. Dagotto, Phys. Rev. B 59, R713 (1999).
- Baskaran (2003) G. Baskaran, Phys. Rev. Lett. 90, 197007 (2003).
- Liu et al. (2005) J. Liu, J. Schmalian, and N. Trivedi, Phys. Rev. Lett. 94, 127003 (2005).
- Nevidomskyy et al. (2008) A. H. Nevidomskyy, C. Scheiber, D. Sénéchal, and A.-M. S. Tremblay, Phys. Rev. B 77, 064427 (2008).
- Gan et al. (2005) J. Y. Gan, Y. Chen, Z. B. Su, and F. C. Zhang, Phys. Rev. Lett. 94, 067005 (2005).
- Powell and McKenzie (2005) B. J. Powell and R. H. McKenzie, Phys. Rev. Lett. 94, 047004 (2005).
- Gan et al. (2006) J. Y. Gan, Y. Chen, and F. C. Zhang, Phys. Rev. B 74, 094515 (2006).
- Powell and McKenzie (2007) B. J. Powell and R. H. McKenzie, Phys. Rev. Lett. 98, 027005 (2007).
- Rau and Kee (2011) J. G. Rau and H.-Y. Kee, Phys. Rev. Lett. 106, 056405 (2011).
- Kandpal et al. (2009) H. C. Kandpal, I. Opahle, Y.-Z. Zhang, H. O. Jeschke, and R. Valentí, Phys. Rev. Lett. 103, 067004 (2009).
- Nakamura et al. (2009) K. Nakamura, Y. Yoshimoto, T. Kosugi, R. Arita, and M. Imada, J. Phys. Soc. Jpn. 78, 083710 (2009).
- Watanabe et al. (2006) T. Watanabe, H. Yokoyama, Y. Tanaka, and J. Inoue, J. Phys. Soc. Jpn. 75, 074707 (2006).
- Yokoyama et al. (2006) H. Yokoyama, M. Ogata, and Y. Tanaka, J. Phys. Soc. Jpn. 75, 114706 (2006).
- Imada and Kashima (2000) M. Imada and T. Kashima, J. Phys. Soc. Jpn. 69, 2723 (2000).
- Kashima and Imada (2001b) T. Kashima and M. Imada, J. Phys. Soc. Jpn. 70, 2287 (2001b).
- Mizusaki and Imada (2004) T. Mizusaki and M. Imada, Phys. Rev. B 69, 125110 (2004).
- Imada and Mizusaki (2006) M. Imada and T. Mizusaki, in Effective models for low-dimensional strongly-correlated systems, edited by G. G. Batrouni and D. Poilblanc (AIP Conference Proceedings, New York, 2006), vol. 816, pp. 78–91.
- Miyagawa et al. (1995) K. Miyagawa, A. Kawamoto, Y. Nakazawa, and K. Kanoda, Phys. Rev. Lett. 75, 1174 (1995).
- Miyagawa et al. (2002) K. Miyagawa, A. Kawamoto, and K. Kanoda, Phys. Rev. Lett. 89, 017003 (2002).
- Scalettar et al. (1989) R. T. Scalettar, E. Y. Loh, J. E. Gubernatis, A. Moreo, S. R. White, D. J. Scalapino, R. L. Sugar, and E. Dagotto, Phys. Rev. Lett. 62, 1407 (1989).
- Moreo et al. (1992) A. Moreo, D. J. Scalapino, and S. R. White, Phys. Rev. B 45, 7544 (1992).
- Huscroft and Scalettar (1998) C. Huscroft and R. T. Scalettar, Phys. Rev. Lett. 81, 2775 (1998).
- Aimi and Imada (2007) T. Aimi and M. Imada, J. Phys. Soc. Jpn. 76, 113708 (2007).
- Yoshioka et al. (2008a) T. Yoshioka, A. Koga, and N. Kawakami, J. Phys. Soc. Jpn. 77, 104702 (2008a).
- Yoshioka et al. (2008b) T. Yoshioka, A. Koga, and N. Kawakami, Phys. Rev. B 78, 165113 (2008b).
- Kurosaki et al. (2005) Y. Kurosaki, Y. Shimizu, K. Miyagawa, K. Kanoda, and G. Saito, Phys. Rev. Lett. 95, 177001 (2005).
- Dressel (2011) M. Dressel, J. Phys.: Condens. Matter 23, 293201 (2011).
- Merino and McKenzie (2001) J. Merino and R. H. McKenzie, Phys. Rev. Lett. 87, 237002 (2001).
- Li et al. (2010) H. Li, R. T. Clay, and S. Mazumdar, J. Phys.: Condens. Matter 22, 272201 (2010).
- Dayal et al. (2011) S. Dayal, R. T. Clay, H. Li, and S. Mazumdar, Phys. Rev. B 83, 245106 (2011).
- Mazumdar and Clay (2011) S. Mazumdar and R. T. Clay Phys. Status Solidi B (2012), in press, corrected proof http://dx.doi.org/10.1002/pssb.201100723.
- Mazumdar et al. (2012) S. Mazumdar, R. T. Clay, and H. Li, Physica B (2012), in press, corrected proof http://dx.doi.org/10.1016/j.physb.2012.01.016.
- Kimura et al. (2006) S. Kimura, H. Suzuki, T. Maejima, H. Mori, J. Yamaura, T. Kakiuchi, H. Sawa, and H. Moriyama, J. Am. Chem. Soc. 128, 1456 (2006).
- Tamura and Kato (2009) M. Tamura and R. Kato, Sci. Technol. Adv. Mater. 10, 024304 (2009).
- Yamamoto et al. (2011) T. Yamamoto, Y. Nakazawa, M. Tamura, A. Nakao, Y. Ikemoto, T. Moriwaki, A. Fukaya, R. Kato, and K. Yakushi, J. Phys. Soc. Jpn. 80, 123709 (2011).
- Mazumdar and Clay (2008) S. Mazumdar and R. T. Clay, Phys. Rev. B 77, 180515(R) (2008).
- Schafroth (1955) M. R. Schafroth, Phys. Rev. 100, 463 (1955).
- Iwasa and Takenobu (2003) Y. Iwasa and T. Takenobu, J. Phys.: Condens. Matter 15, R495 (2003).
- Capone et al. (2009) M. Capone, M. Fabrizio, C. Castellani, and E. Tosatti, Rev. Mod. Phys. 81, 943 (2009).