UV Properties of Galactic Globular Clusters with GALEX I. The Color-Magnitude Diagrams
Abstract
We present GALEX data for 44 Galactic globular clusters obtained during 3 GALEX observing cycles between 2004 and 2008. This is the largest homogeneous data set on the UV photometric properties of Galactic globular clusters ever collected. The sample selection and photometric analysis are discussed, and color-magnitude diagrams are presented. The blue and intermediate-blue horizontal branch is the dominant feature of the UV color-magnitude diagrams of old Galactic globular clusters. Our sample is large enough to display the remarkable variety of horizontal branch shapes found in old stellar populations. Other stellar types that are obviously detected are blue stragglers and post core-He burning stars. The main features of UV color-magnitude diagrams of Galactic globular clusters are briefly discussed. We establish the locus of post-core He burning stars in the UV color-magnitude diagram and present a catalog of candidate AGB-manqué, post early-AGB, and post-AGB stars within our cluster sample.
The authors dedicate this paper to the memory of co-author Bob Rood, a pioneer in the theory of the evolution of low mass stars, and a friend, who sadly passed away on 2 November 2011.
1 Introduction
It is fair to say that the last frontier of our growing understanding of the physics of old stellar populations resides in the ultra-violet (UV). The behavior of old stellar populations in the UV has puzzled astronomers for almost four decades now, and in spite of major recent progress, there are still important gaps in our understanding of the nature of the stars that dominate the integrated light of old stellar populations in the UV—particularly the far-UV (FUV, e.g., Ferraro et al., 1998; O’Connell, 1999; Moehler, 2001; Catelan, 2009). These include the extreme horizontal branch (EHB) and Blue-Hook (BHk) stars, at the hot and visually faint end of the horizontal branch (HB), and the short-lived but more luminous supra-HB and post-asymptotic-giant-branch (PAGB) stars. Another population whose nature is still not entirely well understood is that of blue straggler stars, which at the characteristic ages of Galactic globular clusters (GCs) are not hot enough to contribute substantially to the integrated FUV light, but are an important source of near-UV light (NUV, e.g., Ferraro et al., 2001, 2003), and are in some cases detectable in integrated light longward of 3400 (e.g., Trager et al., 2005; Schiavon, 2007).
The UV properties of old stellar populations have been a subject of intense scrutiny ever since the discovery of the “UV-upturn” of early-type galaxies (Code 1969). While it has become clear in the past decade or so that EHBs are responsible for most of the “excess” UV emission observed in old stellar populations (e.g., Greggio & Renzini, 1990, 1999; Dorman et al., 1995; O’Connell, 1999; Brown et al., 2001), our understanding of the physics underlying the structure and evolution of such stars is still plagued by theoretical uncertainties. Undeniably, uncertainties are partly due to the absence of an accurate, comprehensive, statistically representative, homogeneous dataset presenting the colors and magnitudes of the stars responsible for the UV emission in Galactic GCs—in spite of painstaking observational efforts by a number of groups (for reviews see, e.g., O’Connell, 1999; Moehler, 2001). A database of that kind would also have important applications for studies of extra-galactic stellar populations, as it could be used to unveil correlations between features in the color-magnitude diagrams (CMDs) of stellar populations and their integrated properties. Such correlations can help understand the nature of distant systems, for which only integrated properties are available. In particular, direct comparisons between integrated UV properties of Galactic and extra-galactic GCs (e.g., Sohn et al., 2006; Rey et al., 2007, 2009) can lend insights on the stellar population content of those systems (Dalessandro et al. 2012, in preparation, hereafter Paper II).
With this motivation in mind, we decided to use the Galaxy Evolution Explorer (GALEX) to undertake the largest ever systematic and homogeneous census of the UV properties of Galactic GCs. Data were collected for 44 clusters in 3 GALEX cycles, from which UV CMDs and integrated colors were obtained. This paper discusses the sample selection and the photometric analysis of the data. Some of the data have been used in combination with HST and ground-based observations for multi-band photometric investigations of the stellar populations of NGC 1904 (Lanzoni et al., 2007) and M 2 (Dalessandro et al., 2009), from the innermost regions to the extreme outskirts of those clusters. Paper II describes the derivation of integrated magnitudes for this cluster sample, and presents an analysis of correlations between integrated magnitudes and colors and global cluster properties. Paper III (Rood et al.2012, in preparation) introduces a new classification scheme of the HBs of Galactic GCs, based on their UV morphologies.
This paper is laid out as follows. Section 2 describes the sample selection, observations, data reduction and analysis. In Section 3 the CMDs are presented. A description of our new catalog of post He-core-burning star candidates is presented in Section 4. Our conclusions are summarized in Section 5
2 Observations and Data Analysis
GALEX is a 50 cm orbiting UV telescope launched in April 2003. GALEX has a circular field of view of diameter and, in imaging mode, a dichroic beam splitter allows it to collect data in two simultaneous channels, in and bands, corresponding to and ( = 1516 and 2267 ) and with a spatial resolution of 4.5 and 5.5, respectively. GALEX detectors consist of two stacks of three large format microplate channels and associated electronics inserted in sealed tubes. The and detectors differ mostly in terms of the photocatode material (CsI in the case of , and Cs2Te in the case of ) and the windows (MgF2 for , fused silica for ). The GALEX detectors record lists of time-ordered photon positions and pulse heights, and these are pipeline-processed on the ground for image reconstruction. The resulting images have pixel scales of 1.5 in both and . Both detectors can be damaged by high global and per/pixel count rates, which prevents targeting very (UV-) bright stars and the low Galactic latitude regions, due to their high UV background. For more details, see Morrisey et al. (2005), Morrisey et al. (2007) or the GALEX instrument overview at http://galexgi.gsfc.nasa.gov/docs/galex/Documents/MissionOverview.html.
2.1 Sample and Observations
The data presented in this paper were primarily collected under GALEX GI programs #056 and #099 (PI R. Schiavon) in Cycles 1 and 4, respectively. The target selection was performed with an eye towards spanning a wide range in metallicity and HB morphology. Limitations, however, were imposed by target magnitudes and the safety of GALEX’s UV detectors, so that very distant, heavily extinguished, and low Galactic latitude clusters could not be included in the sample. As a result, a number of interesting clusters, particularly metal-rich ones at low Galactic latitudes, were not observed, because the high UV background in these regions could potentially harm the GALEX detectors. Clusters with very UV-bright stars within the GALEX field of view also could not be observed (most notably Cen and NGC 6752) and in some cases the pointing had to be adjusted in order to exclude such stars from the field of view. The target list for Cycle 1 totalled 25 Galactic GCs and was composed primarily of clusters for which EHB stars could be detected in both and bands in a single GALEX orbit, with typical exposure times of 1,500 s.
For Cycle 4, our strategy entailed deeper exposures on a smaller sample of 15 clusters, with a focus on expanding coverage towards higher metallicity and younger age, while including clusters of known extra-galactic origin, such as Arp 2 and Terzan 8 (e.g. Law & Majewski, 2010). We also took advantage of the relaxation of the UV-brightness constraints dictated by detector-safety considerations in order to obtain data for metal-rich Galactic GCs at relatively low Galactic latitude, such as NGC 6342 and NGC 6356. For the latter, as well as for very distant Galactic GCs (NGC 2419, Terzan 8, Arp 2, IC 4499) we originally had little hope of obtaining good quality CMDs, and just aimed at measuring reliable integrated colors (but see discussion in Section 3). For one cluster (NGC 6273) data were not collected.
Finally, we further include data for 6 out of 8 Galactic GCs from Cycle 3 GI program #075 (PI S.T. Sohn), which aimed at measuring reliably UV fluxes of extreme HB stars in the program clusters to test the helium-rich hypothesis for the production of EHB stars (e.g., Lee et al., 2005). We plan to present the results of this analysis in a forthcoming paper (Paper IV, Sohn et al. 2011, in preparation). For the Cycle 3 program we selected clusters that exhibit extended HB blue tails in their optical CMDs.
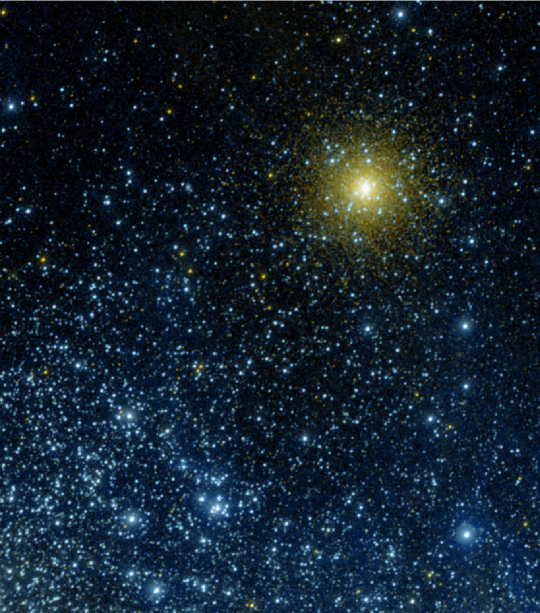
As mentioned above, our original proposals for Cycles 1 and 4 requested between 1 and 2 orbits to be spent on each cluster, which would have resulted in maximum exposure times of approximately 3,000 s on both bands for each target. However, our program benefitted from the complexities of GALEX queue scheduling so that longer exposure times were achieved for some clusters—in some cases, such as that of NGC 2298, exposure times were an order of magnitude longer. Exposure times are also in general longer in the than in the , which is due to the several events of detector shutoffs caused by over-currents in the detector. Repeated attempts of collecting data led therefore to an accumulation of exposures. In total, our program accrued 340 ksec of open shutter time, or the equivalent of GALEX orbits. A false color picture of the field containing one of our clusters (NGC 362) is shown in Figure 1. The spatial distribution of our cluster sample is displayed in Figure 2.
2.2 Photometry and calibration
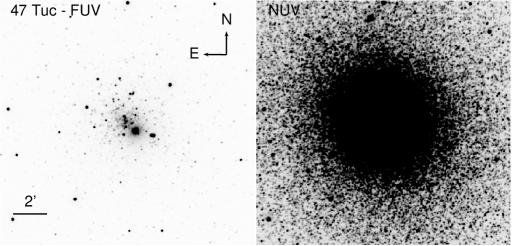
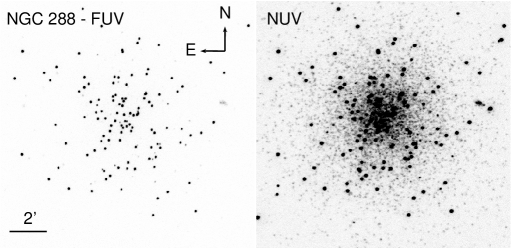
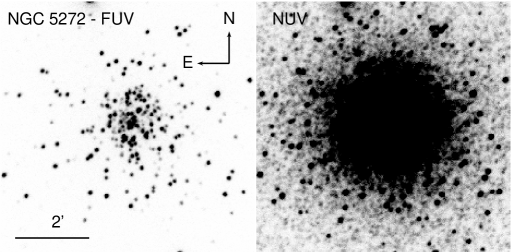
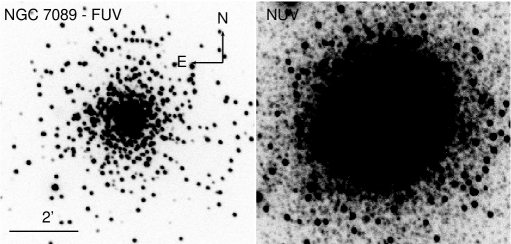
The quality and depth of our data are illustrated in Figures 3 to 6, where and images of a representative subset of the sample are displayed. Consistent gray scales were adopted when producing these images, to allow for a fair visual assessment of the various degrees of crowdedness of Galactic GCs, as seen on both GALEX bands. To the same end, image sizes are set such that the field of view is equal to times the cluster’s core radii. Displayed are one of the reddest clusters in our sample (47 Tuc) together with bluer clusters, spanning a range of stellar density, increasing from NGC 288 to NGC 5272, and NGC 7089. As a general rule, one can see that stellar density is significantly higher in the than in the . This is because, on one hand, the combination of higher sensitivity and longer exposure time makes images a lot deeper than their counterparts and, on the other hand, Galactic GC stars are predominantly brighter in than in . As a result, even at the relatively low resolution of GALEX, accurate photometry can be obtained down to the cores of most clusters in our sample (47 Tuc and NGC 288 being two cases in point), getting progressively difficult at increasing cluster density, up to a limit where crowding becomes a problem in the cluster central regions (e.g., NGC 7089). Unlike the , crowding in the is a problem in the central regions of almost all clusters in our sample. The effect of crowding on our CMDs is discussed in Section 3.
The photometric analysis was performed on the background-subtracted intensity images output by the GALEX pipeline (Morrisey et al., 2007, M07). These are images with a plate scale of 1.5, covering a circular area of in diameter, flat-field corrected and with the flux normalized by the effective area and exposure time. Photometry was performed by following standard procedures for point spread function (PSF) modeling, using the crowded-field photometry package DAOPHOTII (Stetson, 1987) for both and images. The first step consists of defining a number of bright stars across the FOV for PSF modeling. For that purpose, we performed a very shallow search for bright point sources with the DAOPHOT task find on each image. Magnitudes at this stage, before PSF modeling, were based on simple aperture photometry obtained using the task photometry with an aperture radius . We then selected relatively isolated bright stars spread across the FOV, for PSF determination. We avoided stars in the very central and crowded regions.
The PSF model was typically based on 200 stars in and 50 in images. Quadratic spatial variations of the PSF model were considered. Once the PSF model was determined, we reran find and photometry with appropriate threshold levels (typically 3–6 the sky background) in order to generate a more complete and deeper list of target stars for photometry. Magnitudes were then obtained for this expanded list by performing PSF fits using the allstar routine. Tests were performed where PSF photometry was carried out replacing the PSFs derived in this analysis by the average PSFs supplied by the GALEX team111See http://www.galex.caltech.edu/researcher/techdoc-ch5.html. No significant differences between these tests and the original photometry were found for a couple of clusters bracketing the full range of stellar densities and number of clean stars available for PSF determination.
Aperture corrections (typically mag) were calculated on each image by using 15–20 isolated and bright stars, which were used to generate reliable curves of growth. Instrumental magnitudes were converted to the ABMAG photometric system, using the zero points provided by M07, as follows:
| (1) |
| (2) |
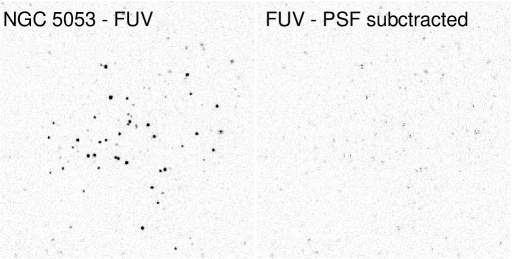
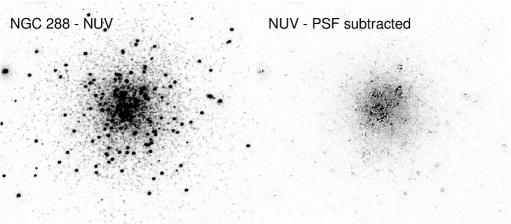
To illustrate the quality of the PSF modeling, we show in Figures 7 and 8 typical residuals from PSF subtraction in and images, respectively. Visual inspection shows that in low density areas, such as the image of NGC 5053 in Figure 7 and the image of NGC 288 outside the cluster core in Figure 8, stellar brightness profiles are properly reproduced by the PSF-models used. In contrast, residuals are much worse in crowded areas such as the core of NGC 288 in . For the reasons explained above, at the low spatial resolution of GALEX, crowding often caused photometry near the cluster center to be unreliable. We therefore exclude stars located within a given cluster-centric distance, for which we felt that reliable magnitudes could not be obtained on the basis of PSF-fitting photometry. The threshold cluster-centric distance varies from cluster to cluster depending on the density of UV sources. Moreover, because crowding was far more severe in the than in the , we usually adopted different cluster-centric distance thresholds for the two bands.
Finally, we point out that the outer annulus of GALEX images is affected by optical distortions that may cause false detections and large magnitude errors (see, e.g. Rey et al., 2007). We note that our photometry is not affected by these problems, because typically this area is well beyond the tidal radii of the clusters in our sample, except for the cases of 47 Tuc and M 3 (NGC 104 and 5272, respectively). For these two clusters, all photometry within the outer annulus was discarded.
Cross-correlation of the and catalogs was performed using CataXcorr, developed at the Observatory of Bologna (P. Montegriffo et al. 2003, private comunication), which has the important advantage of allowing a visual check of the quality of the geometric roto-translation solution. The final catalogues consist of stars detected in at least one of the two filters. This choice has been made in order to maximize the number of sources for possible cross-match with optical catalogues. For the reasons explained above, there is a large number of sources without a counterpart. On the other hand, because crowding is more severe in the than in the , there is a (small) number of central sources without reliable magnitudes.
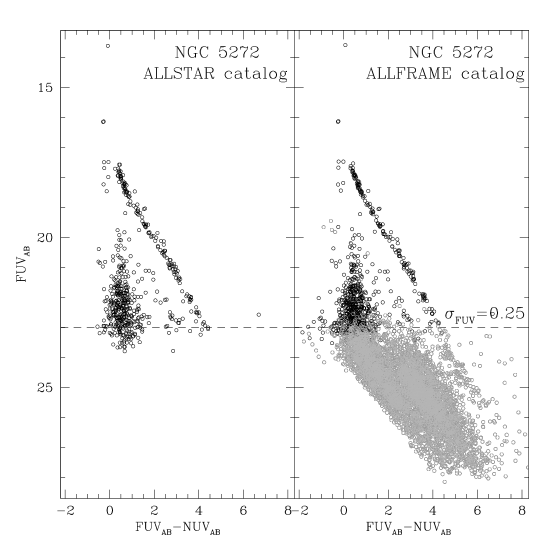
For the reasons discussed above, the depth achievable in GALEX CMDs is set by the shallower photometry. In fact, we showed in previous works (e.g., Lanzoni et al., 2007; Dalessandro et al., 2009) that our images are often deep enough to detect stars mag fainter than the main-sequence turnoff. With the aim of maximizing the number of stars with magnitude measurements in both GALEX bands, we attempted to use the allframe routine (Stetson et al. 1989) in order to “force-find” stars in the images on the basis of their positions in the . Results of this experiment are shown in Figure 9. The left panel shows the CMD from photometry based on allstar, and on the right panel the CMD obtained from forcing allframe to find stars at their known positions is shown. These plots suggest that this use of allframe leads to detection of sources 3–4 mag fainter in than just using allstar. However by performing a visual analysis on the images, it became clear that most of the additional detections were not real. To further verify this result, we performed PSF photometry at random background positions ending up with a color-magnitude distibution that is very similar to the one obtained when force-finding stars (gray points in the right panel of Figure 9). For this reason we decided to adopt only the catalogues obtained by using the allstar routine as already described. Fig. 9 shows also that the two approaches give virtually identical results when stars with are removed from the CMD.
Photometric depth varies from cluster to cluster according to exposure times (see Table 1), thus being in all cases deeper in the than in the . In our deepest images, we reach and . NGC 2419 is the only cluster in our sample (with both and images available) for which it has not been possible to obtain reliable photometry of individual stars. Since NGC 2419 is a cluster with a large population of emitters both at and wavelenghts and it is one of the most distant clusters in the Galaxy (, Dalessandro et al. 2008, see Fig. 1), it appears extremely dense in GALEX images making photometric measurements of individual stars virtually impossible at the GALEX spatial resolution.
2.3 Deviations from Linearity
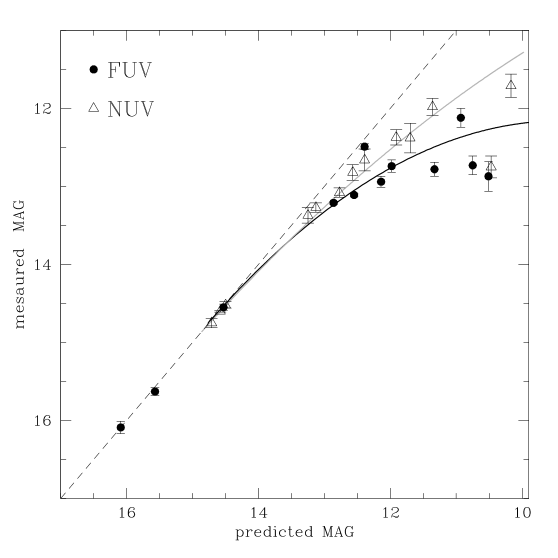
The GALEX detectors present deviations from linearity when count rates exceed (see M07). This affects bright source photometry, particularly in the (see below). In order to correct observed magnitudes, M07 compared aperture photometry for a sample of Hubble Space Telescope (HST) spectrophotometric standards observed by GALEX, with synthetic photometry based on spectrophotometric data from the CALSPEC database222See http://www.stsci.edu.instruments/observatory/cds/calspec.html. Because our photometry is based on PSF-fitting instead of aperture photometry, we decided to repeat the analysis done by M07, by performing PSF photometry on the GALEX archival data for HST spectrophotometric standards, in order to assess the impact of deviations from linearity on our magnitudes. We used 13 of the spectrophometric standards from M07 (see Table 2) spanning a range of 4–5 mag both in and . For each of these stars we obtained and magnitudes by using the same procedures described in Section 2.2, and compared our results with those from M07.
The results are displayed in Figure 10, where our measurements are plotted against synthetic magnitudes as reported by M07. Data points for both (filled circles) and (open triangles) are plotted. The solid lines are fits from M07 to the relation between their aperture magnitudes and synthetic photometry, the black (gray) line represents fits to () data. The dashed line shows the one-to-one relation. It is clear from this figure that non-linearity becomes detectable in both bands at mag. Deviations increase with increasing brightness, the effect being more severe in the than in the . For the brightest source, non-linearity leads to a 2.5 mag overestimate in magnitudes, the effect being mag weaker in the . Most importantly, all but a handfull of the stars for which we have photometry are safely below the limit where non-linearity effects are detectable.
It is interesting to contrast our results with those by M07, by comparing our data points with their fits in Figure 10. In the case, deviations from linearity are consistent between this work and M07, including a star that deviates very strongly from linearity (BD33, in Table 3), for which our photometry is in good agreement with that of M07. On the other hand, the data suggest that non-linearity effects are slightly stronger in our PSF-fitting photometry than in M07’s aperture photometry, particularly in the .
3 The Color-Magnitude Diagrams
The CMDs obtained in this work are displayed in Figures 11a-g. The outstanding variety of colors and magnitudes of UV bright sources in Galactic GCs is immediately obvious, even on a perfunctory perusal of these diagrams. There are, nonetheless, features that are common to all diagrams, and we briefly comment on those here. In PAPER III, we present a new classification of Galactic GCs, based on the morphology of their HBs in UV CMDs, and study correlations between this new HB morphology index with global cluster properties.
We start by discussing the CMD of M 3 (NGC 5272), which is reproduced in better detail in Figure 12. M 3 is a moderately metal-poor Galactic GC () with a relatively blue HB (HB parameter = 0.08, Lee et al., 1994; Borkova & Marsakov, 2000). GALEX magnitudes were corrected from extinction values estimated using the Cardelli et al. (1989) extinction curve and extinction values from Harris (1996). Extinction in the UV is substantially higher than in the optical, amounting in the case of NGC 5272 to and , as opposed to . We note however, that, because the effective wavelength of the filter coincides with a bump in the Galactic extinction curve (Cardelli et al., 1989), interstellar extinction does not redden , leading instead to a slight blueing of that color. Finally, absolute magnitudes in Figure 12 were obtained adopting distance moduli taken from Harris (1996).
Only stars located at cluster-centric distances between and are displayed in Figure 12, to minimize crowding effects on photometry performed within the cluster core, and to minimize field contamination beyond the cluster tidal radius. A scale is provided on the top axis of the diagram, which was obtained by interpolating values into () vs. vs. [M/H] tables calculated on the basis of fluxes from Kurucz model atmospheres,333see http://kurucz.harvard.edu/grids.html adopting the filter responses available on the GALEX website. Models were adopted for surface gravities typical of HB stars (Dorman et al., 1993), so that the scale does not apply in detail to other stellar types such as blue stragglers and PAGB stars.
The first vacuum-UV CMDs for globular clusters were obtained by the Astro/Ultraviolet Imaging Telescope (e.g., Hill et al., 1992; Parise et al., 1994; Whitney et al., 1994), and the general features of those diagrams are also seen in our GALEX photometry. Some of those same features are also seen in HST CMDs obtained by Ferraro et al. (1997) and Ferraro et al. (2003). Three main structures are visible in the CMD of this cluster, as indicated in Figure 12. The cluster HB extends from the lower right to the upper left of the diagram, ranging from 4.5 to in , and from 8 to 2 in . It is obvious from this figure that the “horizontal” branch is not horizontal in the UV (slightly more so in than ), and its slope is mainly a result of bolometric correction effects. The HB spans a wide range in , going from F stars in the blue HB, at K, all the way to O stars in the so-called extreme HB at K. A few stars are also seen at the blue end of the HB, displaced by up to 1 mag fainter in FUV than the blue tip of the horizontal branch, at about and . Those are the so-called “Blue Hook” stars, whose origin is still not well understood (e.g., Whitney et al., 1994; Moehler et al., 2004; Busso et al., 2007; Rood et al., 2008).
A few gaps are apparent along the HB of Figure 12, one of them at , and two other less prominent ones located at and 0.0/12,000 K. The latter gap is the one that is the most likely to be real. It corresponds to the “G1” gap, identified by Ferraro et al. (1998) in HST/WFPC-2 optical color-magnitude diagrams of M 3 and other Galactic globular clusters. It also coincides with the position associated with the Grundahl jump—a discontinuity in the HBs of globular clusters, first pointed out by (Grundahl et al., 1998), which manifests itself as a brightening of the Strömtren or the Johnson U band magnitudes of stars hotter than 11,500 K. The Grundahl jump has been interpreted by Grundahl et al. (1999) as being due to a decrease of hydrogen- relative to metal-opacity, associated with an increase of light element opacities due to radiative levitation for 11,500 K. Inspection of Figure 8 of Grundahl et al. (1999) suggests that the differential impact of radiative levitation on FUV and NUV-like photometric bands can potentially generate a gap with a similar size to that observed in Figure 12. However, a definitive association between this apparent gap and the Grundahl jump depends on currently unavailable synthetic photometry based on detailed model atmosphere calculations for the relevant stellar parameters and abundance patterns.
The remaining two gaps do not seem to have observed counterparts in the CMDs of Ferraro et al. (1998), which casts doubts on the reality of those gaps. As pointed out by Catelan (2008), stochastic effects due to small samples could be to blame, since some of the previously proposed gaps did not stand the test of better quality color-magnitude diagrams, based on more robust samples. According to Catelan (2008), real features such as the Grundahl jump are probably associated to chemical composition discontinuities along the HB, which can manifest themselves through opacity effects due to specific chemical species, which may operate on some photometric bands, but not on others. The latter could conceivably explain the presence of these two gaps in our CMD, but not in those of Ferraro et al. (1998), provided an opacity source can be identified that is important in the NUV/FUV but not in the optical. Alternatively, these gaps may be due to the fact that the nonlinearity of the – relation leads to a color stretching of the redder part of the UV HB, which may make such gaps more readily detectable in the UV than in the optical. This issue clearly deserves further investigation in future studies.
Another feature of UV HB morphologies is the clump of stars at and . This feature is actually an artifact caused by the highly non-linear character of the color- relation. At ( K), a 0.5 mag color interval spans a few 100 K in , whereas at ( K) the same color interval spans several 1,000 K, leading to the accumulation of data points in that area of the HB for any cluster with a substantial number of stars hotter than K.
The next important population visible in the CMD of Figure 12 is that of blue stragglers. Their identification in this case is easy, as they are spread along a sequence that is parallel, and 1–1.5 mag fainter than the HB (e.g. Ferraro et al. 1999; see also Figure 2 by Ferraro et al. 1997). A Girardi et al. (2000) zero-age main sequence for the metallicity of NGC 5272 is plotted as a dashed line, in order to facilitate the identification of the cluster’s blue stragglers. Only the hottest and brightest blue stragglers are detected in the . Lanzoni et al. (2007) and Dalessandro et al. (2009) have recently shown that combination of GALEX data with wide-field optical photometry is a powerful mean to study blue stragglers, and in particular their spatial distribution in GCs.
Another important population in this CMD is that of post He-core burning stars, whose identification is difficult, given their rarity and the uncertainties surrounding their evolutionary paths in the CMD, as well as their lifetimes. There are two PAGB candidates in this CMD, which are approximately 1.5 mag brighter than the brightest HB stars, at greater than K. See discussion in Section 4.
The cloud of points that is located towards fainter magnitudes and bluer colors than the HB is mostly populated by background sources, with an average color of and ( in Figures 11a-g). Some of those objects may actually belong to the cluster populations with bright blue stragglers contributing on the red side and young white dwarfs demarcating the blue envelope. Based on WFPC2 data, Ferraro et al. (2001) argued for the presence of young white dwarfs, with ages million years, in the corresponding locus of the CMD of 47 Tuc. In particular, they showed that the blue envelope of that CMD population is consistent with theoretical expectations both for the colors and number counts of young white dwarfs. However, while that study refers to a small region at the center of the cluster, where the background field contamination is expected to be low, the GALEX FoV is expected to be heavily contaminated by background objects. In fact, inspection of high resolution images taken with the wide field imager, attached to the ESO 2.2 m telescope (Lanzoni et al., 2007), indicated that the majority of the sources in that region of the CMD consists of distant galaxies. In addition, the number of objects in this region of the UV CMD of M 3 is consistent with the number of extra-galactic known objects as found in the NASA Extragalactic Database (NED)444http://nedwww.ipac.caltech.edu/. In summary, the low resolution of GALEX images and the relatively low resolution of the ESO 2.2 m images do not allow one to distinguish unequivocally between white dwarfs and blue stragglers on one side, and background galaxies on the other. Therefore, we decide to leave them in the plots, with the caveat that absolute magnitudes should be disregarded for most objects in that region of this diagram.
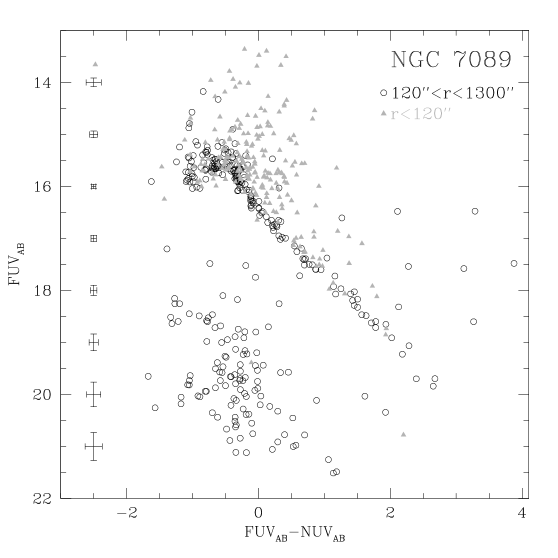
The effect of crowding on the GALEX CMDs can be assessed in Figure 13, where stars in the field of NGC 7089 are plotted. Stars within 2′ from the cluster center are shown as gray triangles, whereas stars at larger cluster-center distances, within the cluster tidal radius, are plotted with open circles. The different CMD loci occupied by stars within and outside the 2′ radius shows that crowding produces a population of stars artificially brighter and redder than the cluster’s HB population. While the brighter magnitudes are a straightforward effect of blending, the apparent redder colors are due to the fact that blending is more severe in the than in the . The case of NGC 7089 is somewhat extreme, since the HB of this cluster is so populous that crowding is important in both and images (Figure 6). In most cases, crowding in the is far less severe, and its effect on CMDs is that of producing a predominantly redder population, due to crowding in the . We also point out that because the “brightening” effect associated with stellar blending should be typically of the order of 0.75 mag, it is possible that some of the very bright stars at in NGC 7089 may be real UV-bright cluster members. See discussion in Section 4.
4 UV-Bright stars
While the integrated light of old stellar populations in the is dominated by EHB stars, post-He core burning stars also contribute a fraction of that radiation (e.g., Greggio & Renzini, 1990; O’Connell, 1999; Greggio & Renzini, 1999). A few definitions are required at this point. According to standard stellar evolution theory, post-HB evolution depends strongly on the mass of the stellar envelope. After core-He exhaustion, stars with the highest envelope masses evolve into the AGB phase, undergoing thermal pulses and eventually losing their envelopes, evolving towards higher temperatures at constant high luminosity as PAGB stars. Stars with lower envelope mass experience a much shier excursion into the AGB phase and never undergo thermal pulses, evolving towards higher temperatures, after envelope loss, at constant, but lower, luminosities. The latter are called post early-AGB (PEAGB) stars. Finally, at the extreme low end of envelope mass, stars never make it to AGB phase after core-He exhaustion, departing the blue end of the HB in a small excursion towards higher luminosities, but never becoming as bright as PEAGB stars. The latter are the so-called AGB-manqué stars (AGBM).
Our knowledge of the total contribution of these stars to the integrated light of old stellar populations is limited by uncertainties in evolutionary tracks, which are to a large extent due to difficulties in the modeling of mass loss during the AGB phase (van Winckel, 2003). GCs are the one type of stellar systems where the masses of these stars are best constrained, so that observations of post core-He burning stars in clusters can in principle contribute to the betterment of stellar evolution models. However, stellar evolution proceeds at a very fast pace after the core-He burning stage, with time scales varying between and yr. The incidence of these stars in stellar systems of relatively low mass, such as GCs, is therefore low, and thus strongly affected by stochastic effects. The wide field of view of GALEX and the size of our sample configure an ideal situation for the cataloguing of these rare stellar types. We describe in this Section the procedure we followed in order to idenfity PAGB and other UV-bright star candidates.
The paucity of post-core-He burning stars makes their identification solely on the basis of photometry in any given single GC extremely uncertain, though an early attempt was made using a UV CMD of NGC 6752 by Landsman et al. (1996). Because the average number of PAGB stars per cluster is of the order of 1, they form no sequence in any of the CMDs shown in the previous section. In the absence of a sequence, distinguishing post-core He burning stars from fore/background field contaminants in the CMD of any individual cluster is very hard, and usually requires a spectroscopic follow up. However, stacking the CMDs of many clusters should boost the number of UV-bright stars per unit CMD area, highlighting the locus occupied by stars in these evolutionary stages. Figure 14 shows a stack of the best 23 CMDs from Figures 11a-g, which do not have a very strong background contamination. The clusters included are NGC 1851, 1904, 2298, 4147, 4590, 5024, 5053, 5272, 5466, 5897, 5904, 6101, 6218, 6229, 6254, 6341, 6535, 6584, 6809, 6981, 7089, 7099, and 7492. Data for each cluster were placed on an absolute magnitude scale, adopting reddening and distance modulus from the latest version of the Harris (1996) catalog, and only stars within the radial limits displayed in Figures 11a-g are shown in Figure 14. The spread in magnitude of the stacked HB is likely caused by uncertainties in the adopted distance moduli and in the adopted reddening values.
Because all the clusters are brought to the same distance, all the typical features of the UV CMDs of old stellar populations appear in sharp contrast in this CMD stack. For instance, the blue straggler sequence stretching below the red part of the HB, and the supra-HB stars in the other extreme of the HB are more clearly seen in the CMD stack than in most individual CMDs of Figures 11a-g. Two stellar sequences brighter than the HB are also apparent in Figure 14. The bluest and brightest in have colors roughly between and , and extend to magnitudes as bright as . The other family of stars is located towards redder colors and fainter magnitudes, consisting of a population of stars on average 2–3 mag brighter than the HB, with 1.5. These stars are mostly foreground contaminants, as discussed below. Finally, we note that there is a population of stars that are brighter than the HB by no more than 1 mag, spread through its entire extension. These are most likely unresolved stellar blends.
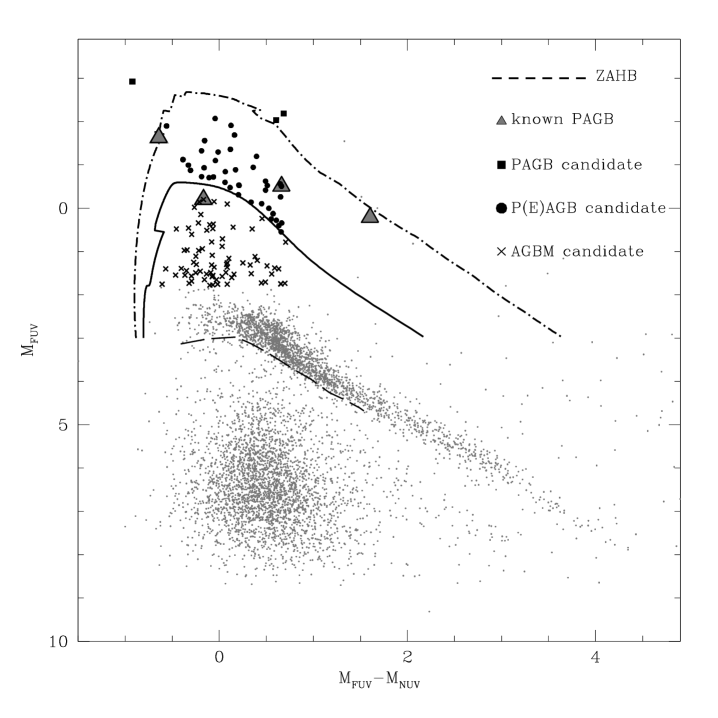
We first turn our attention to the main objects of interest, the population of stars revealed by the CMD stack just above the extreme HB stars at of a few times K. This stellar sequence is too blue and extends towards too bright magnitudes to harbor a significant fraction of blends. We note that in Figure 13 almost all the stars considered to be due to blends produced by crowding effects are redder than (the effect of interstellar extinction on colors in the CMD of NGC 7089 is negligible). Moreover, because Figure 14 excludes stars within central cluster regions, crowding effects should be minimal anyway. So, we conclude that this sequence of hot UV-bright stars constitutes a real population of UV-bright stars hosted by our sample of Galactic GCs. In fact, these stars indeed occupy the same locus as the PAGB, PEAGB, and AGBM stars identified by Brown et al. (2008) in a STIS UV CMD of M 32 stars (their Figure 3). In order to gain further insight into their nature, we reproduce the CMD stack in Figure 15, overlaying evolutionary tracks by Brown et al. (2008) for a PEAGB and a PAGB star of (dash-dotted line) and (thick solid line), respectively. The model prediction for the zero-age horizontal branch (ZAHB; dashed line) is also shown, which matches very well the lower envelope of our observed HB.
On the basis of the discussion above, we can use the evolutionary tracks in Figure 15 to assign the UV-bright stars in our sample to the above evolutionary classes. Candidates for the different classes are listed in Table 3 and shown in Figure 15, where the data from Figure 14 are shown as gray dots. Filled circles indicate the positions of all PAGB candidates in our entire cluster sample, regardless of their cluster-centric distances. The large gray triangles indicate the positions of a few PAGB stars known to exist in clusters from our sample. We chose not to impose a cluster-centric distance cut in our selection of PAGB and PEAGB candidates, because they are bright enough that crowding effects on their photometry are minimal. That is not the case of AGBM stars, though, which lie close enough in magnitude to the HB that their locus in the CMD may be substantially contaminated by unresolved pairs of HB stars. Therefore, the list of AGBM candidates presented in Table 3 only includes stars within the cluster-centric distance thresholds displayed in Figures 11a-g. We consider stars brighter than the ZAHB by more than 1 mag in and fainter than the PEAGB tracks to be AGB-manqué candidates. Stars brighter than the PEAGB class are either PEAGB or PAGB candidates, we therefore refer to these stars as P(E)AGB. In view of the uncertainties in evolutionary tracks and the possible contamination of our magnitudes by stellar blends (for stars within the crowded areas of the clusters), we refrain from attempting a distinction between the latter two classes in our sample. Finally, stars brighter than the PAGB track are considered to be PAGB candidates. Note that two of the stars identified as PAGB in previous literature (large gray triangles) would be classified as AGBM and P(E)AGB according to our classification scheme. We also impose a color cut in our definition of PAGB, PEAGB, and AGBM candidates, by requiring that they have . Note that the AGBM and P(E)AGB candidates identified in Figure 15 include stars from all clusters in our sample, not only the 23 clusters included in the stacked CMD from Figure 14.
Finally, we focus on the redder population of stars brighter than the horizontal branch. According to Brown et al. (2008) tracks , PAGB stars spend only 25% of their time with colors redder than , so the fact that there are more bright stars in Figure 14 on the red side of that color threshold than in the blue side is strongly suggestive of the presence of back/foreground contamination. There are approximately 26 stars in Figure 14 with and . Conversely, there are approximately 67 stars with brighter than the HB by 1 mag and with . If the evolutionary tracks are correct, we would expect to find no more than stars in that region of the CMD. Therefore, we suggest that the vast majority of the bright stars redder than are not cluster members, likely being foreground A and F stars. That is not to say, of course, that there are no cluster PAGB stars in that region of the diagram—in fact, they are very likely to be there, but finding them on the basis of GALEX data alone would be like finding needles in a haystack. Therefore we impose a color cut in our definition of PAGB, PEAGB, and AGB-manqué candidates, by requiring that they have . This color cut is aimed at minimizing contamination of the candidate sample by back/foreground contaminants sources.
5 Conclusions
We have used GALEX to image 44 Galactic GCs in the and , thus creating the largest homogeneous database of the UV properties of these systems. In this paper we describe the sample selection, observations, and data reduction, presenting a brief description of the main features of the UV CMDs. HB stars are the most important feature of the UV color magnitude diagrams, and our CMDs reveal an outstanding variety in the shape of the HB in our cluster sample. Blue straggler stars are also detected in many clusters. We present a catalog of PAGB, PEAGB, and AGBM candidates, which should be useful for studies of these rare, but UV-bright, stellar types. We hope these data will provide better constraints on models of stellar evolution during, and after, the HB phase. In Paper II, we present the integrated UV photometry for this sample, while a new classification scheme of the morphology of the HBs of Galactic GCs in UV is presented in Paper III.
GALEX provided us with an opportunity, unique in this decade, to collect precious data that will be crucial to help untangling the intricacies of the latest stages of evolution of low-mass stars, so as to allow a deeper understanding of the UV properties of old stellar populations. We hope that this data set will enable notable progress in this field during the upcoming years. The photometric catalogs can be downloaded from http://www.cosmic-lab.eu.
| CLUSTER | (sec) | (sec) | (deg) | (deg) | OBS Date | Cycle |
|---|---|---|---|---|---|---|
| NGC 104 | 2235 | 4069 | 6.085 | -72.132 | 2006-07-06 | GI1 |
| NGC 288 | 1606 | 1606 | 13.418 | -26.245 | 2004-12-06 | GI1/MIS |
| NGC 362 | 2623 | 3027 | 15.809 | -70.848 | 2005-10-23 | GI1 |
| NGC 1261 | 1225 | 1225 | 48.064 | -55.217 | 2004-12-09 | GI1 |
| NGC 1851 | 2797 | 4487 | 78.526 | -40.047 | 2004-12-10 | GI1 |
| NGC 1904 | 1326 | 3176 | 81.196 | -24.461 | 2004-12-14 | GI1 |
| NGC 2298 | 10757 | 22171 | 102.066 | -35.945 | 2004-12-15 | GI1 |
| NGC 2808 | 987 | 988 | 137.896 | -64.913 | 2007-03-11 | GI3 |
| NGC 2419 | 1262 | 3695 | 114.688 | 38.869 | 2008-12-16 | GI4 |
| NGC 4147 | 1678 | 1678 | 182.526 | 18.542 | 2006-03-29 | GI1 |
| NGC 4590 | 1634 | 5081 | 190.020 | -26.605 | 2007-03-30 | GI1 |
| NGC 5024 | 1656 | 1656 | 198.230 | 18.169 | 2007-05-02 | GI1 |
| NGC 5053 | 1781 | 1782 | 199.112 | 17.698 | 2007-05-03 | GI1 |
| NGC 5272 | 1679 | 1680 | 205.547 | 28.375 | 2007-05-01 | GI1 |
| NGC 5466 | 1841 | 3532 | 211.364 | 28.535 | 2007-05-01 | GI1 |
| NGC 5897 | 1590 | 2936 | 229.352 | -21.010 | 2007-06-06 | GI1 |
| NGC 5904 | 1563 | 1566 | 229.592 | 2.069 | 2007-05-12 | GI3 |
| NGC 5986 | 4224 | 4225 | 236.514 | -37.786 | 2007-06-06 | GI3 |
| NGC 6101 | 2010 | 2010 | 247.039 | -72.502 | 2008-07-26 | GI1 |
| NGC 6218 | 120 | 23891 | 251.811 | -1.948 | 2006-07-02 | GI1 |
| NGC 6229 | 1603 | 5419 | 251.769 | 47.477 | 2007-04-13 | GI1 |
| NGC 6235 | 1875 | 25131 | 253.373 | -22.585 | 2005-06-24 | GI1 |
| NGC 6254 | 1911 | 25362 | 254.287 | -4.099 | 2005-06-23 | GI1 |
| NGC 6273 | 2264 | — | 255.603 | -26.563 | 2007-06-17 | GI3 |
| NGC 6284 | 5767 | 4225 | 236.514 | -37.786 | 2007-06-06 | GI3 |
| NGC 6341 | 1911 | 1911 | 258.884 | 43.123 | 2008-05-25 | GI4 |
| NGC 6342 | 3101 | 3101 | 260.730 | -19.451 | 2008-05-27 | GI4 |
| NGC 6402 | 5185 | 5184 | 264.500 | -3.350 | 2007-06-17 | GI3 |
| NGC 6356 | 3369 | 3369 | 260.949 | -17.642 | 2008-05-27 | GI4 |
| NGC 6397 | 1584 | 409 | 265.574 | -53.770 | 2008-07-17 | GI4 |
| NGC 6535 | 1671 | 1671 | 270.670 | -0.330 | 2008-05-31 | GI4 |
| NGC 6584 | 4799 | 4799 | 274.578 | -52.228 | 2008-07-17 | GI4 |
| NGC 6809 | 840 | 840 | 294.994 | -31.063 | 2008-07-14 | GI4 |
| NGC 6864 | 1882 | 4817 | 301.520 | -21.921 | 2005-08-06 | GI1 |
| NGC 6981 | 2470 | 5039 | 313.366 | -12.537 | 2005-08-05 | GI1 |
| CLUSTER | (sec) | (sec) | OBS Date | Cycle | ||
|---|---|---|---|---|---|---|
| NGC 7006 | 1457 | 4690 | 315.375 | 16.185 | 2006-08-12 | GI1 |
| NGC 7089 | 3143 | 4418 | 323.372 | -0.823 | 2005-08-05 | GI1 |
| NGC 7099 | 2305 | 2305 | 325.197 | -23.192 | 2008-08-04 | GI4 |
| NGC 7492 | 1697 | 3302 | 347.224 | -15.639 | 2005-08-26 | GI1 |
| Arp 2 | 4027 | 4027 | 292.355 | -30.770 | 2008-07-11 | GI4 |
| Pal 11 | 2120 | 15771 | 296.428 | -7.942 | 2005-06-17 | GI1 |
| Pal 12 | 1510 | 3401 | 326.662 | -21.251 | 2006-08-01 | GI1 |
| IC 4499 | 4279 | 4279 | 225.077 | -82.213 | 2008-07-29 | GI4 |
| Terzan 8 | 3084 | 3084 | 295.438 | -34.000 | 2008-07-12 | GI4 |
| Star | ||||||
|---|---|---|---|---|---|---|
| GD50 | 12.74 | 12.70 | 11.98 | 12.82 | 12.84 | 12.57 |
| HZ4 | 14.55 | 14.58 | 14.53 | 14.52 | 14.56 | 14.50 |
| HZ2 | 13.21 | 13.20 | 12.86 | 13.37 | 13.39 | 13.25 |
| G191B2B | 12.26 | 11.47 | 99.99 | 11.71 | 11.65 | 10.17 |
| GD108 | 12.49 | 12.52 | 12.39 | 13.08 | 13.19 | 12.77 |
| HZ21 | 13.11 | 12.99 | 12.55 | 13.27 | 13.30 | 13.13 |
| GD153 | 12.78 | 99.99 | 11.33 | 12.37 | 12.36 | 11.91 |
| HZ43 | 12.73 | 12.31 | 10.75 | 11.98 | 11.98 | 11.36 |
| LTT9491 | 16.09 | 16.16 | 16.09 | 14.60 | 14.64 | 14.58 |
| G93 | 12.94 | 99.99 | 12.14 | 12.66 | 12.67 | 12.39 |
| NGC7293 | 12.12 | 10.03 | 10.93 | 12.38 | 99.99 | 11.70 |
| LDS749B | 15.63 | 15.66 | 15.57 | 14.75 | 14.78 | 14.71 |
| BD33 | 12.87 | 12.35 | 10.51 | 12.75 | 12.66 | 10.47 |
| STAR ID | RA | Dec | Class | ||
|---|---|---|---|---|---|
| NGC 104-1 | 13.069 | 12.448 | 00:23:58.0 | -72:05:30 | P(E)AGB |
| NGC 288-5695 | 16.687 | 16.227 | 12:52:40.9 | +26:33:53 | AGBM |
| NGC 362-1625 | 14.038 | 14.885 | 1:03:11.5 | -70:49:13 | AGBM |
| NGC 362-372 | 13.649 | 14.496 | 1:02:16.2 | -70:51:42 | AGBM |
| NGC 362-1626 | 13.772 | 14.632 | 1:03:38.8 | -70:49:12 | AGBM |
| NGC 362-1444 | 13.769 | 14.791 | 1:01:53.1 | -70:54:11 | AGBM |
| NGC 362-2413 | 13.262 | 14.412 | 1:03:12.2 | -70:59:39 | AGBM |
| NGC 1261-1 | 14.670 | 15.483 | 3:11:48.6 | -55:32:36 | AGBM |
| NGC 1261-43 | 14.734 | 15.678 | 3:12:27.8 | -55:34:59 | AGBM |
| NGC 1261-8 | 14.307 | 15.376 | 3:11:56.2 | -55:17:44 | AGBM |
| NGC 1261-19 | 15.020 | 16.067 | 3:12:10.1 | -55:12:22 | AGBM |
| NGC 1851-44 | 10.895 | 12.355 | 05:14:08.6 | -40:03:03 | P(E)AGB |
| NGC 2808-17 | 14.802 | 14.902 | 09:12:03.9 | -64:51:31 | P(E)AGB |
| NGC 2808-69 | 15.824 | 15.874 | 09:12:02.1 | -64:52:36 | P(E)AGB |
| NGC 2808-72 | 16.187 | 15.900 | 09:12:05.7 | -64:51:56 | P(E)AGB |
| NGC 2808-84 | 16.295 | 16.026 | 09:12:07.2 | -64:51:37 | P(E)AGB |
| NGC 2808-99 | 15.778 | 16.163 | 09:12:11.9 | -64:50:37 | P(E)AGB |
| NGC 2808-103 | 16.178 | 16.193 | 09:12:05.4 | -64:52:37 | P(E)AGB |
| NGC 2808-118 | 16.009 | 16.342 | 09:11:51.5 | -64:51:49 | P(E)AGB |
| NGC 2808-119 | 16.235 | 16.344 | 09:12:06.1 | -64:50:35 | P(E)AGB |
| NGC 2808-128 | 16.714 | 16.410 | 09:12:00.5 | -64:51:26 | P(E)AGB |
| NGC 2808-132 | 16.404 | 16.424 | 09:12:06.5 | -64:52:00 | P(E)AGB |
| NGC 2808-157 | 17.053 | 16.614 | 09:12:00.5 | -64:52:12 | P(E)AGB |
| NGC 2808-173 | 16.614 | 16.753 | 9:12:01.7 | -64:47:34 | AGBM |
| NGC 2808-206 | 16.569 | 17.004 | 9:11:43.1 | -64:52:29 | AGBM |
| NGC 2808-254 | 17.152 | 17.229 | 9:12:22.1 | -64:52:38 | AGBM |
| NGC 2808-267 | 16.859 | 17.279 | 9:11:59.9 | -64:53:26 | AGBM |
| NGC 2808-314 | 17.185 | 17.477 | 9:12:25.4 | -64:52:05 | AGBM |
| NGC 2808-350 | 17.222 | 17.577 | 9:11:41.9 | -64:42:06 | AGBM |
| NGC 2808-387 | 18.110 | 17.702 | 9:12:05.3 | -64:53:25 | AGBM |
| NGC 2808-421 | 17.591 | 17.783 | 9:12:20.0 | -64:50:55 | AGBM |
| NGC 2808-594 | 18.439 | 18.216 | 9:12:05.5 | -64:53:47 | AGBM |
| NGC 2808-656 | 18.240 | 18.307 | 9:12:10.8 | -64:50:02 | AGBM |
| NGC 2808-670 | 18.024 | 18.328 | 9:11:24.9 | -64:52:45 | AGBM |
| NGC 2808-711 | 18.314 | 18.406 | 9:12:12.0 | -64:53:15 | AGBM |
| NGC 2808-756 | 18.288 | 18.482 | 9:11:50.9 | -64:50:30 | AGBM |
| NGC 2808-1146 | 18.255 | 18.944 | 9:12:17.2 | -64:48:04 | AGBM |
| STAR ID | RA | Dec | Class | ||
|---|---|---|---|---|---|
| NGC 4590-9 | 15.925 | 15.627 | 12:38:33.0 | -26:41:15 | AGBM |
| NGC 5024-5 | 15.269 | 15.655 | 13:14:00.1 | +18:31:31 | P(E)AGB |
| NGC 5024-7 | 15.506 | 15.832 | 13:13:10.6 | +18:07:36 | P(E)AGB |
| NGC 5024-161 | 17.994 | 18.307 | 13:12:39.5 | +18:04:54 | AGBM |
| NGC 5272-2 | 13.613 | 13.778 | 13:42:16.9 | +28:26:02 | P(E)AGB |
| NGC 5272-32 | 16.137 | 16.488 | 13:42:01.2 | +28:23:25 | AGBM |
| NGC 5272-38 | 16.146 | 16.527 | 13:42:05.9 | +28:19:05 | AGBM |
| NGC 5466-1 | 13.075 | 13.997 | 14:03:17.2 | +28:39:30 | PAGB |
| NGC 5466-36 | 17.391 | 17.793 | 14:05:31.6 | +28:33:10 | AGBM |
| NGC 5897-26 | 16.564 | 16.719 | 15:18:56.6 | -21:08:40 | AGBM |
| NGC 5897-34 | 17.578 | 17.080 | 15:17:23.7 | -20:37:56 | AGBM |
| NGC 5897-50 | 17.308 | 17.648 | 15:18:04.7 | -20:47:02 | AGBM |
| NGC 5897-61 | 17.499 | 17.835 | 15:18:40.6 | -21:16:08 | AGBM |
| NGC 5904-1 | 13.318 | 13.361 | 15:18:34.2 | +02:05:02 | P(E)AGB |
| NGC 5904-3 | 14.413 | 14.612 | 15:18:32.8 | +01:54:54 | AGBM |
| NGC 5986-634 | 19.140 | 19.443 | 15:46:38.1 | -37:41:25 | AGBM |
| NGC 5986-701 | 19.165 | 19.580 | 15:46:46.5 | -37:49:38. | AGBM |
| NGC 6101-4874 | 16.782 | 17.159 | 16:26:47.1 | -72:15:24 | AGBM |
| NGC 6218-48 | 16.643 | 17.423 | 16:47:12.6 | -01:41:24 | AGBM |
| NGC 6235-154 | 18.585 | 19.174 | 16:53:39.1 | -22:16:17 | AGBM |
| NGC 6235-184 | 19.449 | 19.412 | 16:52:47.4 | -22:04:14 | AGBM |
| NGC 6235-186 | 19.578 | 19.437 | 16:52:51.1 | -22:14:21 | AGBM |
| NGC 6235-196 | 18.847 | 19.507 | 16:52:49.4 | -22:11:50 | AGBM |
| NGC 6235-254 | 19.754 | 19.780 | 16:53:18.0 | -22:11:39 | AGBM |
| NGC 6235-355 | 19.496 | 20.136 | 16:53:43.4 | -22:17:36 | AGBM |
| NGC 6235-439 | 19.734 | 20.350 | 16:53:38.3 | -22:01:02 | AGBM |
| NGC 6235-43 | 16.919 | 17.475 | 16:53:20.8 | -22:02:40 | P(E)AGB |
| NGC 6254-66 | 14.244 | 15.544 | 16:56:48.0 | -04:04:33 | AGBM |
| NGC 6254-112 | 13.813 | 15.052 | 16:57:02.8 | -04:08:19 | AGBM |
| NGC 6254-117 | 13.990 | 15.071 | 16:57:05.2 | -04:07:56 | AGBM |
| NGC 6254-152 | 13.208 | 14.829 | 16:56:43.7 | -04:05:41 | AGBM |
| NGC 6254-189 | 14.390 | 15.851 | 16:57:06.3 | -04:03:19 | AGBM |
| NGC 6254-241 | 13.433 | 14.564 | 16:57:14.7 | -04:05:03 | AGBM |
| NGC 6254-242 | 11.096 | 12.905 | 16:57:09.4 | -04:04:24 | P(E)AGB |
| NGC 6254-364 | 14.167 | 15.680 | 16:57:01.1 | -04:04:30 | AGBM |
| NGC 6284-2 | 13.175 | 13.772 | 17:04:10.4 | -24:27:57 | P(E)AGB |
| NGC 6284-85 | 16.156 | 16.484 | 17:04:29.7 | -24:29:20 | P(E)AGB |
| STAR ID | RA | Dec | Class | ||
|---|---|---|---|---|---|
| NGC 6284-116 | 17.032 | 16.921 | 17:04:45.0 | -24:32:60 | P(E)AGB |
| NGC 6284-154 | 17.282 | 17.207 | 17:05:10.8 | -24:32:24 | P(E)AGB |
| NGC 6284-212 | 17.385 | 17.606 | 17:03:11.4 | -24:51:31 | P(E)AGB |
| NGC 6342-110 | 18.991 | 18.803 | 17:21:38.3 | -19:34:04 | P(E)AGB |
| NGC 6356-1 | 13.089 | 14.059 | 17:23:25.2 | -17:58:15 | P(E)AGB |
| NGC 6356-311 | 18.480 | 18.867 | 17:23:45.9 | -17:41:59 | AGBM |
| NGC 6356-424 | 18.877 | 19.243 | 17:24:04.0 | -17:49:37 | AGBM |
| NGC 6356-480 | 19.357 | 19.390 | 17:23:45.6 | -17:50:17 | AGBM |
| NGC 6356-849 | 19.745 | 20.061 | 17:23:39.9 | -17:43:57 | AGBM |
| NGC 6397-149 | 14.773 | 15.029 | 17:41:30.620 | -53:28:18.90 | AGBM |
| NGC 6397-438 | 14.827 | 14.330 | 17:39:44.524 | -53:43:29.37 | AGBM |
| NGC 6397-522 | 13.640 | 13.680 | 17:40:38.428 | -53:38:32.20 | AGBM |
| NGC 6402-31 | 17.581 | 17.508 | 17:37:33.2 | -03:14:52 | PAGB |
| NGC 6402-58 | 18.079 | 18.528 | 17:37:37.3 | -03:15:45 | P(E)AGB |
| NGC 6402-92 | 19.206 | 19.170 | 17:37:38.1 | -03:14:09 | P(E)AGB |
| NGC 6402-99 | 19.142 | 19.261 | 17:37:33.6 | -03:15:27 | P(E)AGB |
| NGC 6402-102 | 18.669 | 19.321 | 17:38:20.1 | -03:10:06 | P(E)AGB |
| NGC 6402-142 | 19.169 | 19.718 | 17:37:26.1 | -03:14:55 | P(E)AGB |
| NGC 6402-143 | 19.045 | 19.718 | 17:37:28.6 | -03:15:17 | P(E)AGB |
| NGC 6402-156 | 19.663 | 19.823 | 17:37:30.9 | -03:17:40 | P(E)AGB |
| NGC 6402-160 | 19.039 | 19.838 | 17:36:38.0 | -03:23:12 | P(E)AGB |
| NGC 6402-171 | 19.627 | 19.900 | 17:37:37.2 | -03:14:60 | P(E)AGB |
| NGC 6402-193 | 20.046 | 20.050 | 17:37:36.4 | -03:15:34 | P(E)AGB |
| NGC 6402-202 | 20.016 | 20.074 | 17:37:31.8 | -03:15:01 | P(E)AGB |
| NGC 6402-224 | 20.167 | 20.144 | 17:37:40.5 | -03:14:58 | P(E)AGB |
| NGC 6864-8 | 15.853 | 15.412 | 20:06:05.5 | -21:54:59 | PAGB |
| NGC 6864-52 | 16.892 | 17.383 | 20:05:51.3 | -21:42:19 | P(E)AGB |
| NGC 6864-77 | 18.125 | 17.832 | 20:05:19.2 | -22:04:21 | AGBM |
| NGC 6864-102 | 18.669 | 18.126 | 20:07:01.8 | -21:46:18 | AGBM |
| NGC 6864-212 | 19.620 | 19.086 | 20:04:55.2 | -21:51:57 | AGBM |
| NGC 6864-224 | 19.632 | 19.138 | 20:06:40.8 | -22:00:23 | AGBM |
| NGC 6864-225 | 19.631 | 19.140 | 20:05:21.5 | -21:53:06 | AGBM |
| NGC 6864-452 | 19.286 | 20.017 | 20:06:10.5 | -21:38:58 | AGBM |
| NGC 7006-16 | 16.834 | 17.385 | 21:01:35.1 | +16:06:10 | AGBM |
| NGC 7089-407 | 12.492 | 13.221 | 21:33:31.4 | -00:49:09 | P(E)AGB |
| NGC 7089-387 | 12.839 | 17.126 | 21:33:35.6 | -00:51:22 | P(E)AGB |
| NGC 7089-234 | 14.175 | 15.013 | 21:33:19.7 | -00:47:5 | AGBM |
| NGC 7089-194 | 14.788 | 15.834 | 21:33:17.9 | -00:49:58 | AGBM |
| NGC 7089-765 | 14.326 | 14.938 | 21:32:29.4 | -00:48:31 | AGBM |
| STAR ID | RA | Dec | Class | ||
|---|---|---|---|---|---|
| NGC 7089-89 | 14.571 | 15.579 | 21:33:30.9 | -00:47:20 | AGBM |
| NGC 7099-2 | 13.449 | 13.362 | 21:39:56.7 | -23:11:56 | P(E)AGB |
| NGC 7099-10 | 14.763 | 15.058 | 21:40:18.1 | -23:13:23 | AGBM |
| NGC7 099-68 | 16.545 | 16.651 | 21:41:38.7 | -22:54:11 | AGBM |
| Arp 2-25 | 18.227 | 17.757 | 19:27:45.3 | -30:24:51 | P(E)AGB |
| Arp 2-61 | 19.555 | 19.860 | 19:29:11.2 | -30:17:09 | AGBM |
| Arp 2-70 | 19.831 | 20.254 | 19:28:57.0 | -30:27:59 | AGBM |
| Pal 12-25 | 16.423 | 16.498 | 21:47:49.2 | -21:17:33 | AGBM |
| Pal 12-59 | 18.094 | 17.556 | 21:46:04.3 | -21:21:46 | AGBM |
| IC 4499-485 | 19.811 | 20.409 | 14:56:54.2 | -82:12:22 | AGBM |
| Ter 8-38 | 17.800 | 17.270 | 19:41:40.8 | -34:03:59 | P(E)AGB |


References
- Borkova & Marsakov (2000) Borkova, T.V. & Marsakov, V.A. 2000, Astronomy Reports, 44, 665
- Brown et al. (2001) Brown, T.M., Sweigart, A.V., Lanz, T., Landsman, W.B. & Hubeny, I. 2001, ApJ, 562, 638
- Brown et al. (2008) Brown, T.M., Smith, E., Ferguson, H.C., Sweigart, A.V., Kimble, R.A¿ & Bowers, C.W. 2008, apj, 682
- Busso et al. (2007) Busso, G., Cassisi, S., Piotto, G. et al.2007, A&A, 474, 105
- Cardelli et al. (1989) Cardelli, J.A., Clayton, G.C. & Mathis, J.S. 1989, ApJ, 345, 245
- Catelan (2008) Catelan, M. 2008, Mem. Soc. Astron. Italiana, 79, 388
- Catelan (2009) Catelan, M. 2009, Ap&SS, 320, 261
- Code (1969) Code, A.D. 1969, PASP, 81, 475
- Dalessandro et al. (2008) Dalessandro, E., Lanzoni, B., Ferraro, F. R., et al. 2008, ApJ, 681, 311
- Dalessandro et al. (2009) Dalessandro, E., Beccari, G., Lanzoni, B., Ferraro, F.R., Schiavon, R. & Rood, R.T. 2009, ApJS, 182, 509
- Dalessandro et al. (2011) Dalessandro, E. Salaris, M., Ferraro, F.R. et al., MNRAS, 410, 694
- Dorman et al. (1993) Dorman, B., Rood, R.T. & O’Connell, R.W. 1993, ApJ, 419, 596
- Dorman et al. (1995) Dorman, B., O’Connell, R.W. & Rood, R.T. 1995, ApJ, 442, 105
- Ferraro et al. (1997) Ferraro, F. R., Paltrinieri, B., Fusi Pecci, F., et al. 1997, A&A, 324, 915
- Ferraro et al. (1998) Ferraro, F.R., Paltrinieri, B., Fusi Pecci, F., Rood, R.T. & Dorman, B. 1998, ApJ, 500, 311
- Ferraro et al. (1999) Ferraro, F.R. , Paltrinieri, B., Rood, R.T. & Dorman, B. 1999, ApJ, 522, 983
- Ferraro et al. (2001) Ferraro, F.R., D’Amico, N., Possenti, A., Mignani, R.P. & Paltrinieri, B. 2001, ApJ, 561, 337
- Ferraro et al. (2003) Ferraro, F.R., Sills, A., Rood, R.T., Paltrinieri, B. & Buonanno, R. 2003, ApJ, 588, 464
- Girardi et al. (2000) Girardi, L., Bressan, A., Bertelli, G. & Chiosi, C. 2000, A&AS141, 371
- Greggio & Renzini (1990) Greggio, L. & Renzini, A. 1990, ApJ, 364, 35
- Greggio & Renzini (1999) Greggio, L. & Renzini, A. 1999, MmSAI, 70, 691
- Grundahl et al. (1998) Grundahl, F., Vandenberg, D.A. & Andersen, M.I. 1998, ApJ, 500, L179
- Grundahl et al. (1999) Grundahl, F., Catelan, M., Landsman, W.B., Stetson, P.B. & Andersen, M.I. 1999, ApJ, 524, 242.
- Harris (1996) Harris, W.E. 1996, AJ, 112, 1487
- Hill et al. (1992) Hill, R.S. et al. 1992, ApJ, 395. L17
- Landsman et al. (1996) Landsman, W. B., Sweigart, A. V., Bohlin, R. C., et al. 1996, ApJ, 472, L93
- Lanzoni et al. (2007) Lanzoni, B., Sanna, N., Ferraro, F.R., Valenti, E., Beccari, G., Schiavon, R.P., Rood, R.T., Mapelli, M. & Sigurdsson, S. 2007, ApJ, 663, 1040
- Law & Majewski (2010) Law, D.R. & Majewski, S.R. 2010, ApJ, 718, 1128
- Lee et al. (1994) Lee, Y.-W., Demarque, P. & Zinn, R. 1994, ApJ, 423, 248
- Lee et al. (2005) Lee, Y.-W., Joo, S.-J., Han, S.-I. et al.2005, ApJ, 621, L57
- Moehler (2001) Moehler, S. 2001, PASP, 113, 162
- Moehler et al. (2004) Moehler, S., Sweigart, A.V., Landsman, W.B., Hammer, N.J. & Dreizler, S. 2004, A&A, 415, 313
- Morrisey et al. (2005) Morrissey, P. et al. 2005, ApJ, 619, L7
- Morrisey et al. (2007) Morrissey, P. et al. 2007, ApJS, 173, 682
- O’Connell (1999) O’Connell, R.W. 1999, ARA&A, 37, 603
- O’Connell et al. (1997) O’Connell, R.W. 1997, Dorman, B., Shah, R.Y., Rood, R.T., Landsman, W.B., Witt, A.N., Bohlin, R.C., Neff, S.G., Roberts, M.S., Smith, A.M. & Stecher, T.P. 1997, AJ, 114, 1982
- Parise et al. (1994) Parise, R.A. et al. 1994, ApJ, 423, 305
- Rey et al. (2007) Rey, S.-C. et al. 2007, ApJS, 173, 643
- Rey et al. (2009) Rey, S.-C. et al. 2009, ApJ, 700, L11
- Rood et al. (2008) Rood, R.T., Beccari, G., Lanzoni, B., Ferraro, F.R., Dalessandro, E. & Schiavon, R.P. 2008, Mem. Soc. Astron. Italiana, 79, 283
- Rood et al. (2011) Rood, R.T. et al. 2011, in preparation
- Schiavon (2007) Schiavon, R.P. 2007, ApJS, 171, 146
- Sohn et al. (2006) Sohn, S.T., O’Connell, R.W., Kundu, A., Landsman, W.B., Burstein, D., Bohlin, R., Frogel, J.A. & Rose, J.A. 2006, AJ, 131, 866
- Sohn et al. (2011) Sohn, S. T.. et al. 2011, in preparation
- Stetson (1987) Stetson, P.B. 1987, PASP, 99, 191
- Stetson et al. (1989) Stetson, P. B., Hesser, J. E., Smith, G. H., Vandenberg, D. A., & Bolte, M. 1989, AJ, 97, 1360
- Trager et al. (2005) Trager, S.C., Worthey, G., Faber, S.M. & Dressler, A. 2005, MNRAS, 362, 2
- van Winckel (2003) van Winckel, H. 2003, ARA&A, 41, 391
- Whitney et al. (1994) Whitney, J.H. et al. 1994, AJ, 108, 1350