myctr
TRANSPORTATION NETWORK STABILITY: A CASE STUDY OF CITY TRANSIT
Abstract
The goals of this paper are to present criteria, that allow to a priori quantify the attack stability of real world correlated networks of finite size and to check how these criteria correspond to analytic results available for infinite uncorrelated networks. As a case study, we consider public transportation networks (PTN) of several major cities of the world. To analyze their resilience against attacks either the network nodes or edges are removed in specific sequences (attack scenarios). During each scenario the size of the largest remaining network component is observed as function of the removed share of nodes or edges. To quantify the PTN stability with respect to different attack scenarios we use the area below the curve described by for recently introduced (Schneider, C. M, et al., PNAS 108 (2011) 3838) as a numerical measure of network robustness. This measure captures the network reaction over the whole attack sequence. We present results of the analysis of PTN stability against node and link-targeted attacks.
keywords:
complex networks, transportation networks, attack vulnerability1 Introduction
Taken the importance of transportation networks in different types of natural and man-made structures the relevance of their stability against disturbances be they individual failures or complete breakdown is obvious. In turn, one may single out two main ingredients which determine this stability, these are (i) dynamical features of transport processes that take part on such networks, i.e. their fluctuating load and (ii) structural features of the networks themselves, i.e. their topology [1]. Whereas a comprehensive treatment of transportation network stability has to deal with both of these mentioned factors, the complexity of the problem often calls for a separate account and analysis of each factor. Moreover, recently network structure stability has become the subject of a separate field of research within complex network science, where the attack vulnerability of a complex network is treated by means of a combination of tools of random graph theory [1] and those of percolation theory [2] and statistical physics [3]. The very notion of attack vulnerability of a complex network originates from earlier studies of computer networks and reflects the decrease of network performance as caused by the removal or dysfunction of either their nodes or links (or both) [4, 5].
The study of network vulnerability against failure or attack has conceptually much in common with studies of percolation and they gained a lot from concepts and insights in percolation theory. However, standard percolation theory [2] deals with homogeneous lattices whereas the non-homogeneity of complex networks gives rise to a variety of phenomena which are particular for these structures. To give an example, the empirical analysis of numerous scale-free real-world networks (the www and the internet [4, 5], metabolic [6], food web [7], protein [8] networks) has revealed that these networks display an unexpectedly high degree of robustness under random failure. However, if the scenario is changed towards “targeted” attacks, the same networks may appear to be especially vulnerable [9, 10]. It is the non-homogeneity of networks that allows to choose different attack scenarios, i.e. to remove network links or nodes not at random, but following specific sequences prepared according to characteristics determining their ‘importance’. For vertex-targeted attacks, the sequence may be ordered by decreasing vertex degree [11, 12] or betweenness centrality [14] for the unperturbed network and the attack successively removes vertices according to this original sequence. One may further extend the above scenarios by recalculating the characteristics of the remaining vertices after each removal step and reordering the lists [4]. Former analysis has shown that attacks according to recalculated lists often turn out to be more effective [13, 14].
So far, the prevailing analytic results on complex network stability have been obtained for idealized models of infinite networks. In particular, important insight on network structure stability may be gained assuming that a complex network may perform its function as long as it possesses a giant connected component (GCC) i.e. a connected subnetwork which in the limit of an infinite network contains a finite fraction of the network. Under this assumption, the network robustness may be judged using the Molloy-Reed criterion, which has been formulated for essentially treelike networks with a given node degree distribution but otherwise random linking between vertices. The criterion for a GCC to be present in such networks is [9, 10, 15]:
| (1) |
where means the ensemble average over networks with given . Defining the Molloy-Reed parameter as the ratio of the moments of the degree distribution
| (2) |
one may rewrite (1) as:
| (3) |
For an uncorrelated network the parameter can be equally represented by the ratio between the mean number of next neighbors (which is by definition equal to the mean node degree ) and the mean number of second nearest neighbors:
| (4) |
In terms of , condition (3) can be rewritten as:
| (5) |
For obvious reasons, relations (3), (5) can not be directly applied to real-world networks, which usually are correlated and are of finite size. Therefore, an important issue which arises in the analysis of attack vulnerability of real-world networks is the choice of the observables which may be used to measure network stability. Since the GCC is well-defined only for an infinite network, often the size of the largest network component is used. Alternatively, one can estimate network stability from the average shortest path lengths or their inverse values [14, 18]. Recently, a unique measure for robustness was introduced [16, 17] and has been used to devise a method to restructure a network and to make it more robust against a malicious attack. Observing the normalised size of the largest component as function of the share of removed vertices or links a measure of stability is provided by the area A under the curve for the interval . We will normalise this value as
| (6) |
Here, the size of the largest component is normalised such that . In this respect, the measure captures the network reaction over the whole attack sequence. The goal of this paper is to elaborate criteria, which allow to give a priori information on the attack stability of real world correlated networks of finite size and to check how these criteria correspond to the analytic results available for the infinite uncorrelated networks. As a case study, we consider public transportation networks (PTN) of several major cities of the world. This paper continues studies initiated in [18], where we have considered PTN attack vulnerability. The results presented below complement Ref. [18] by describing the effects of link-targeted attacks as well as by applying the above mentioned measure for network robustness [16, 17] to evaluate attack efficiency.
For the remaining part of the paper we will use the following set-up. In the next section we will shortly describe our PTN database, attack scenarios and the observables used to describe different features of the PTNs considered here. Results for the transportation network stability against node-targeted and link-targeted attacks will be given in sections 3 and 4, correspondingly. In section 5 we present some observed correlations between PTN characteristics measured prior to attack and the PTN stability during attacks following different scenarios. Discussions and outlook are presented in section 6.
2 Database and attack scenarios description
The systematic analysis of PTN using tools of complex network theory dates back to the early 2000-s [23] and continues to this day [18, 19, 20, 21, 22, 24]. It has been revealed that these networks share common statistical properties: they appear to be strongly correlated small-world structures with high values of clustering coefficients and comparatively low mean shortest path values. The power-law node degree distributions observed for many PTN give strong evidence of correlations within these networks.
| \topruleCity | Type | |||||||||
|---|---|---|---|---|---|---|---|---|---|---|
| \colruleBerlin | BSTU | 2992 | 211 | 2.58 | 68 | 18.5 | 52.8 | 1.96 | 3.16 | (4.30) |
| Dallas | B | 5366 | 117 | 2.18 | 156 | 52.0 | 55.0 | 1.28 | 2.35 | 5.49 |
| Düsseldorf | BST | 1494 | 124 | 2.57 | 48 | 12.5 | 24.4 | 1.96 | 3.16 | 3.76 |
| Hamburg | BFSTU | 8084 | 708 | 2.65 | 156 | 39.7 | 254.7 | 1.85 | 3.26 | (4.74) |
| Hong Kong | B | 2024 | 321 | 3.59 | 60 | 11.0 | 60.3 | 3.24 | 5.34 | (2.99) |
| Istanbul | BST | 4043 | 414 | 2.30 | 131 | 29.7 | 41.0 | 1.54 | 2.69 | 4.04 |
| London | BST | 10937 | 922 | 2.60 | 107 | 26.5 | 320.6 | 1.87 | 3.22 | 4.48 |
| Moscow | BEST | 3569 | 679 | 3.32 | 27 | 7.0 | 127.4 | 6.25 | 7.91 | (3.22) |
| Paris | BS | 3728 | 251 | 3.73 | 28 | 6.4 | 78.5 | 5.32 | 6.93 | 2.62 |
| Rome | BT | 3961 | 681 | 2.95 | 87 | 26.4 | 163.4 | 2.02 | 3.67 | (3.95) |
| Saõ Paolo | B | 7215 | 997 | 3.21 | 33 | 10.3 | 268.0 | 4.17 | 5.95 | 2.72 |
| Sydney | B | 1978 | 596 | 3.33 | 34 | 12.3 | 82.9 | 2.54 | 4.37 | (4.03) |
| Taipei | B | 5311 | 389 | 3.12 | 74 | 20.9 | 186.2 | 2.42 | 4.02 | (3.74) |
| \botrule |
In this work we analyse a selection of PTNs drawing from a database compiled by the present authors earlier and described in Refs. [18, 19, 20, 21, 22]. The choice for the selection of these PTNs is motivated by the idea to collect network samples from cities of different geographical, cultural, and economical background. Some characteristics of these networks are given in table 1. For each selected city the available information on all different types of public transportation is included. More data as well as details about the database are given in [18, 22]. As one can see from the table, the typical number of routes is several hundreds while the typical number of stops (i.e. network nodes) is several thousands with a mean node degree of . This number of network nodes is to be related to comparatively low values for the mean and maximal shortest path. As mentioned above, the node degree distribution for some of the PTN has been observed [18, 22] to display a power-law decay
| (7) |
for large values of the node degree . Results for the corresponding exponent values are given in the last column of table 1. If the distribution is better fitted by an exponential decay, the exponent corresponding to a power-law fit is given in brackets (this is the case for seven out of thirteen listed PTNs). As a measure of local network correlation we give the mean clustering coefficient of each PTN normalised by the value for an Erdos-Renyi random graph with the same numbers of nodes and links , . Recall that the clustering coefficient of a given node is the ratio of the number of links between the nearest neighbours of node and the maximal possible number of mutual links between these:
| (8) |
The values of quoted in table 1 give convincing evidence for the presence of strong local correlations.
In our earlier work on the PTN resilience to attacks of different types we introduced different scenarios to remove network nodes or links, to model random failure or attack. However, the focus of that work was primarily on node-targeted attacks. In previous work [18, 20, 21], the present authors have shown that for PTNs the most effective attack scenarios correspond to removing nodes either with highest degree or with highest betweenness centrality values . For a given node , the latter quantity is defined as:
| (9) |
where is the number of shortest paths between nodes and and is the number of these paths that go via node .
The results presented below show the outcome of node- and link-targeted attacks, where either nodes or links are removed following specific sequences corresponding to so-called scenarios. For node-targeted attacks we concentrate on five different scenarios, by selecting the nodes: (i) at random, (ii) according to their initial degree (prior to the attack) (iii) according to their degree recalculated after nodes of higher degree have been removed (iv) according to their initial betweenness centrality (v) according to their recalculated betweenness centrality. The same five scenarios are implemented for the link-targeted attacks. However, in this case one has to generalize the notions of node degree and betweenness centrality for links. We will define the degree of the link between nodes and with degrees and as:
| (10) |
For the simple graph with two vertices and a single link, the link degree will be zero, , while for any link in a connected graph with more than two vertices the link degree will be at least one, . The link betweenness centrality measures the importance of a link with respect to the connectivity between the nodes of the network. The link betweenness centrality is defined as
| (11) |
where is the number of shortest paths between the two nodes , that belong to the network , and is the number of shortest paths between nodes and that go through the link .
The two subsequent sections demonstrate how PTNs react on attacks of the above described scenarios when these attacks are targeted on PTN nodes (section 3) and links (section 4). To quantify the outcome of these attacks we monitor the evolution of the normalised size of the largest network component as function of the share (with ) of removed links or nodes:
| (12) |
where is the initial number of nodes of the largest connected component while is the corresponding remaining number of nodes in that component after a share of nodes or links has been removed. Obviously, any network of non-zero size will have a largest connected component.
3 Node-targeted attacks
The outcome of attacks targeting PTNs nodes has been reported by the present authors in Refs. [18, 20, 21]. In particular, results of attacks of sixteen different scenarios have been presented and the most effective ones were singled out. Here, we recall the results of the five scenarios laid out in the previous section. In particular, this will allow to compare these with the corresponding link-targeted attack scenarios (section 4) and analysing these to elaborate criteria for network stability (section 5).
a b
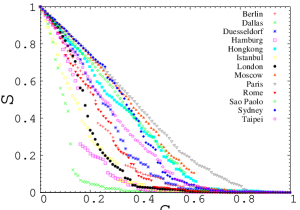
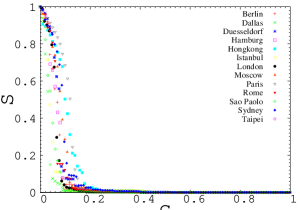
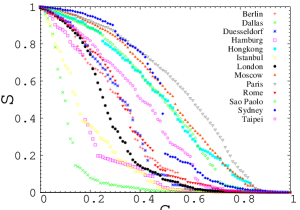
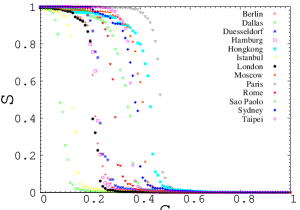
In figure 1 we show the dependence of the normalized size (12) of the largest connected cluster as function of the share of removed PTN nodes for two attack scenarios: in the first one, Fig. 1 a the PTN nodes are removed at random, in the second one, Fig. 1 b the nodes are removed according to the a list of the nodes ordered by their node degree recalculated after each step comprising the removal of 1% of the initial nodes. In the following, we will call this scenario the ’recalculated node degree scenario’. As noted, instead of recalculating the PTN characteristics after the removal of each individual node, the nodes are removed in groups of 1% of the initial nodes and the PTN characteristics are recalculated after the removal of each such group. The random scenario Fig. 1 a presents results of a single instance of an attack, we have verified, however, that due to the large size of the PTNs size a certain ’self-averaging’ effect takes place: averaging of over many random attack sequences instances do not significantly modify the picture for presented in Fig. 1 a. As one may infer from the figures, the individual PTNs may react on the attacks in very different way, ranging from a gradual decrease of as function of to sudden jumps at certain values of . A further striking feature of the plots visualising these scenarios is the qualitative differences seen between individual PTNs as well as between different attack scenarios.
a b
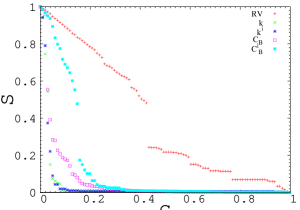
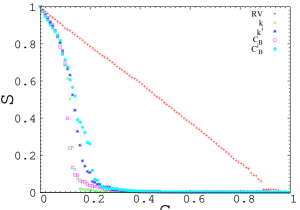
To further illustrate the reaction of a given PTN to attacks of different type, we present in Fig. 2 the changes in the largest component size of the PTNs of Dallas (Fig. 2 a) and Paris (Fig. 2 b) for attacks of five different scenarios, as described in the former section [19]. For the case of the Paris PTN we observe that for small values of the share of removed nodes () these scenarios cause practically indistinguishable impact on and is a linear function of . As increases, deviations from the linear behavior arise and the impact of different scenarios starts to vary. In particular, there appear differences between the roles played by the nodes with highest value of and highest betweenness centrality . Whereas the first quantity is a local one, i.e. it is calculated from properties of the immediate environment of each node, the second one is global. Moreover, the -based strategy aims to remove a maximal number of edges whereas the -based strategy aims to cut as many shortest paths as possible. In addition, there arise differences between the ’initial’ and ’recalculated’ scenarios, suggesting that the network structure changes as important nodes are removed. Similar behavior of is observed for all PTNs included in this study, while the order of effectiveness of different attack scenarios may differ between PTNs.
4 Link-targeted attacks
a b
a b
A particular feature of link-targeted attacks is that when a link is removed, the neighbouring nodes survive. Therefore, during the link-targeted attacks all the nodes survive to the end of an attack, i.e. the number of nodes does not change, while the share of the removed links increases. In Figs. 3 and 4 we monitor the behaviour of the normalised size for the largest connected component (12) but now as a function of the removed links following corresponding link-attack scenarios. Besides removing links at random we will use the sequences ordered according to link degree and link betweenness centrality, (10), (11) either calculated for the initial unperturbed PTN (we will indicate the corresponding scenario by a superscript , e.g. ) or following sequences with lists recalculated for the remaining links after each step of removing 1% of the initial set of links.
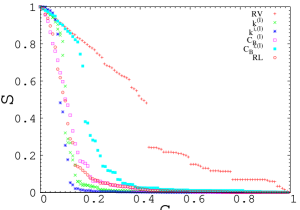
In Fig. 3 a we show the change of the normalised size of the largest cluster under random link-targeted attacks (RL). If one compares this behavior with that observed for the random node removal scenario (RV) (see Fig. 1 a) one can see, that for most PTNs with strong resilience to random node-targeted attacks random link removal is even less effective. On the other hand, for PTN with weak resilience there seems to be no significant difference. Similar to the random node attacks (RV) scenarios the random link attacks (RL) lead to changes of the largest connected component that range from an abrupt breakdown (Dallas) to a slow smooth decrease (Paris). The decay is even slower than for random node removal - removing a link does not necessary lead to removing a node from the largest cluster, while removing a node from the completely connected network decreases it at least by one node.
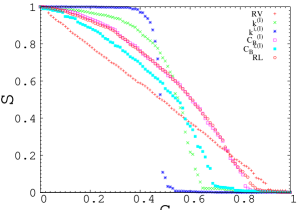
Typical results for PTNs under different types of link-targeted attacks as applied to the PTNs of Dallas and Paris are displayed in Fig. 4. We show how the normalised size of the largest connected component of the Dallas (a) and Paris (b) PTN varies as function of the share of removed links following the above described attack scenarios. As one can see, there is no significant difference between the effectiveness of most scenarios including the random one for the PTN of Dallas. The vulnerability behavior of the Dallas PTN under link-targeted attacks appears not to differ from the corresponding random vertex removal approach. For Paris the situation is quite different. The main observation is that initially the random vertex attack is more effective than any link-targeted attack, until breakdown and further, and only once the near to 50% of the links have been removed the recalculated link degree () targeted scenario starts to be more harmful. Comparing different link-targeted scenarios one notices similar behavior between these, only the recalculated degree scenario line initially decays slower, however to become more effective near to the breakdown. In the following section we will compare outcomes of node- and link-targeted attacks in more detail.
The special behaviour of the recalculated link degree behaviour may be explained as follows: in each removal step the links with highest link degrees are removed, However, these may belong to a number of different nodes. The affected nodes will therefore remain, however, with lower degrees. After recalculation the links on these nodes affected in the last step will have moved to lower places in the ordered list such that other links will be affected. This will continue until the degrees of all nodes have been reduced to three or less. At that point the removal of almost any link will cut down the connected component and a rapid breakdown of the largest component takes place.
When the sequence for the removal of links is calculated using the initial degrees of the vertices, then obviously in the first 1% step a set of all links connected to the highest degree vertices are removed which is approximately equivalent to removing the corresponding 1% of all highest degree nodes. As far as no recalculation is involved the second step will essentially cut the links off the second 1% of highest degree nodes. Disregarding correlations between these operations one may therefore expect that the initial link and node degree scenarios result in ‘similar breakdown behaviour.
5 Robustness measures and correlations
| \toprule City | Node-targeted attacks | Link-targeted attacks | ||||||||
|---|---|---|---|---|---|---|---|---|---|---|
| RV | RL | |||||||||
| \colruleBerlin | 22.71 | 6.52 | 7.12 | 7.27 | 9.44 | 31.21 | 22.27 | 25.57 | 29.91 | 30.92 |
| Dallas | 9.81 | 3.41 | 3.61 | 6.07 | 13.28 | 11.17 | 8.94 | 10.68 | 11.75 | 19.58 |
| Düesseldorf | 25.47 | 7.45 | 9.39 | 8.26 | 12.65 | 31.22 | 23.88 | 28.69 | 30.58 | 31.44 |
| Hamburg | 15.82 | 6.34 | 6.99 | 6.53 | 12.19 | 20.74 | 22.49 | 24.02 | 20.22 | 20.47 |
| Hong Kong | 31.57 | 9.99 | 9.78 | 6.1 | 15.0 | 47.55 | 41.41 | 40.17 | 47.08 | 34.13 |
| Istanbul | 16.05 | 4.46 | 5.03 | 5.62 | 9.42 | 18.45 | 13.13 | 15.1 | 19.78 | 18.86 |
| London | 29.31 | 5.45 | 6.28 | 8.71 | 14.17 | 27.45 | 20.95 | 22.85 | 27.2 | 27.33 |
| Moscow | 34.61 | 8.02 | 8.37 | 7.82 | 11.63 | 51.18 | 38.99 | 41.96 | 50.68 | 41.58 |
| Paris | 37.93 | 10.77 | 13.12 | 10.67 | 14.07 | 56.04 | 47.12 | 51.83 | 55.93 | 48.03 |
| Rome | 22.26 | 6.61 | 7.68 | 7.05 | 14.81 | 32.52 | 29.2 | 27.8 | 33.99 | 30.13 |
| Sãopaolo | 32.4 | 4.43 | 4.59 | 5.22 | 6.23 | 47.09 | 33.19 | 32.08 | 47.46 | 33.85 |
| Sydney | 32.15 | 8.74 | 9.49 | 6.61 | 18.53 | 46.45 | 37.26 | 35.74 | 49.14 | 26.15 |
| Taipei | 27.59 | 10.92 | 13.55 | 11.71 | 20.31 | 39.35 | 36.03 | 40.41 | 38.21 | 35.37 |
| \botrule | ||||||||||
As it was mentioned in the Introduction, different indicators may be used in order to evaluate network stability. Here, for this purpose we will use a measure, recently introduced in Refs. [16, 17]. In our case, this measure corresponds to the area below the curve describing the normlised size as function of the share of removed links, as defined by Eq. (6). As follows from the definition, the measure captures the effects on the network over the complete attack sequence. It is especially useful in the analysis of the real-world networks which are of finite size and usually are not characterized by a single well-defined concentration at which phenomena analogous to percolation (network clustering) occurs. Instead, the value is an integral characteristics, which is well-defined for a finite-size network and is, as we will see below, nicely suited to compare robustness of different PTN during attacks. In table 5 we give the value of for the node- and link-targeted attacks (left and right parts of the table, correspondingly). Columns marked as RV (RL) give for the attacks at which nodes (links) were chosen at random, these numbers can be compared with the outcome of attacks made according to the initially prepared sequences of nodes (links) ordered by decreasing degrees (, ) and betweenness centralities (, ). For the last four scenarios these indicators were recalculated after each step of the attack, and the corresponding results are given in columns marked as , and , .
With the data of table 5 at hand, it is easy to compare the robustness of a given PTN to attacks of different scenarios as well as to compare the robustness of different PTNs. Assuming that the most stable PTNs are those characterized by larger values of one may conclude from the table, that for the node-targeted attacks the most harmful appear to be attacks targeted either on the nodes of highest degree (PTN of Berlin, Dallas, Düsseldorf, Hamburg, Istanbul, London, Rome, Saõpaolo, and Taipei) or on the nodes of highest betweenness centrality (Hong Kong, Moscow, Paris, Sydney). Another observation is that attacks performed according to the lists of nodes recalculated after each step of the attack scenario appear to be more effective than those performed according to the lists prepared prior to the attack. Moreover, this difference is much more pronounced for the highest betweenness centrality targeted nodes as for those with highest node degree.
On the other hand, for link-targeted attacks the most effective appear to be the highest link degree targeted attacks according to the recalculated (PTN of Berlin, Dallas, Düsseldorf, Istanbul, London, Moscow, Paris) or initial (Rome, Saõpaolo) lists of links. Only for the PTN of Hamburg, Hong Kong, Taipei, and Sydney the highest betweenness centrality scenario appears to be the most effective, however even in this case the difference between different scenarios is not much pronounced. This similarity in behaviour for ’initial’ and ’recalculated’ scenarios seems to be an intrinsic feature of the link-targeted attacks. Moreover, as we noticed before, sometimes the ’initial’ approach occurs to be more effective. It is interesting to mention that for three PTN (Hamburg, Istanbul, Sydney) which are not very resilient against any kind of attacks (however not for PTN of Dallas, which is least), most efficient is the scenario of removing links with initial highest values of the betweenness centrality . It is worthwhile to note here, that the order of the PTN according to their vulnerability under link-targeted attacks is similar to that for the node-targeted scenarios, there are just few light shifts.
a b
c d
e f
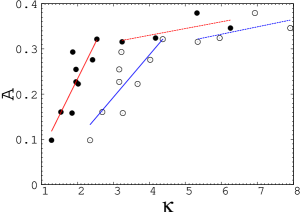
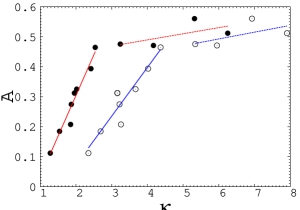
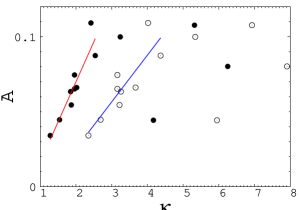
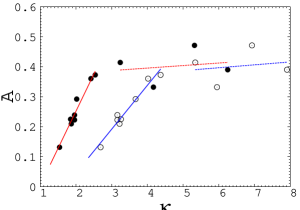
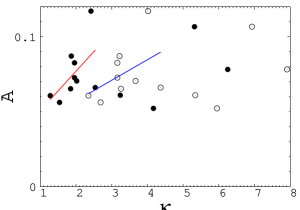
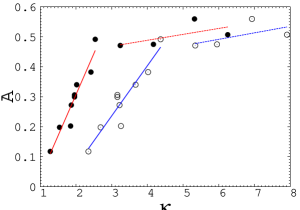
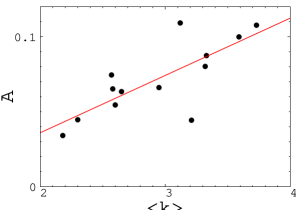
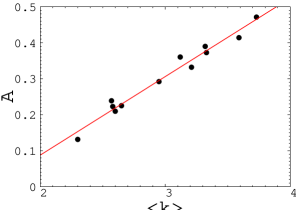
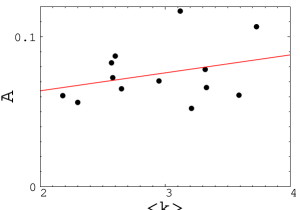
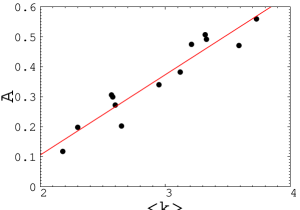
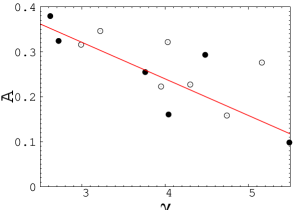
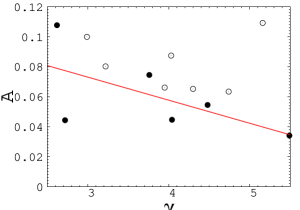
To further shed light on correlation between the network characteristics prior to the attack and their stability during the attack we check correlation of , Eq. (6), for all PTN out of our database at different attack scenarios (table 5) with the value of the Molloy-Reed parameters , Eq. (2), and , Eq. (4) of the unperturbed networks, as given in Table 1. The results are displayed in Figs. 5. There we show the value of correlated with the Molloy-Reed parameters (filled circles), and (open circles) of the same network for the node- and link-targeted attacks (left and right columns, correspondingly). One notices two different regimes in the behavior of the relation between and for random and recalculated highest degree scenarios both for node- and link-targeted attacks. First, rapidly increases with an increase of , then, in the second regime, when exceeds certain ’marginal’ value, there is no pronounced correlation between and any more, however still a weak increase of with is observed. These two regimes are observed both in and functions, however the behavior is more pronounced in plots (filled circles). We show the linear fits for both regimes by solid lines in the figures. The region of where the first regime is observed is (). Thus, if two PTNs have initial values of corresponding Molloy-Reed parameters in this region, it is very probable, that the PTN with higher value of will be essentially more stable than the PTN with lower value of . However, the PTNs with the Molloy Reed parameters () although in general being more stable than those with lower do not differ substantially in their stability. A similar bahaviour is observed for the link-targeted highest betweenness centrality attacks (Fig. 5 f) but it is less pronounced, even less pronounced it is for the node-targeted highest betweenness centrality attacks (Fig. 5 e), where almost no correlation between and is observed. To understand the origin of the particular sensitivity of PTN stability for small values of , let us recall the results for uncorrelated networks (see formulas (3), (5) and references in the text): a GCC in an infinite network can exist only if exceeds the marginal value of (). In the vicinity of this marginal value the network is especially sensitive to even slight changes. Obviously, the finiteness of the PTN and the correlation effects present there lead to a variation for the criteria (3), (5), however a general sensitivity of network stability to the changes in for small remains.
a b
c d
e f
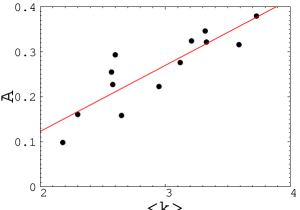
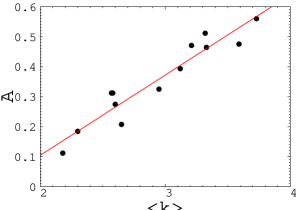
Another interesting observation is illustrated by Figs. 6. There, we show the correlation of with the mean node degree for the random (a, b), recalculated degree (c, d) and recalculated betweenness (e, f) scenarios. A generic feature of the plots is the linear increase of with increasing of which is observed for all values of and for all three scenarios. A similar increase is observed both for the node- and link-targeted attacks, c.f. Figs. 6 (a, c) and Figs. 6 (b, d), however the linear approximation holds for the node-targeted attacks with less accuracy and is almost useless for the highest betweenness centrality plots, Fig. 6 (e). The corresponding fits are shown by solid lines in the figures. The plots of Figs. 6 demonstrate correlation of the network stability with the initial ’density’ of network constituents, nodes or links, without relation to the correlations in the PTN structure. This is different to the plots of Fig. 5, where the correlations where considered by analyzing the second moment of the node degree distribution , that enters the Molloy-Reed parameter. Therefore, Fig. 6 shows the correlation of the network stability measure with the mean node degree, . There, for both cases, within the expected scatter of data one observes clear evidence of an increase of with , i.e. networks with smaller mean node degree break down at smaller values of and are thus more vulnerable to the attacks. Again, this observation holds for the link-targeted attacks as well for the node-targeted attack of random and recalculated highest degree scenarios.
a b
For the node-targeted attacks on scale-free networks it is useful also to check the correlation between the node degree distribution exponent , Eq. (7) and the stability measure . Analytic results for infinite scale-free networks as well as empirical observations for numerous real-world scale-free networks have confirmed a particular stability of scale-free networks: there is no percolation threshold for exponents [9, 10]. As we have observed in the previous studies [19] some of the PTNs under consideration are scale-free: their node-degree distributions have been fitted to a power-law decay (7) with the exponents shown in Table 1. Others are characterized rather by an exponential decay, but up to a certain accuracy they can also be approximated by a power-law behavior (then, the corresponding exponent is shown in Table 1 in brackets). In Fig. 7a and 7b we show the correlation between the fitted node-degree distribution exponent and for the random and recalculated node degree scenarios. One observes a notable tendency to find PTNs with smaller values of to be more resilient as indicated by larger values of . This tendency holds even if we include the PTNs which are better described by the exponential decay of the node-degree distributions.
6 Conclusions and outlook
In this paper we have presented an empirical analysis of the reaction of PTNs of different cities of the world upon random failure or directed attack scenarios. There may be numerous reasons for individual failure, ranging from a random accident to a targeted destruction. However, in accumulation these may lead to an emergent behavior as a result of which the PTN ceases to function. On the one hand our analysis is motivated by practical interest in the stability of individual PTNs thereby comparing the operating features of different PTNs. On the other hand we were seeking to identify criteria, which allow to judge a priori on the attack stability of real world correlated networks of finite size checking how do these criteria correspond to the analytic results available for the infinite uncorrelated networks.
To perform the present analysis we have used previously accumulated [19] data on PTNs of several major cities of the world (see table 1) and simulated attacks of different scenarios targeted on the PTN nodes and links. To quantify the PTN stability to attacks of different scenarios we use a recently introduced [16, 17] numerical measure of network robustness. In our case, this measure is defined as the area below curve described by the normalized size of the largest connected component as function of the share of removed nodes. In this respect, the measure captures the overall resilient behavior over the complete attack sequence. Table 5 allows to compare the robustness of a given PTN to attacks of different scenarios as well as to compare the relative robustness of different PTNs.
The comparison of PTN characteristics measured prior to the attack with the PTN robustness monitoring its behaviour during the attack allowed us to propose criteria that allow an a priori estimate of PTN robustness and stability with respect to an attack. This stability is indicated by a high value of the Molloy-Reed parameters , Eq. (2), and , Eq. (4) as well as by the high value of the mean node degree of the unperturbed networks. Moreover, if the PTN node degree distribution manifests a power-law decay, we have observed a notable tendency to find PTNs with smaller values of to be more stable.
Acknowledgments
BB, CvF, and YuH acknowledge partial support by the FP7 EU IRSES project N269139 ’Dynamics and Cooperative Phenomena in Complex Physical and Biological Media’. This work was in part performed in frames of the COST Action MP0801 ’Physics of Competition and Conflicts’.
References
- [1] Albert, R. and Barabási, A.-L., Rev. Mod. Phys. 74 (2002) 47; Dorogovtsev, S. N. and Mendes, J. F. F., Adv. Phys. 51 (2002) 1079; Newman, M. E. J., SIAM Review 45 (2003) 167; Dorogovtsev, S. N. and Mendes, J. F. F., Evolution of Networks (Oxford University Press, Oxford, 2003).
- [2] Essam, J. W., Rep. Prog. Phys. 43 (1980) 833; Stauffer, D. and Aharony A., Introduction to Percolation Theory (Taylor & Francis, London, 1991).
- [3] Dorogovtsev, S. N., Goltsev, A. V., and Mendes, J. F. F., Rev. Mod. Phys. 80 (2008) 1275.
- [4] Albert, R., Jeong, H., and Barabási, A.-L., Nature (London) 406 (2000) 378.
- [5] Tu, Y., Nature (London) 406 (2000) 353.
- [6] Jeong, H., Tombor, B., Albert, R., Oltvai, Z. N., and Barabási, A.-L., Nature (London) 407 (2000) 651.
- [7] Solé, R. V., Montoya, J. M., Proc. R. Soc. Lond. B 268 (2001) 2039.
- [8] Jeong, H., Mason, S. P., Barabási A.-L., and Oltvai Z. N., Nature (London) 411 (2001) 41.
- [9] Cohen, R., Erez, K., ben-Avraham, D., and Havlin, S., Phys. Rev. Lett. 85 (2000) 4626.
- [10] Callaway, D. S., Newman, M. E. J., Strogatz, S. H., and Watts, D. J., Phys. Rev. Lett. 85 (2000) 5468.
- [11] Barabási, A.-L. and Albert, R., Science 286 (1999) 509; Barabási, A.-L., Albert, R., and Jeong, H., Physica A 272 (1999) 173.
- [12] Broder, A., Kumar, R., Maghoul, F., Raghavan, P., Rajagopalan, S., Stata, R., Tomkins, A., and Wiener, J., Comput. Netw. 33 (2000) 309.
- [13] Girvan, M. and Newman, M. E. J., Proc. Natl. Acad. Sci. USA 99 (2002) 7821.
- [14] Holme, P., Kim, B. J., Yoon, C. N., and Han, S. K., Phys. Rev. E 65 (2002) 056109.
- [15] Molloy M. and Reed B. A., Random Struct. Algorithms 6 (1995) 161; Molloy, M. and Reed, B., Combinatorics, Probability and Computing 7 (1998) 295.
- [16] Schneider, C. M, Mihaljev T., Havlin, S., and Herrmann, H. J., Restrainig epidemics by improving immunization strategies, preprint arXiv:1102.1929v1 (2011).
- [17] Schneider, C. M, Moreira, A. A., Andrade, Jr., J. S., Havlin, S., and Herrmann, H. J., PNAS 108 (2011) 3838.
- [18] Berche, B., von Ferber, C., Holovatch, T., and Holovatch, Yu., Eur. Phys. J. B 71 (2009) 125.
- [19] von Ferber, C., Holovatch, T., Holovatch, Yu., and Palchykov, V., Eur. Phys. J. B 68 (2009) 261.
- [20] von Ferber, C., Holovatch, T., and Holovatch, Yu., in Traffic and Granular Flow’07, eds. Appert-Rolland, C., Chevoir, F., Gondret, P., Lassarre, S., Lebacque, J.-P., and Schreckenberg, M. (Springer, 2009), pp. 721-732 (arXiv:0709.3206).
- [21] Berche, B., von Ferber, C., Holovatch, T., and Holovatch, Yu., Dynamics of Socio-Economic Systems 2 (2010) 42.
- [22] Holovatch, T., Complex Transportation Networks: Resilience, Modelling and Optimisation, Ph.D. thesis, Nancy University, France & University of Coventry, GB (2011). http://tel.archives-ouvertes.fr/tel-00652784/fr/
- [23] Marchiori, M. and Latora V., Physica A 285 (2000) 539; Latora, V. and Marchiori, M., Phys. Rev. Lett. 87 (2001) 198701; Latora, V. and Marchiori M., Physica A 314 (2002) 109; Seaton, K. A. and Hackett, L. M., Physica A 339 (2004) 635; von Ferber, C., Holovatch, Yu., and Palchykov, V., Condens. Matter Phys. 8 (2005) 225; Sienkiewicz, J. and Holyst, J. A., Phys. Rev. E 72 (2005) 046127; Sienkiewicz, J., and Holyst, J. A., Acta Phys. Polonica B 36 (2005) 1771.
- [24] Angeloudis, P. and Fisk, D., Physica A 367 (2006) 553; Zhang, P.-P., Chen, K., He, Y., Zhou, T., Su, B.-B., Jin, Y., Chang, H., Zhou, Y.-P., Sun, L.-C., Wang, B.-H., and He, D.-R., Physica A 360 (2006) 599; von Ferber, C., Holovatch, T., Holovatch, Yu., and Palchykov, V. Physica A 380 (2007) 585; Xu, X., Hu, J., Liu, F., and Liu, L., Physica A 374 (2007) 441; Chang, H., Su, B.-B., Zhou, Y.-P., and He, D.-R., Physica A 383 (2007) 687; Hu, M.-B., Jiang, R., Wu, Y.-H., Wang, W.-X., Wu, Q.-S., Eur. Phys. J. B 63 (2008) 127; Zhu, Z.-T., Zhou, J., Li, P., Chen, X.-G., Chinese Physics B 17 (2008) 2874; von Ferber, C., Holovatch, T., Holovatch, Yu., and Palchykov, V., in Traffic and Granular Flow’07, eds. Appert-Rolland, C., Chevoir, F., Gondret, P., Lassarre, S., Lebacque, J.-P., and Schreckenberg, M. (Springer, 2009), pp. 709-720 (arXiv:0709.3203); Derrible, S. and Kennedy, C., Transportation 37 (2010) 275; Derrible, S. and Kennedy, C., Physica A 389 (2010) 3678; Derrible, S. and Kennedy, C., Transport Reviews (2011) 1-25.