Liquid-liquid phase transition model incorporating evidence for ferroelectric state near the lambda-point anomaly in supercooled water.
Abstract
We propose a unified model combining the first-order liquid-liquid and the second-order ferroelectric phase transitions models and explaining various features of the -point of liquid water within a single theoretical framework. It becomes clear within the proposed model that not only does the long-range dipole-dipole interaction of water molecules yield a large value of dielectric constant at room temperatures, our analysis shows that the large dipole moment of the water molecules also leads to a ferroelectric phase transition at a temperature close to the point. Our more refined model suggests that the phase transition occurs only in the low density component of the liquid and is the origin of the singularity of the dielectric constant recently observed in experiments with supercooled liquid water at temperature . This combined model agrees well with nearly every available set of experiments and explains most of the well-known and even recently obtained results of MD simulations.
Supercooled water exhibits a number of well-known anomalies near the so-called point at temperature (at normal pressure), where a good number of thermodynamic quantities such as heat capacity, compressibility, thermal expansivity, and dielectric constant all exhibit nearly singular behavior angell1973anomalous ; speedy1976isothermal ; hodge1978relative . The intrinsic thermodynamic instability of liquid water at temperatures well below the freezing point has been a major obstacle both in experimental studies and theoretical modeling (see e.g. mishima1998relationship ; debenedetti2003supercooled ; DebenedettiStanley2003 ; angell2004amorphous ; stanley2010water ; buldyrev2007water ; han2010phase ; kumar2009anomalies for a review). The observed features are often weak, which suggests a thermodynamic continuity of the various water states near the point and relates the observed “singularity” with essentially a random sharp feature, a function of the parameters of the liquid sastry1996singularity ; rebelo1998singularity . A considerably more accepted view is to ascribe the features characteristic of a phase-transition to a first-order liquid-liquid phase transition (LLPT). This model predicts the existence of a second critical point of water at the temperature and pressure poole1992phase ; poole1994effect . The sharp temperature dependencies observed near are attributed to crossing the Widom line xu2005relation , where the density and entropy fluctuations are large bertrand2011peculiar and which happens at at normal pressure. The view is supported by numerous molecular dynamics (MD) simulations based on realistic water models poole1992phase ; stanley1994there ; tanaka1996phase ; harrington1997equation ; yamada2002interplay ; jedlovszky2005liquid ; paschek2005liquid ; paschek2008thermodynamic ; liu2009low ; abascal2010widom , simplified analytical models truskett1999single ; truskett2002simple ; lee2001simple ; girardi2007liquid ; stokely2010effect , and experimental studies mishima1998relationship ; mishima2000liquid ; mallamace2008nmr ; mishima2010volume . The reported anomalies are not restricted to static features, the dynamic properties such as the Einstein relation between diffusion and mobility coefficients chen2006violation ; kumar2007relation and the Arrhenius behavior of the liquid’s dynamic properties xu2005relation ; kumar2007relation ; kumar2008predictions break down near as well.
Recent MD studies have demonstrated that heat capacity and thermal conductivity kumar2011thermal peak around as well and that the liquid shows a good deal of ordering in the vicinity of the point. Similarly, recent measurements of the dielectric properties of liquid water confined in nanopores and hence prevented from freezing well below the natural freezing point schreiber2001melting manifest a profound bump in the dielectric constant near the point fedichev2011experimental ; bordonsky2011 . These observations paint a richer picture than a mere first-order liquid-liquid phase transition and, in fact, bring back an old idea hodge1978relative relating the weak singularity of the dielectric constant to a ferroelectric phase transition (FPT). Remarkably, the hypothesis was put forward immediately after the discovery of the point, though the weakness of the observed singularities prompted the authors hodge1978relative to reject the explanation. Furthermore, the ferroelectric instability for a model liquid with parameters similar to water is predicted to occur at a very high and essentially unreachable temperature, bernal1933theory . A more sophisticated model fedichev2008fep ; fedichev2006long ; men2011 predicts a ferroelectric phase transition at a temperature independent of the details of the short-range interactions between the molecules,
| (1) |
where is the density and are the static dipole moments of the molecule comprising the liquid. The dielectric constant is not associated with the molecules’ degrees of orientational freedom and comes from electron shell polarization, (as discussed in e.g. stogrin1971 ; liebe1991model ; hasted1948dielectric ). Despite bringing the phase transition temperature into the right range, the model predicts a behavior of the dielectric constant with changes in temperature that is far too gradual when compared with empirical results fedichev2011experimental ; bordonsky2011 . Consequently, it cannot even qualitatively explain all of the features of supercooled water by itself. Realistic liquids such as water are far more complicated than a model polar liquid consisting of point dipoles. For example, the tetrahedral geometry of molecule and its electron shell leads to a polyamorphism phenomenon poole1995amorphous ; mishima1998relationship ; angell2004amorphous , namely two or more phases of the same liquid existing in a mixture at the same time.
To unify the observed ferroelectric-like properties of water-molecule ordering and the singularity of the dielectric constant near fedichev2011experimental ; bordonsky2011 with the previously reported signatures of the LLPT within a single theoretical framework, we combine our simple polar liquid phenomenology fedichev2008fep ; fedichev2006long ; men2011 ; fedichev2011experimental with the LLPT hypothesis poole1992phase ; poole1994effect ; mishima1998relationship using a two-component mixture model of water ponyatovskii1994pis . We assume that the equilibrium state of supercooled water is a mixture of macroscopically-sized clusters of the two types: low density (LDL) and high density liquid (HDL).The LDL local lattice is softer than that of HDL and the density of HDL exceeds that of LDL by mishima1998relationship ; myneni2002spectroscopic ; wernet2004structure ; tokushima2008high ; huang2009inhomogeneous ; english2011density . Since LDL is “softer”, the molecules of the LDL rotate more or less freely, whereas in the HDL the rotations are more difficult. This explains why HDL has no ferroelectric state at any temperature. We assume that the ferroelectric ordering and the FPT apparently observed in supercooled liquid bulk water occurs in the LDL component only.
The Gibbs free energy of an LDL cluster at a given pressure is the sum of the contributions from the polar liquid, , and the lattice, : At high temperatures, , the equilibrium state of LDL corresponds to the disordered paraelectric phase, whereas at lower temperatures, , LDL undergoes a second-order phase transition and enters the long-range-ordered ferroelectric state. Near the phase transition, where , the free energy of LDL takes the form:
| (2) |
where , and is the molar volume of LDL. Since the LDL density differs by no more than from the total liquid density, we will not distinguish between the LDL density and . The second-order FPT in LDL manifests itself as a singularity of the dielectric constant (see e.g. frohlich1949theory ):
| (3) |
where at and at , which is a much weaker dependence than that observed experimentally fedichev2011experimental . The discrepancy is apparently due to the very sharp temperature dependence of the LDL fraction near . To see that, we follow ponyatovskii1994pis and formulate a two-liquid model representing the Gibbs energy of water as the energy of a two-liquid mixture of macroscopic clusters using a representation similar to that used in the physics of binary alloys (see e.g. krivoglaz1958teoriya ):
| (4) |
Here is the free energy of the HDL component, and the parameter characterizes the “energy of mixing”. The equilibrium free energy and the LDL fraction are found through minimization of over , , or
| (5) |
where . The temperature of the second critical point in the model is ponyatovskii1994pis .
To analyze these equations, we follow ponyatovskii1994pis ; krivoglaz1958teoriya and assume that the thermodynamic quantities in are practically temperature-independent:
| (6) |
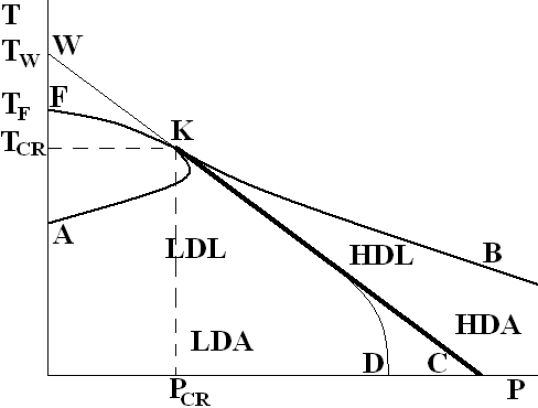
The PT diagram suggested by this model is shown in Fig.1. The AKB line in the Figure is the spinodal line corresponding to , . The KB line is the LDL spinodal, where the LDL phase loses its thermodynamic stability (the local minimum of the function corresponding to the LDL phase disappears on this line). In turn, the KA line is the HDL spinodal. The Gibbs potential has a single minimum everywhere above the AKB line and two minima below this line, at and . The section KC of the straight line WC is the liquid-liquid first-order phase transition line corresponding to the phase equilibrium conditions: , . According to Eqs.(4) and (5), these conditions are equivalent to , which, according to approximation (6), means that is a linear function of on the KC line, which means that the KC line is itself a straight line in Figure 1. The low and high density amorphous ice regions are denoted by LDA and HDA.
The KD line in Figure 1 corresponds to the limit at as required by the third law of thermodynamics and which is never the case under the assumptions (6). WK is the Widom line, defined by the conditions and , or, equivalently, . At small pressures the Widom temperature is . The heat capacity, consists of the two parts
| (7) |
where is the lattice contribution, which can be calculated e.g. using Debye approximation, , where (as suggested in angell1973anomalous ) and is the Debye frequency of water. Within the described model the polar part of is
| (8) |
At small pressures along the Widom line , is small, the fluctuations are strong, and the temperature dependence of the heat capacity contribution
| (9) |
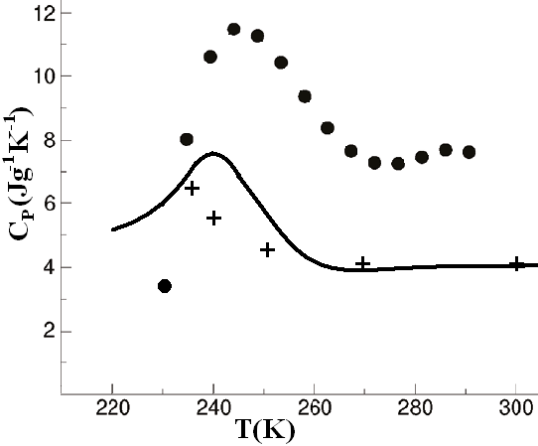
takes a standard Lorenz form, where , . The quantity peaks at in agreement with experiments debenedetti2003supercooled ; DebenedettiStanley2003 , earlier explanations xu2005relation , and recent calculations kumar2011thermal . Therefore we can use Eq. (9) to analyze the heat capacity calculated e.g. using MD from kumar2011thermal and extract the model parameters:
| (10) |
and These parameters correspond to , , and . To calculate we used from ponyatovskii1994pis , where very similar parameters were obtained: , , , and . These “original” parameters yield smaller critical pressure value: . The heat capacity calculated with the help of Eqs. (7), (8) and (10) is plotted on Fig.2 against the experimental values from angell1973anomalous and the recent MD calculations kumar2011thermal . Note that although the MD calculation does not provide a full match with the experimental curve in absolute terms, both data sets consistently describe the same feature and hence apparently the same physics. This in combination with the water molecules ordering predicted by the model (the entropy of LDL is less than that of HDL, , in accordance with DebenedettiStanley2003 ) and confirmed by the MD calculations is the indication of ferroelectric transition implicitly present already in the simulation kumar2011thermal .
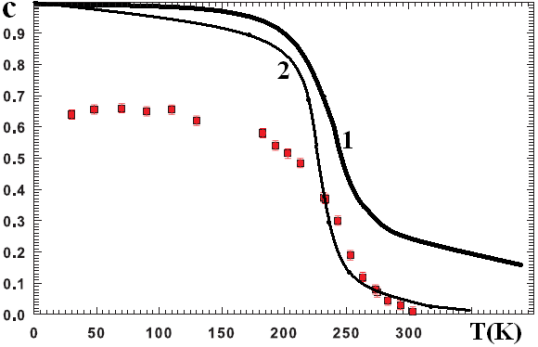
Once the model parameters (10) are established we can verify the consistency of the model by observing the temperature dependence of the LDL fraction given by Eq. (5) (see solid line in Figure 3) and compare it with the empirical data mallamace2008nmr (the dots in the same Figure). There is a qualitative agreement at least at sufficiently large temperatures above . We note, that as and therefore, at sufficiently low temperatures all of the liquid should turn into LDL, i.e. as . This leads us to believe that the equilibrium composition of water was not actually achieved in the experiments of mallamace2008nmr , even at very low temperatures. This may well be due to the increase of equilibration time at extremely low temperatures, as discussed in e.g. moore2010ice ; moore2011structural . With this in mind, we can attempt to match the LDL fraction measurements only at higher temperatures and obtain better agreement with the experiment using slightly different model parameters
| (11) |
and from ponyatovskii1994pis (see solid line in Figure 3). Although curves and are clearly different, both sets, (10) and (11), are very close numerically, which indicates further difficulties in refining the parameters due to a very sharp dependence of the LDL fraction next to the Widom line and clear experimental difficulties.
An analysis of the heat capacity and the LDL fraction measurement let us verify the model and determine the model parameters. Consequently, we may use the model to predict the temperature dependence of the dielectric constant and compare it with empirical data. Accordingly, the dielectric constant of the liquid is the sum of the LDL, with from Eq. (3), and the HDL contributions. The HDL fraction is , and its dielectric constant can be described by the Debye-Onsager model Onsager : . Therefore the full expression becomes
| (12) |
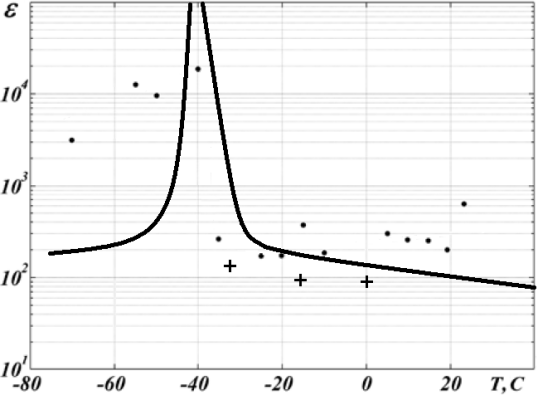
The predicted temperature dependence calculated using the parameters (10) and the value corresponding to is compared with recent experimental measurements fedichev2011experimental ; bordonsky2011 ; hodge1978relative in Figure 4. At high temperatures, the model dependence is not far from the experimentally observed values. The temperature dependence is now sharp, much stronger than that predicted by a simpler, single-component model fedichev2011experimental . This means that including more liquid states in the analysis clearly improves the agreement with experimental results. Below the transition point to the left of the peak, at , experiments yield distinctly different results. There may be many reasons for that. For example it is quite possible there is more than one LDL state of water below . The temperature itself may depend on the LDL cluster size, and therefore we may face a “continuous set” of ferroelectric transitions in a multitude of LDL forms as the temperature decreases.
When compared with available empirical data and numerical calculations, the model calculations of the heat capacity, LDL fraction, and the dielectric constant support a broader view, implying that supercooled water is indeed a mixture of at least two different components, namely LDL and HDL. There is a growing body of evidence for ferroelectric transition in LDL clusters. Independent of the theoretical arguments given above, the FPT in LDL can be supported by the structural similarity between the local structure of LDL and the crystalline lattice of stable ice Ih blackman1957cubic ; finney2002structures . At normal pressure the paraelectric ice Ih enters the ferroelectric state, ice XI, at temperature kawada1972dielectric ; jackson1997thermally ; singer2005hydrogen ; knight2006hydrogen . The ferroelectric state, ice XI, is obtained from hexagonal ice Ih after reconstruction of the crystalline lattice, namely, by the shifting of water molecules in each elementary cell of the crystal. It is interesting to note that theory barkema1993properties predicts antiferroelectric ordering of molecular dipole moments for Ih ice with undeformed crystalline lattice, but the ferroelectric state with a deformed lattice has a lower free energy. It is not surprising that, due to a less dense local crystalline lattice of LDL, the transition temperature observed in fedichev2011experimental ; bordonsky2011 essentially exceeds the corresponding value of FPT “ice Ihice XI”. It is also worth mentioning here that there have been important studies concerning the ferroelectric states of metastable ice Ic, with a cubic lattice first predicted in stillinger1977theoretical and detected experimentally in su1998surface ; iedema1998ferroelectricity . The reported explanation of the “ice Ihice XI” transition gives us cause to believe that the ferroelectric phase transition in LDL is also accompanied by the reconstruction of the local crystalline lattice, i.e. the dipolemoment orientation of molecules is strongly linked to the lattice’s degrees of freedom. On the other hand, FPT occurs only in LDL. Therefore, it is reasonable to assume that the KC line in Figure 1 is in fact the boundary between the ferroelectric and paraelectric regions of the supercooled water. Here and therefore, the molecular orientation and the lattice’s degrees of freedom are equally important “driving forces” of both the ferroelectric and the liquid-liquid phase transitions. Above the FK line the situations is different; there typically and Eq. (2) yields . Therefore, the lattice degrees of freedom dominate. Hence, we believe that supercooled water is ferroelectric below the FKP line.
References
- (1) C. Angell, J. Shuppert, and J. Tucker, The Journal of Physical Chemistry 77, 3092 (1973)
- (2) R. Speedy and C. Angell, The Journal of Chemical Physics 65, 851 (1976)
- (3) I. Hodge and C. Angell, The Journal of Chemical Physics 68, 1363 (1978)
- (4) O. Mishima and H. Stanley, Nature 396, 329 (1998), ISSN 0028-0836
- (5) P. Debenedetti, Journal of Physics: Condensed Matter 15, R1669 (2003)
- (6) P. Debenedetti and H. Stanley, Physics Today 56, 40 (2003)
- (7) C. Angell, Annu. Rev. Phys. Chem. 55, 559 (2004)
- (8) H. Stanley, S. Buldyrev, P. Kumar, F. Mallamace, M. Mazza, K. Stokely, L. Xu, and G. Franzese, Journal of Non-Crystalline Solids(2010)
- (9) S. Buldyrev, P. Kumar, P. Debenedetti, P. Rossky, and H. Stanley, Proceedings of the National Academy of Sciences 104, 20177 (2007)
- (10) S. Han, M. Choi, P. Kumar, and H. Stanley, Nature Physics 6, 685 (2010)
- (11) P. Kumar, S. Han, and H. Stanley, Journal of Physics: Condensed Matter 21, 504108 (2009)
- (12) S. Sastry, P. Debenedetti, F. Sciortino, and H. Stanley, Physical Review E 53, 6144 (1996)
- (13) L. Rebelo, P. Debenedetti, and S. Sastry, The Journal of chemical physics 109, 626 (1998)
- (14) P. Poole, F. Sciortino, U. Essmann, and H. Stanley, Nature 360, 324 (1992)
- (15) P. Poole, F. Sciortino, T. Grande, H. Stanley, and C. Angell, Physical review letters 73, 1632 (1994)
- (16) L. Xu, P. Kumar, S. Buldyrev, S. Chen, P. Poole, F. Sciortino, and H. Stanley, Proceedings of the National Academy of Sciences of the United States of America 102, 16558 (2005)
- (17) C. Bertrand and M. Anisimov, The Journal of Physical Chemistry B(2011)
- (18) H. Stanley, C. Angell, U. Essmann, M. Hemmati, P. Poole, and F. Sciortino, Physica A: Statistical Mechanics and its Applications 205, 122 (1994), ISSN 0378-4371
- (19) H. Tanaka, The Journal of chemical physics 105, 5099 (1996)
- (20) S. Harrington, P. Poole, F. Sciortino, and H. Stanley, Journal of Chemical Physics 107, 7443 (1997)
- (21) M. Yamada, S. Mossa, H. Stanley, and F. Sciortino, Physical review letters 88, 195701 (2002)
- (22) P. Jedlovszky and R. Vallauri, The Journal of chemical physics 122, 081101 (2005)
- (23) D. Paschek, Physical review letters 94, 217802 (2005)
- (24) D. Paschek, A. Rüppert, and A. Geiger, ChemPhysChem 9, 2737 (2008)
- (25) Y. Liu, A. Panagiotopoulos, and P. Debenedetti, The Journal of Chemical Physics 131, 104508 (2009)
- (26) J. Abascal and C. Vega, J. Chem. Phys 133, 234502 (2010)
- (27) T. Truskett, P. Debenedetti, S. Sastry, and S. Torquato, The Journal of chemical physics 111, 2647 (1999)
- (28) T. Truskett and K. Dill, The Journal of Physical Chemistry B 106, 11829 (2002)
- (29) H. Lee and R. Swendsen, Physical Review B 64, 214102 (2001)
- (30) M. Girardi, A. Balladares, V. Henriques, and M. Barbosa, The Journal of chemical physics 126, 064503 (2007)
- (31) K. Stokely, M. Mazza, H. Stanley, and G. Franzese, Proceedings of the National Academy of Sciences 107, 1301 (2010)
- (32) O. Mishima, Physical review letters 85, 334 (2000)
- (33) F. Mallamace, C. Corsaro, M. Broccio, C. Branca, N. González-Segredo, J. Spooren, S. Chen, and H. Stanley, Proceedings of the National Academy of Sciences 105, 12725 (2008)
- (34) O. Mishima et al., The Journal of chemical physics 133, 144503 (2010)
- (35) S. Chen, F. Mallamace, C. Mou, M. Broccio, C. Corsaro, A. Faraone, and L. Liu, Proceedings of the National Academy of Sciences 103, 12974 (2006)
- (36) P. Kumar, S. Buldyrev, S. Becker, P. Poole, F. Starr, and H. Stanley, Proceedings of the National Academy of Sciences 104, 9575 (2007)
- (37) P. Kumar, G. Franzese, and H. Stanley, Physical review letters 100, 105701 (2008)
- (38) P. Kumar and H. Stanley, J. Phys. Chem. A. DOI: 10.1021/jp2051867(2011)
- (39) A. Schreiber, I. Ketelsen, and G. Findenegg, Physical Chemistry Chemical Physics 3, 1185 (2001)
- (40) P. Fedichev, L. Menshikov, G. Bordonskiy, and A. Orlov, JETP Letters 94, 401 (2011), arxiv preprint arXiv:1104.1417
- (41) G. Bordonskiy and A. Orlov, Russian Journal of Condensed matter and interphase boundaries 13, 5 (2011)
- (42) J. Bernal and R. Fowler, J. chem. Phys 1, 515 (1933)
- (43) P. Fedichev and L. Menshikov, eprint arXiv: 0808.0991(2008)
- (44) P. Fedichev and L. Menshikov, Arxiv preprint cond-mat/0601129(2006)
- (45) L. Menshikov and P. Fedichev, Russian Journal of Physical Chemistry A 85, 906 (2011)
- (46) Stogrin, IEEE Trans. Microwave Theory Tech. MIT-19, 733 (1971)
- (47) H. Liebe, G. Hufford, and T. Manabe, International Journal of Infrared and Millimeter Waves 12, 659 (1991), ISSN 0195-9271
- (48) J. Hasted, D. Ritson, and C. Collie, The Journal of Chemical Physics 16, 1 (1948)
- (49) P. Poole, T. Grande, F. Sciortino, H. Stanley, and C. Angell, Computational materials science 4, 373 (1995)
- (50) E. Ponyatovskii, V. Sinitsyn, and T. Pozdnyakova, JETP Lett 60, 360 (1994)
- (51) S. Myneni, Y. Luo, L. Näslund, M. Cavalleri, L. Ojamäe, H. Ogasawara, A. Pelmenschikov, P. Wernet, P. Väterlein, C. Heske, et al., Journal of Physics: Condensed Matter 14, L213 (2002)
- (52) P. Wernet, D. Nordlund, U. Bergmann, M. Cavalleri, M. Odelius, H. Ogasawara, L. Näslund, T. Hirsch, L. Ojamäe, P. Glatzel, et al., Science 304, 995 (2004)
- (53) T. Tokushima, Y. Harada, O. Takahashi, Y. Senba, H. Ohashi, L. Pettersson, A. Nilsson, and S. Shin, Chemical Physics Letters 460, 387 (2008)
- (54) C. Huang, K. Wikfeldt, T. Tokushima, D. Nordlund, Y. Harada, U. Bergmann, M. Niebuhr, T. Weiss, Y. Horikawa, M. Leetmaa, et al., Proceedings of the National Academy of Sciences 106, 15214 (2009)
- (55) N. English and J. Tse, Physical Review Letters 106, 37801 (2011)
- (56) H. Frohlich, Theory of dielectrics: dielectric constant and dielectric loss (Clarendon press Oxford, 1949)
- (57) M. Krivoglaz and A. Smirnov, Teoriya uporyadochiv. splavov (Theory of ordering alloys) (Fizmatgiz Moscow, 1958)
- (58) E. Moore and V. Molinero, The Journal of chemical physics 132, 244504 (2010)
- (59) E. Moore and V. Molinero, Nature 479, 506 (2011), arxiv preprint arXiv:1107.1622
- (60) L. Onsager, Journal of the American Chemical Society 58, 1486 (1936)
- (61) M. Blackman and N. Lisgarten, Proceedings of the Royal Society of London. Series A. Mathematical and Physical Sciences 239, 93 (1957)
- (62) J. Finney, A. Hallbrucker, I. Kohl, A. Soper, and D. Bowron, Physical review letters 88, 225503 (2002)
- (63) S. Kawada, J. Phys. Soc. Japan. 32, 1442 (1972)
- (64) S. Jackson and R. Whitworth, The Journal of Physical Chemistry B 101, 6177 (1997), ISSN 1520-6106
- (65) S. Singer, J. Kuo, T. Hirsch, C. Knight, L. Ojamae, and M. Klein, Physical review letters 94, 135701 (2005), ISSN 1079-7114
- (66) C. Knight, S. Singer, J. Kuo, T. Hirsch, L. Ojamäe, and M. Klein, Physical Review E 73, 056113 (2006)
- (67) G. Barkema and J. De Boer, Journal of Chemical Physics 99, 2059 (1993)
- (68) F. Stillinger, Philosophical transactions of the Royal Society of London. Series B, Biological sciences 278, 97 (1977)
- (69) X. Su, L. Lianos, Y. Shen, and G. Somorjai, Physical Review Letters 80, 1533 (1998), ISSN 1079-7114
- (70) M. Iedema, M. Dresser, D. Doering, J. Rowland, W. Hess, A. Tsekouras, and J. Cowin, J. Phys. Chem. B 102, 9203 (1998)