Abrupt Change in Radiation-Width Distribution for 147Sm Neutron Resonances
Abstract
We obtained total radiation widths of s-wave resonances through -matrix analysis of 147Sm() cross-sections. Distributions of these widths differ markedly for resonances below and above eV, in stark contrast to long-established theory. We show that this change, as well as a similar change in the neutron-width distribution reported previously, are reflected in abrupt increases in both the average 147Sm() cross section and fluctuations about the average near 300 eV. Such effects could have important consequences for applications such as nuclear astrophysics and nuclear criticality safety.
pacs:
24.30.Gd, 24.60.Dr, 24.60.Lz, 25.40.LwIn this letter, we show that total-radiation-widths () extracted from -matrix analysis of 147Sm() cross sections reveal an abrupt change in the shape and average value of the distribution near eV. These observations are in stark contrast with theoretical expectations that both quantities should remain essentially constant across the resonance range and beyond.
The effect reported herein occurs very near the same energy as previously reported abrupt changes in the -particle strength-function ratio Ko2004 for the two s-wave spin states and the shape of the reduced-neutron-width () distribution Ko2007 . Due to the difficulty of measuring the very small widths, the former effect was of limited statistical significance. However, the effect in the data was established at about the 99% confidence level using several different tests. These two previous effects remain unexplained.
As we will show below, changes in the distribution shape and average are established with very high confidence. That three such deviations from theoretical expectations could occur by chance in the same nuclide at the same energy must be vanishingly small. Therefore, it is virtually certain that significant departure from standard theory has been observed and that all three effects may have a common origin. Given the relative paucity of high-quality data, similar effects may exist for other nuclides and, if so, could have far-reaching consequences for both basic and applied nuclear physics. For example, as we show below, these changes in the and distributions are reflected in abrupt increases in both the average 147Sm() cross section and fluctuations about the average that cannot be explained by the nuclear statistical model. As this theory is used to calculate cross sections for applications, similar differences in other nuclides could have important impacts in nuclear astrophysics and nuclear criticality safety.
It is expected that distributions for medium to heavy nuclides should be very narrow, and essentially constant across the resonance energy region. Expectation Po56 that the distribution should be very narrow arises from i) the very complex wave functions of states at high excitation characteristic of neutron thresholds and ii) the very large number of channels for decay. Condition i) results in partial -decay widths for each channel following a Porter-Thomas distribution (PTD) Po56 (a distribution with one degree of freedom, ). Condition ii) results in the expectation that total -decay widths will follow a distribution with degrees of freedom given by the number of independently-contributing channels . As , distributions can indeed be very narrow.
That the distribution should remain fairly constant arises from consideration of the physics of radiative transitions in nuclei as implemented in the nuclear statistical model, which should apply for nuclides in this mass range at these excitation energies. Partial radiation widths for transitions from resonances to individual final levels are characterized by average values
| (1) |
where is the -ray energy, is the density of resonances with spin and parity at energy , and is the photon strength function (PSF) for transitions of type (electric or magnetic) and multipolarity . As the resonance-energy range is rather small and all quantities are smooth functions of energy, no abrupt changes are expected.
Resonance values typically have been determined only for a relatively small subset of observed resonances, and quite often have fairly large uncertainties. On the other hand, data may, in principle, be a more sensitive tool for testing theory than data, for at least two reasons. First, because distributions are much narrower than (which are predicted to follow the PTD, ), it is much easier to detect a change in distribution shape in the former case with a limited amount of data. Second, systematic effects due to missed resonances should be negligible, or at least much smaller, for compared to data. It is a well-known fact that all experiments miss some resonances having small neutron widths, and it is well established that neglecting this effect can cause significant systematic errors in discerning the shape of the distribution from the data. Because the range of values is much smaller, and because they are, in general, uncorrelated with (we have verified this for the data used herein), missed resonances should have random values, and hence no correction for missed resonances is needed while determining the shape of the distribution from the data.
All resonances should have the same parity to perform a valid test of the theory. 147Sm is ideal in this regard because it is at the peak of the s- and minimum of the p-wave neutron strength functions, so all observed resonances at the low energies used in our analysis should be s wave. The probability of a p-wave resonance being included in our analyses can be estimated from the average resonance parameters in Ref. Mu2006 (p-wave neutron strength function and s-wave average resonance spacing eV), the usual assumption that the p-wave average resonance spacing , and the threshold used in our analysis (see below). From these values, it is easy to show that the probability of a p-wave resonance being included in our analyses is extremely low, being less than .
Extracting values from measured cross sections also requires knowing the resonance spins. For 147Sm (), two s-wave spins are possible, and . We overcame this potential problem by making the measurements with the Detector for Advanced Neutron Capture Experiments (DANCE) He2001 , with which we were able to determine firm spin assignments for all resonances used herein.
Details of the experiment have been reported elsewhere Ko2007 . DANCE is a -ray detector comprised of 160 BaF2 scintillators, each coupled to its own photomultiplier tube, the outputs of which were inputted to two transient digitizers each. In this way, waveforms for each detector were recorded for each neutron beam pulse and analyzed in real time to detect peaks, whose shape and time stamp were written to disk. A 10.4-mg metallic sample, enriched to 97.93% in 147Sm and mounted on a thin Al backing, was placed in the center of DANCE. A well collimated neutron beam from a water moderator at the Manuel Lujan, Jr. Neutron Scattering Center at the Los Alamos Neutron Science Center was incident on this target.
Neutron energies were determined using the time-of-flight technique during replay of the data. Cuts were applied to reduce backgrounds and restrict events to those in the range expected from 147Sm() reactions. Separate measurements were made with a blank Al backing foil. Neutron flux was redundantly measured using three different sample/detector combinations. Flux-normalized sample-out counts were subtracted from the sample-in data. Resulting neutron-capture cross sections in the unresolved region are in agreement with the most recent high-accuracy data Wi93 to within the uncertainties.
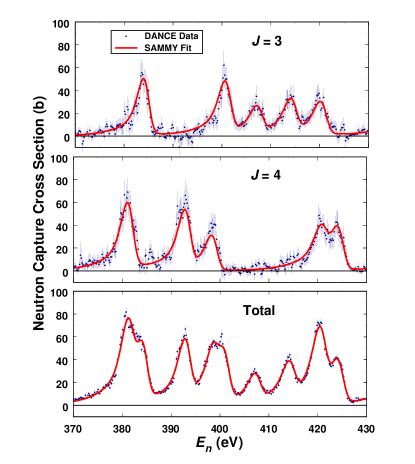
As explained in Ref. Ko2007 , -ray multiplicity (the number of -rays emitted following neutron capture) information measured with DANCE makes this detector an excellent resonance ”spin meter”. The technique invented in Ref. Ko2007 was further developed in Ref. Be2011 . We used the least-squares version in the latter reference to determine spin-separated yields as functions of neutron energy for the two s-wave spins. Spins of all resonances analyzed herein could be determined from these yields by inspection. We also used these yields to calculate spin-separated neutron-capture cross sections , e.g., . Example cross sections are shown in Fig. 1. The spin-separated cross sections were crucial for obtaining values for resonances which were not fully resolved in the DANCE data.
The -matrix code SAMMY La2008 was used to fit the 147Sm() cross-section data and obtain resonance parameters. Because natural widths () of the resonances were almost always smaller than the sum of the experiment resolution plus Doppler broadening, fitting the capture data alone yields capture kernels,
| (2) |
(where is the statistical factor for resonance, target, and neutron spins , , and , respectively) and not the individual widths. However, neutron widths are available from resonance analysis of total cross section data. Therefore, values were determined by fitting our data using the values from Ref. Mi81 .
There are two components to the total uncertainty for each value. First, there is the contribution due to fitting the data, which was calculated by SAMMY. Second, there is a contribution due to the uncertainty in the neutron width, which was derived in the standard manner using Eq. 2 and the values from Ref. Mi81 . These two components were added in quadrature to obtain total uncertainties. As can be seen from Eq. 2, if is significantly larger than , then the capture kernel is relatively insensitive to and the resulting is essentially that calculated by SAMMY. However, as decreases, increases. In the limit , the capture kernel is essentially equal to , and hence cannot be determined. Therefore, some limit has to be imposed on the subsequent analysis. Experience has shown to be reasonable, and hence we limited the subsequent analyses to such resonances. We have repeated the analyses described below using other reasonable limits (e.g., , 5%) and obtained essentially the same results.
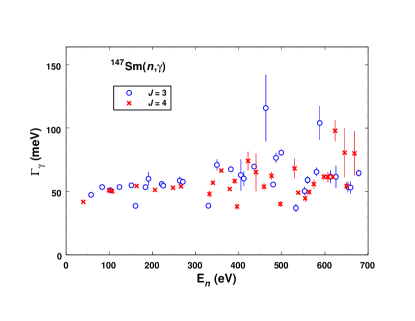
The values for the 62 (out of 112 observed) resonances below 700 eV meeting the above criteria are shown as a function of resonance energy in Fig. 2. As can be seen in this figure, there is no discernible difference in values for the two s-wave spins, and the distribution becomes noticably broader for 300 eV. Therefore, we combined data for the two spins in subsequent analyses, and divided the data into two groups; eV and eV.
Cumulative distributions for the two energy regions are shown in Fig. 3. We performed several tests Co80 to discern the statistical significance of the change in distribution shape which is evident in this figure.
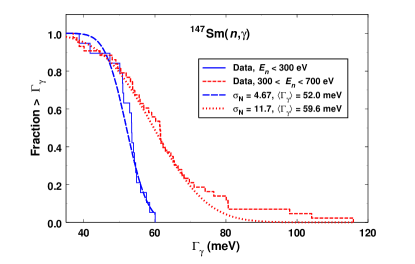
The median (variance) test indicates the null hypothesis that medians (variances) of the two distributions are the same can be rejected at the 99.8% (99.9%) confidence level. Similarly, the Smirnov and Cramer-von Mises two-sample tests reveal the null hypothesis that data in the two energy regions were sampled from the same population can be rejected with and confidence, respectively. In essence, all these statistical tests indicate that the change in the distribution evident in Fig. 3 is highly statistically significant.
Theoretical interpretation of this change may be aided by estimation of distribution parameters for the two regions. To this end, we used the maximum likelihood (ML) method. As noted above, data are expected to follow a distribution with many degrees of freedom, . For such large values of , a distribution is very close to Gaussian in shape. One advantage of using a Gaussian rather than distribution for the analysis is that uncertainties can easily be included As66 .
Therefore, we used the technique described in Ref. As66 to estimate most likely values for the means and standard deviations of the distributions in the two energy regions. Resulting ML estimates are , , and , , for the lower- and upper-energy regions, respectively. Hence, the ML results also indicate that distributions in the two energy regions are significantly different. Translated to distributions, these ML results lead to and for the distributions in the lower and upper energy regions, respectively.
Because our dividing energy is slightly different than that used in Ref. Ko2007 , our new values for smaller resonances are slightly different, and the ML technique of Ref. Ko2010a is better than that used in Ref. Ko2007 , we reanalyzed the data using the technique of Ref. Ko2010a to obtain values for the two energy regions. As explained in the Ref. Ko2010a , the ML analysis technique employs an energy dependent threshold to properly account for the effect of missed small resonances. The results given in Table 1 were obtained with a threshold , where is given in meV for in eV. As explained in the Ref. Ko2010a , this same threshold excludes p-wave resonances from the analysis with equal effectiveness at all energies. We then applied the technique of Ref. Fu65 (using the same threshold, and modified to work for any ) to obtain average s-wave resonance spacings and neutron strength functions , corrected for missed small resonances. These values, along with parameters for the distributions, are given in Table 1. Our resulting values are consistent with those of Ref. Ko2007 and so confirm that the distribution also changes shape near 300 eV.
| Region (eV) | (meV) | (eV) | |||
|---|---|---|---|---|---|
| 0 - 300 | |||||
| 300 - 700 |
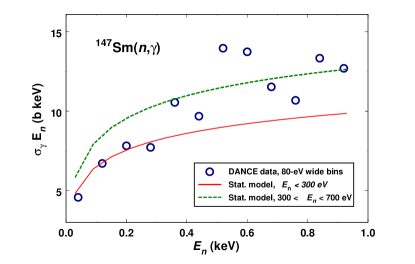
That these changes in the and and distributions are mirrored in the 147Sm() cross section is shown in Fig. 4, in which our DANCE data averaged over 80-eV-wide bins are shown. The bin width must be wide enough to contain several resonances so that the large fluctuations in resonance sizes are damped, but not so large that the change near 300 eV is averaged out. As the average resonance spacing is about 6 eV, the chosen bins should contain about 13 resonances on average, which should be a good compromise. For comparison, the typical rule of thumb for statistical model calculations is that the energy interval contain at least 10 resonances.
Also shown in Fig. 4 are two statistical model calculations based on the average resonance parameters given in Table 1 for the two energy regions. As all statistical model codes of which we are aware assume the PTD for , and essentially a single, constant , we wrote our own simple code which randomly samples over distributions with parameters given in Table 1. As can be seen in Fig. 4, there is a substantial, fairly abrupt, change in the measured cross section near 300 eV, and calculations based on the parameters for each region are in good agreement with the data in that region, but inconsistent with data in the other region. It also is evident that fluctuations in the data about the theoretical value are larger in the upper-energy region, which is consistent with the interpretation Ko2004 ; Ko2007 of a non-statistical effect in this region. The cross section in the upper-energy region is approximately 30% larger than calculated using parameters for the lower-energy region. Our calculations indicate that about one third of this increase is due to the changes in the distribution, and the remaining two thirds is mainly due to width-fluctuation effects in the neutron channel.
To our knowledge, there is no model which can explain the two previously reported or the current effects in 147Sm+ widths near 300 eV. The above results could be interpreted as a decrease in the number of effectively independent channels by 190, or a decrease in the degrees of freedom for each channel by approximately a factor of 1/5, between the two energy regions. Given the extremely limited data available, the paucity of high-quality data, and the near universal practice of assuming follow the PTD, similar effects could exist in other nuclides. In addition to interest in understanding the underlying theory, such effects may be important to, for example, nuclear astrophysics and nuclear criticality safety, in which models often are used to calculate important quantities beyond the reach of measurement. Because our results do not agree with predictions and assumptions of these models, it is prudent to assume that quantities predicted by these models may be more uncertain than previously thought. Similar quality data on other nuclides likely will be needed before the origin and extent of the effects presented herein can be understood.
Acknowledgements.
The authors would like to thank R. R. Winters for useful discussions. This work was supported by the Office of Nuclear Physics of the U.S. Department of Energy under Contract No. DE-AC05-00OR22725 with UT-Battelle, LLC. This work has benefited from the use of the LANSCE facility at Los Alamos National Laboratory which was funded by the U.S. Department of Energy and operated by the University of California under Contract W-7405-ENG-36.References
- (1) P. E. Koehler, Y. M. Gledenov, T. Rauscher, and C. Frōhlich, Phys. Rev. C 69, 015803 (2004).
- (2) P. E. Koehler, J. L. Ullmann, T. A. Bredeweg, J. M. O’Donnell, R. Reifarth, R. S. Rundberg, D. J. Vieira, and J. M. Wouters, Phys. Rev. C 76, 025804 (2007).
- (3) C. E. Porter and R. G. Thomas, Phys. Rev. 104, 483 (1956).
- (4) S. F. Mughabghab, Atlas of Neutron Resonances: Resonance Parameters and Thermal Cross Sections Z=1-100 (Elsevier, Amsterdam, The Netherlands, 2006).
- (5) M. Heil, R. Reifarth, M. M. Fowler, R. C. Haight, F. Kāppeler, R. S. Rundberg, E. H. Seabury, J. L. Ullmann, J. B. Wilhelmy, and K. Wisshak, Nucl. Instrum. Methods Phys. Res. A 459, 229 (2001).
- (6) K. Wisshak, K. Guber, F. Voss, F. Kappeler, and G. Reffo, Phys. Rev. C 48, 1401 (1993).
- (7) F. Bečvář, P. E. Koehler, M. Krtička, G. E. Mitchell, and J. L. Ullmann, Nucl. Instrum. Methods Phs. Res. A 647, 73 (2011).
- (8) N. M. Larson, Technical Report No. ORNL/TM-9179/R8, Oak Ridge National Laboratory (unpublished).
- (9) M. Mizumoto, Nucl. Phys. A357, 90 (1981).
- (10) W. J. Conover, Practical Nonparametric Statistics (John Wiley and Sons, New York, 1980).
- (11) M. Asghar, C. M. Chaffey, M. C. Moxon, N. J. Pattenden, E. R. Rae, and C. A. Uttley, Nucl. Phys. 76, 196 (1966).
- (12) P. E. Koehler, F. Becvár, M. Krticka, J. A. Harvey, and K. H. Guber, Phys. Rev. Lett. 105, 072502 (2010).
- (13) T. Fuketa and J. A. Harvey, Nucl. Instrum. Methods 33, 107 (1965).