2M1155–79 (= T Cha B): A Low-mass, Wide-separation Companion to the Nearby, “Old” T Tauri Star T Cha
Abstract
The early-K star T Cha, a member of the relatively nearby ( pc) Cha Association, is a relatively “old” (age 7 Myr) T Tauri star that is still sporadically accreting from an orbiting disk whose inner regions are evidently now being cleared by a close, substellar companion. We report the identification, via analysis of proper motions, serendipitous X-ray imaging spectroscopy, and followup optical spectroscopy, of a new member of the Cha Association that is very likely a low-mass companion to T Cha at a projected separation of 38 kAU. The combined X-ray and optical spectroscopy data indicate that the companion, T Cha B (= 2M115579), is a weak-lined T Tauri star (wTTS) of spectral type M3 and age 10 Myr. The serendipitous X-ray (XMM-Newton) observation of T Cha B, which targeted T Cha, also yields serendipitous detections of two background wTTS in the Chamaeleon cloud complex, including one newly discovered, low-mass member of the Cha cloud pre-MS population. T Cha becomes the third prominent example of a nearby, “old” yet still actively accreting, K-type pre-MS star/disk system (the others being TW Hya and V4046 Sgr) to feature a low-mass companion at very large (12–40 kAU) separation, suggesting that such wide-separation companions may affect the conditions and timescales for planet formation around solar-mass stars.
1 Introduction
The majority of stars likely form in binary systems (e.g., Mathieu, 1994; Tohline, 2002). Given the recent, rapid improvement in our knowledge of the demographics of nearby ( pc), young (age –30 Myr) stellar groups (e.g., Torres et al., 2008; Zuckerman et al., 2011, and references therein), we now have the opportunity to study, at close range, the composition and, perhaps, dissolution of such pre-main sequence (pre-MS) binaries during or just after the epoch of planet formation. Indeed, initial studies of nearby, young binaries make apparent that binary star interactions could have profound consequences on planet-forming circumstellar environments (e.g., Prato et al., 2001; Andrews et al., 2010; Kastner et al., 2011).
The Cha Association member T Cha (spectral type K0, pc, age Myr; Torres et al., 2008) is a rare example of a nearby pre-MS star that displays evidence for ongoing accretion (other prominent examples are TW Hya, V4046 Sgr, and MP Mus; Torres et al., 2008). The accretion rate of T Cha is evidently highly variable (and is often undetectably small; Torres et al., 2008; Schisano et al., 2009). Like TW Hya and V4046 Sgr, T Cha is a prototypical example of a “transition disk” object, i.e., a low-mass, pre-MS star orbited by a relatively massive, dusty disk with a large (AU to tens of AU scale) inner hole or gap. Such disk structure is possibly indicative of the presence of young, massive planets (e.g., Dodson-Robinson & Salyk, 2011). Indeed, Huélamo et al. (2011) recently obtained direct evidence (via aperture-masked adaptive optics imaging) for a substellar object orbiting within the inner gap of the T Cha disk.
Following the identification of apparent companions to HR 4796 and V4046 Sgr at projected separations of 13.5 and 12.4 kAU, respectively (Kastner et al., 2008, 2011), we are searching for distant companions associated with other pre-MS stars within pc of Earth, particularly nearby pre-MS stars that are still orbited by and accreting from gaseous, circumstellar disks. In this paper, we report the identification, via analysis of catalogued proper motions, serendipitous X-ray imaging spectroscopy, and followup optical spectroscopy, of a new, M-type member of the Cha Association that is most likely a distant (projected separation kAU) companion to T Cha.
2 Data and Results
2.1 Proper motions of red 2MASS stars near T Cha
To search for candidate comoving, wide-separation companions to T Cha, we made use of the VizieR111http://vizier.u-strasbg.fr/viz-bin/VizieR table browsing and source matching utilities available in TOPCAT222Tool for OPerations on Catalogues And Tables; http://www.star.bris.ac.uk/ mbt/topcat/. We first compiled a list of all 2MASS333The Two Micron All Sky Survey is a joint project of the University of Massachusetts and the Infrared Processing and Analysis Center/California Institute of Technology and is funded by NASA and the National Science Foundation. sources within of T Cha that have magnitudes and colors within the range expected for low-mass (late K or M-type) stars within pc, i.e., and . We then used the UCAC3 (Zacharias et al., 2010) proper motion catalog to select the subset of these 2MASS sources whose measured proper motions (PMs) lie within 15 mas yr-1 of each of the PM components of T Cha. This resulted in a list of 6 comoving companion candidates to T Cha. Of these candidates, the closest PM match to T Cha is 2MASS 115504857919108 (hereafter 2M115579); its UCAC3 PM is indistinguishable from that of T Cha, given the respective measurement uncertainties (Table 1). With an angular separation of 6.36′, this candidate is also the closest in proximity to T Cha. The other five objects with PMs similar to T Cha (and 2M115579) all have RA PM components mas yr-1; these are most likely field stars unrelated to either the Cha Association or the background Chamaeleon cloud T Tauri star population (given that three of the five are undetected in X-rays; see §2.2 and Terranegra et al., 1999).
2.2 XMM-Newton archival data
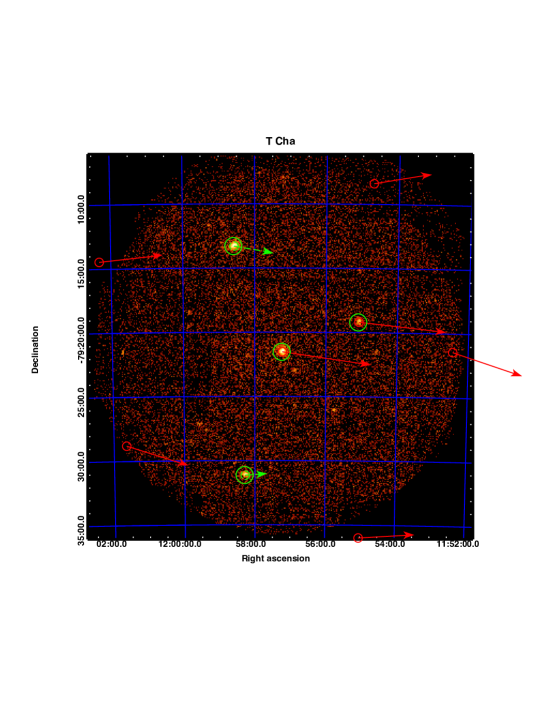
Low-mass pre-MS stars are luminous X-ray sources, with typical X-ray luminosities (relative to bolometric) in the range 10-4–10-3 (e.g., Kastner et al., 1997). Hence, to confirm that 2M1155–79 is young, we examined an XMM-Newton observation, obtained obtained on 16 March 2009 UT, that targeted (and detected) T Cha (Güdel et al., 2010). The observation duration was 11.5 ks; the effective exposure times with the European Photon Imaging Camera (EPIC) pn, MOS1, and MOS2 detectors were 3.3, 10.6, and 10.2 ks, respectively (the useful pn exposure time being limited due to intervals of high background). The merged XMM/EPIC 0.5–2.0 keV image is displayed in Fig. 1, overlaid with the positions and PM vectors of T Cha and the half-dozen bright, red 2MASS stars that have similar UCAC3 PMs (selected as described in §2.1). Of these 7 stars with similar PMs, only T Cha and 2M115579 are detected as X-ray sources (note, however, that two of these PM-selected stars do not fall within the XMM field of view).
The two other luminous X-ray sources in the field, which have UCAC3 catalog proper motions that are less than half those of T Cha and 2M115579, correspond to 2MASS 115834297913175 (= RXJ 1158.57913; hereafter RXJ1158.5) and 2MASS 115816467931082 (hereafter 2M115879). The former is a weak-line T Tauri star (wTTS) of spectral type K3, previously identified by Alcala et al. (1995) as being associated with the Chamaeleon cloud complex. The Cha clouds and their associated TTS population lie 160 pc from Earth (Whittet et al., 1997) — i.e., pc behind the Cha Association — consistent with the small PM of RXJ1158.5 relative to Cha member T Cha (Terranegra et al., 1999). Meanwhile, 2M115879 has no previous references listed in SIMBAD444The SIMBAD database (http://simbad.u-strasbg.fr/simbad/) is operated at CDS, Strasbourg, France.. Given its JHK magnitudes and colors relative to those of RXJ1158.5 (Table 1), and the similarity of their PMs, 2M115879 is therefore most likely a previously unidentified, lower-mass (early M) member of the Cha cloud wTTS population. Proper motions are unavailable for potential optical counterparts to the other, weaker X-ray sources in Fig. 1.
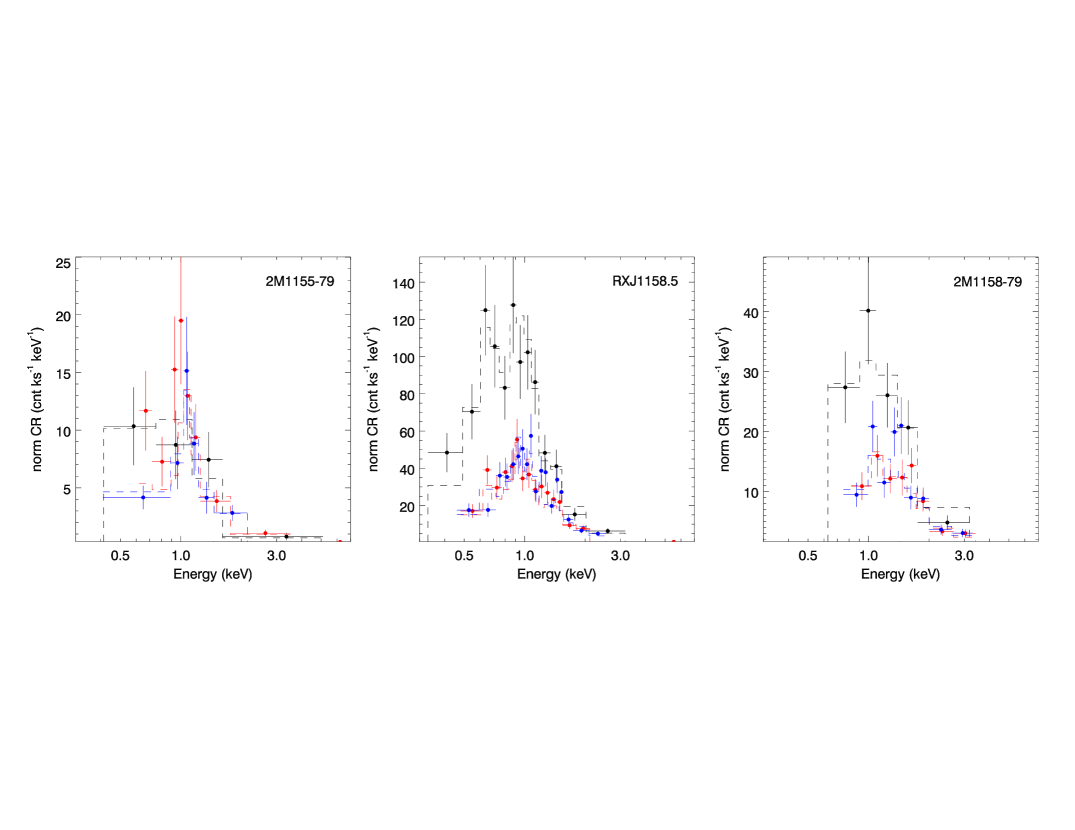
We used the XMM Scientific Analysis System (SAS555http://xmm.esa.int/sas version 10.0.0) to extract pn, MOS1, and MOS2 CCD spectra and responses for the three bright sources that surround T Cha in the EPIC image (spectral fitting results for T Cha itself were presented in Güdel et al., 2010). Calibrations were performed using the current calibration files (CCF) from release note 271, 21-Dec-2010. Background-subtracted total counts and count rates for each source, as obtained from the pn, MOS1, and MOS2 spectral extractions, are listed in Table 1 (the anomalously low pn count rate of 2M1155–79 is the result of its position on a bad row of that detector). We summarize the results of simultaneous fits of an absorbed single-component thermal plasma emission model to the three (pn, MOS1, MOS2) EPIC spectra of 2M115579 and 2M115879 and an absorbed two-component plasma model to the EPIC spectra of RXJ1158.5 in Table 1, and we display the spectra overlaid with these best-fit models in Fig. 2 (a second, lower-temperature component is necessary to model the low-energy regions of the EPIC spectra of RXJ1158.5). The X-ray properties of 2M1155–79 inferred from spectral fitting are similar to those of the background (Cha cloud) wTTS RXJ1158.5 (and are typical of wTTS more generally), consistent with a wTTS classification for 2M1155–79 (§3.2). The best-fit model for 2M115879 (whose EPIC spectra are evidently somewhat harder than those of 2M1155–79 and RXJ1158.5; Fig. 2) indicates a high plasma temperature and very large ratio, suggesting it may have been undergoing a strong flare during the short exposure targeting T Cha.
2.3 Optical spectroscopy of T Cha and 2M1155–79
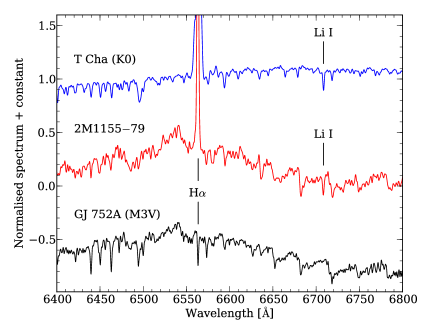
Spectra of T Cha and 2M1155–79 covering the H and Li i spectral region at resolution 7000 were obtained with the Australian National University’s Siding Spring Observatory (SSO) 2.3 m telescope and WiFeS spectrometer (Dopita et al., 2007) on 12 Oct. 2011 (Fig. 3). Exposure times were 2600 s and 300 s for 2M1155–79 and T Cha, respectively, and the stars were observed at airmass 2.5. Spectra were reduced as described in Riedel et al. (2011); absolute flux calibration was not performed. In the resulting, normalized spectra, both stars display H strongly in emission and show strong Li absorption lines (H and Li line equivalent widths are reported in Table 1). The photospheric absorption features in the spectrum of 2M1155–79 are evidently a close match to those of the M3 field dwarf GJ 752A = HD 180617 (Henry et al., 1994); see Fig. 3 (left). Hence, we adopt M3 as the spectral type of 2M1155–79 for purposes of the discussion in §3.
3 Discussion
3.1 2M1155–79 (= T Cha B): a likely wide-separation companion to T Cha
Li is rapidly depleted in low-mass pre-MS stars, the photospheric absorption line becoming difficult to detect in nearby, young mid-M stars (even in high-resolution spectra) by the time such stars are of age Myr (Yee & Jensen, 2010). Hence, the detection of Li absorption in the SSO WiFeS spectrum of 2M1155–79 (§2.3), combined with its strong X-ray emission (§2.2) and H emission (§2.2), confirm that this star is young. More specifically, the large 6708 Li i EW we measure in the spectrum of 2M1155–79 is comparable to those of mid-M stars in the 8 Myr-old TW Hya Association (Rodriguez et al., 2011) and the 7 Myr-old Cha group (even though 2M1155–79 is among the lowest-mass Cha members known; Torres et al., 2008). In contrast, its Li absorption line EW is a factor at least 3 larger than those of M stars (of all spectral subtype) in the 12 Myr-old Pic Moving Group (Yee & Jensen, 2010). Hence its Li absorption line strength alone places an upper limit of 10 Myr on the age of 2M1155–79.
Adopting the data and methods in Kenyon & Hartmann (1995), the 2MASS magnitudes and M3 spectral type of 2M115579 suggest an effective temperature of 3400100 K (where the error corresponds to an uncertainty of one spectral subclass) and — assuming 2M1155–79, like T Cha, lies at pc (Torres et al., 2008) but, unlike T Cha, suffers negligible reddening (given its low ; see below) — a bolometric luminosity . The pre-MS evolutionary tracks of Siess et al. (2000), which are appropriate given the age and mass range of interest here (e.g., Lawson & Feigelson, 2001), then indicate an age 10 Myr and mass just under 0.3 (Fig 4). The former is consistent with the upper limit on the age of 2M1155–79 imposed by its strong Li absorption. In light of their similar proper motions (§2.1; see also Terranegra et al., 1999) and the fact that (adopting pc) the two stars fall near the same (age 10 Myr) theoretical isochone in Fig 4 — an isochrone that is, in turn, very similar to the estimated (7 Myr) age of the Cha group with which T Cha is kinematically associated (Torres et al., 2008, and references therein) — it appears that T Cha and 2M1155–79 are equidistant, coeval, and comoving. The latter star is therefore most likely a newly identified member of the Cha Association.
Furthermore, given the low surface density of known members of the Cha group ( degree-2; Torres et al., 2008), the Poisson probability that T Cha and 2M1155–79 represent a chance alignment of two (otherwise unrelated) Cha Association stars within the ( degree2) XMM/EPIC field is vanishingly small (). We therefore assert that these two stars very likely comprise a very wide (projected separation 38 kAU) binary system; hence, hereafter, we refer to 2M1155–79 as T Cha B.
3.2 The contrasting natures of T Cha A and B
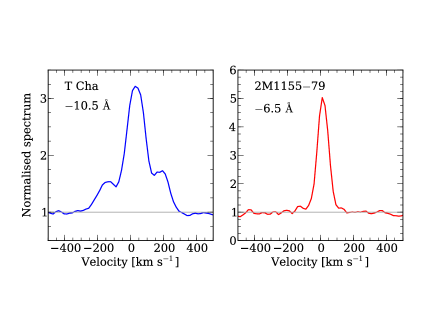
The H emission line strength of T Cha displayed in our spectrum (Table 1 and Fig. 3, center) lies near the middle of the (wide) range previously measured for this star, and is only marginally consistent with “classical” (as opposed to weak-lined) T Tauri star status (the T Cha H line has also occasionally been observed in absorption; Torres et al., 2008; Schisano et al., 2009). The H linewidth at 10% of peak intensity at the time of our observations, 475 km s-1, would place T Cha among the weakly accreting T Tauri stars — with an inferred accretion rate of yr-1 — given the empirical relationship between and described in Natta et al. (2004).
In contrast, we measure 149 km s-1 for T Cha B (Fig. 3, right), suggesting yr-1 — consistent with the wTTS classification for this star one would determine from its H emission-line EW (Table 1; e.g., Barrado y Navascués & Martín, 2003). Furthermore, whereas T Cha A displays a strong mid- to far-infrared excess in 2MASS and Wide-field Infrared Survey Explorer666The Wide-field Infrared Survey Explorer is a joint project of the University of California, Los Angeles, and the Jet Propulsion Laboratory/California Institute of Technology, and is funded by NASA. (WISE) data (e.g., , compared with for the wTTS RXJ1158.5; Table 1) and is evidently subject to varying degrees of obscuration by its dusty circumstellar disk (Schisano et al., 2009), T Cha B displays only a modest mid-infrared excess () — although the star evidently has a substantial 20 m flux excess (as does the background wTTS 2M1158–79; Table 1), suggesting a significant mass of cool circumstellar dust. The presence of disk gas around T Cha A — and the apparent absence of such intervening disk gas, along the line of sight to T Cha B — is also evident in the large contrast between their respective X-ray absorbing columns (Table 1).
4 Conclusions
T Cha is the third prominent example of a nearby ( pc, “old” (age 10 Myr) yet still actively accreting, K-type pre-MS star/disk system (the others being TW Hya and V4046 Sgr) that is now known to feature candidate low-mass companions at very large (12–40 kAU) separation. The projected separation of the apparent T Cha A/B pair, 38 kAU, is very similar to that of the TW Hya Association (TWA) brown dwarf candidate TWA 28 from TW Hya itself (41 kAU; Teixeira et al., 2008), and is much larger than the projected separation of V4046 Sgr AB and C[D] (12.4 kAU; Kastner et al., 2011). Other examples of nearby, 10 Myr-old binary systems with components at wide (3–13 kAU) separation that feature dusty circumstellar disks are TWA members HR 4796 (TWA 11; Kastner et al., 2008) and TWA 30 (whose two components also display evidence for ongoing accretion; Looper et al., 2010). The projected separations of four of these systems (T Cha A and B; TW Hya and TWA 28; V4046 Sgr AB and C[D]; and HR 4796 AB and C) rival or exceed those of the widest known main-sequence binaries in the solar neighborhood (20 kAU; Close et al., 1990). It may be that we are observing these young binary systems at a “fragile” stage of their evolution, during which they are particularly susceptible to dissolution (e.g., via encounters with the older field star population). Indeed, the large separation of T Cha A and B implies an orbital period Myr, similar to the age of the system itself. High resolution spectroscopy and precise proper motion determinations — capable of establishing the relative space motion of the two stars to within kms-1 — are required to ascertain whether they are in fact gravitationally bound.
Furthermore, depending on the nature of the substellar companion orbiting within the inner hole of the T Cha disk (Huélamo et al., 2011), T Cha — like Pic Moving Group member V4046 Sgr and TWA members HD 98800, Hen 3–600, and HR 4796 — might be considered a hierarchical binary system with long-lived disk. The presence of wide-separation companions could be pointing to the profound effects of companion-disk interactions, and perhaps hierarchical binary dissolution, on the conditions and timescales for planet formation in such systems (Kastner et al., 2011, and references therein). In particular, given the advanced ages of these five disk-retaining hierarchical binaries, one might speculate that, in each case, the presence of a companion(s) has either inhibited planet formation processes (see also Prato et al., 2001) or extended the time available for such processes well beyond the “nominal” few Myr typically inferred for disk lifetimes (e.g., Currie et al., 2009, and references therein).
References
- Alcala et al. (1995) Alcala, J. M., Krautter, J., Schmitt, J. H. M. M., Covino, E., Wichmann, R., & Mundt, R. 1995, A&AS, 114, 109
- Andrews et al. (2010) Andrews, S. M., Czekala, I., Wilner, D. J., Espaillat, C., Dullemond, C. P., & Hughes, A. M. 2010, ApJ, 710, 462
- Barrado y Navascués & Martín (2003) Barrado y Navascués, D., & Martín, E. L. 2003, AJ, 126, 2997
- Close et al. (1990) Close, L. M., Richer, H. B., & Crabtree, D. R. 1990, AJ, 100, 1968
- Currie et al. (2009) Currie, T., Lada, C. J., Plavchan, P., Robitaille, T. P., Irwin, J., & Kenyon, S. J. 2009, ApJ, 698, 1
- Dodson-Robinson & Salyk (2011) Dodson-Robinson, S. E., & Salyk, C. 2011, ApJ, 738, 131
- Dopita et al. (2007) Dopita, M., Hart, J., McGregor, P., Oates, P., Bloxham, G., & Jones, D. 2007, Ap&SS, 310, 255
- Güdel et al. (2010) Güdel, M., et al. 2010, A&A, 519, A113
- Henry et al. (1994) Henry, T. J., Kirkpatrick, J. D., & Simons, D. A. 1994, AJ, 108, 1437
- Huélamo et al. (2011) Huélamo, N., Lacour, S., Tuthill, P., Ireland, M., Kraus, A., & Chauvin, G. 2011, A&A, 528, L7
- Kastner et al. (2008) Kastner, J. H., Zuckerman, B., & Bessell, M. 2008, A&A, 491, 829
- Kastner et al. (1997) Kastner, J. H., Zuckerman, B., Weintraub, D. A., & Forveille, T. 1997, Science, 277, 67
- Kastner et al. (2011) Kastner, J. H., et al. 2011, ApJ, 740, L17
- Kenyon & Hartmann (1995) Kenyon, S. J., & Hartmann, L. 1995, ApJS, 101, 117
- Lawson & Feigelson (2001) Lawson, W., & Feigelson, E. D. 2001, in Astronomical Society of the Pacific Conference Series, Vol. 243, From Darkness to Light: Origin and Evolution of Young Stellar Clusters, ed. T. Montmerle & P. André, 591
- Looper et al. (2010) Looper, D. L., Bochanski, J. J., Burgasser, A. J., Mohanty, S., Mamajek, E. E., Faherty, J. K., West, A. A., & Pitts, M. A. 2010, AJ, 140, 1486
- Mathieu (1994) Mathieu, R. D. 1994, ARA&A, 32, 465
- Natta et al. (2004) Natta, A., Testi, L., Muzerolle, J., Randich, S., Comerón, F., & Persi, P. 2004, A&A, 424, 603
- Prato et al. (2001) Prato, L., et al. 2001, ApJ, 549, 590
- Riedel et al. (2011) Riedel, A. R., Murphy, S. J., Henry, T. J., Melis, C., Jao, W.-C., & Subasavage, J. P. 2011, AJ, 142, 104
- Rodriguez et al. (2011) Rodriguez, D. R., Bessell, M. S., Zuckerman, B., & Kastner, J. H. 2011, ApJ, 727, 62
- Schisano et al. (2009) Schisano, E., Covino, E., Alcalá, J. M., Esposito, M., Gandolfi, D., & Guenther, E. W. 2009, A&A, 501, 1013
- Siess et al. (2000) Siess, L., Dufour, E., & Forestini, M. 2000, A&A, 358, 593
- Teixeira et al. (2008) Teixeira, R., Ducourant, C., Chauvin, G., Krone-Martins, A., Song, I., & Zuckerman, B. 2008, A&A, 489, 825
- Terranegra et al. (1999) Terranegra, L., Morale, F., Spagna, A., Massone, G., & Lattanzi, M. G. 1999, A&A, 341, L79
- Tohline (2002) Tohline, J. E. 2002, ARA&A, 40, 349
- Torres et al. (2008) Torres, C. A. O., Quast, G. R., Melo, C. H. F., & Sterzik, M. F. 2008, Young Nearby Loose Associations, ed. Reipurth, B., 757–+
- Whittet et al. (1997) Whittet, D. C. B., Prusti, T., Franco, G. A. P., Gerakines, P. A., Kilkenny, D., Larson, K. A., & Wesselius, P. R. 1997, A&A, 327, 1194
- Yee & Jensen (2010) Yee, J. C., & Jensen, E. L. N. 2010, ApJ, 711, 303
- Zacharias et al. (2010) Zacharias, N., et al. 2010, AJ, 139, 2184
- Zuckerman et al. (2011) Zuckerman, B., Rhee, J. H., Song, I., & Bessell, M. S. 2011, ApJ, 732, 61
| T Cha | 2M1155-79 | RXJ1158.5-7913 | 2M1158–79 | |
| (mas yr-1) | (3.2) | (5.1) | (3.8) | (2.9) |
| (mas yr-1) | (1.4) | (5.6) | (1.9) | 0.7 (2.4) |
| (mag, 1.25 m) | 8.955 (0.027) | 11.216 (0.022) | 9.745 (0.024) | 12.232 (0.026) |
| (mag, 1.65 m) | 7.860 (0.046) | 10.465 (0.026) | 8.959 (0.024) | 11.544 (0.026) |
| (mag, 2.2 m) | 6.954 (0.018) | 10.079 (0.021) | 8.653 (0.019) | 11.291 (0.024) |
| (mag, 3.4 m) | 5.899 (0.047) | 9.894 (0.024) | 8.497 (0.024) | 11.144 (0.025) |
| (mag, 4.6 m) | 4.974 (0.030) | 9.667 (0.021) | 8.384 (0.021) | 11.153(0.022) |
| (mag, 12 m) | 4.631 (0.017) | 9.273 (0.033) | 8.188 (0.024) | 10.974 (0.092) |
| (mag, 22 m) | 2.601 (0.017) | 7.195 (0.081) | 7.864 (0.132) | 8.683 (0.239) |
| EW, H (Å) | (0.4) | (0.5) | … | |
| EW, Li (mÅ) | 350 (50) | 550 (100) | 600b | … |
| EPIC Countsc | 432, 660, 687 | 48, 148, 122 | 363, 441, 513 | 150, 276, 303 |
| Count Ratec (cnt ks-1) | 132, 63, 61 | 13, 13, 9.3 | 110, 41, 45 | 43, 24, 25 |
| ( cm-2) | 9.7d | 0.16 (0–0.79) | 0.47 (0.30–0.68) | 1.5 (0.6–2.4) |
| (keV) | … | 2.1 (1.7–2.8) | 0.65 (0.60–0.74), 2.3 (2.1–2.7) | 4.7 (3.4–7.6) |
| e (erg cm-2 s-1) | d | |||
| : |
NOTES:
a) Obtained via the observations and analysis
described in text (§§2, 3) unless otherwise indicated.
b) EW data from Alcala et al. (1995).
c) pn, MOS1, and MOS2 total counts and net (background-subtracted)
count rates.
d) Based on X-ray spectral fit results listed in Güdel et al. (2010).
e) Intrinsic (“unabsorbed”) X-ray flux.
f) Bolometric fluxes for RXJ1158.5 and 2M1158–79 were
estimated as described in §3.1 (for 2M1155–79). Both the bolometric
flux and steady-state X-ray flux of 2M1158–79 are uncertain.