Dust Attenuation and H Star Formation Rates of Galaxies
Abstract
Using deep narrow-band and broad-band imaging, we identify 401 and 249 H line-emitting galaxies in the Subaru Deep Field. Compared to other H surveys at similar redshifts, our samples are unique since they probe lower H luminosities, are augmented with multi-wavelength (rest-frame 1000Å–1.5m) coverage, and a large fraction (20%) of our samples has already been spectroscopically confirmed. Our spectra allow us to measure the Balmer decrement for nearly 60 galaxies with H detected above 5. The Balmer decrements indicate an average extinction of mag. We find that the Balmer decrement systematically increases with higher H luminosities and with larger stellar masses, in agreement with previous studies with sparser samples. We find that the SFRs estimated from modeling the spectral energy distribution (SED) is reliable—we derived an “intrinsic” H luminosity which is then reddened assuming the color excess from SED modeling. The SED-predicted H luminosity agrees with H narrow-band measurements over 3 dex (rms of 0.25 dex). We then use the SED SFRs to test different statistically-based dust corrections for H and find that adopting one magnitude of extinction is inappropriate: galaxies with lower luminosities are less reddened. We find that the luminosity-dependent dust correction of Hopkins et al. yields consistent results over 3 dex (rms of 0.3 dex). Our comparisons are only possible by assuming that stellar reddening is roughly half of nebular reddening. The strong correspondence argue that with SED modeling, we can derive reliable intrinsic SFRs even in the absence of H measurements at .
Subject headings:
galaxies: photometry — galaxies: distances and redshifts — galaxies: evolution — galaxies: high-redshift — dust, extinction1. INTRODUCTION
Dust extinction is the largest source of uncertainty in currently used measurements of the properties of galaxies at substantial redshifts. Reddening strongly effects the blue/UV continuum of galaxies upon which most star formation rates (SFRs) are estimated (Colbert et al., 2006; Ly et al., 2009; Goto et al., 2010). Its effects are important across a wide range of redshifts spanning much of cosmic time (Hicks et al., 2002; Shim et al., 2009; Ly et al., 2011a). Although several methods have been used to correct for dust extinction, it is still unclear how reliable each of them is, and under what circumstances. Some are rough statistical estimates to be applied to large samples, such as the common simple assumption of a constant one magnitude of extinction for H. This is an average, derived from studying the Balmer decrement of local galaxies (Kennicutt, 1992). But there is significant scatter, so that any single value will not apply to many individual galaxies. Local studies have used UV, H, and/or infrared measurements to derive wavelength-dependent extinction or estimate dust-corrected SFRs (Calzetti et al., 1994; Meurer et al., 1999; Buat et al., 2002; Salim et al., 2007). Also, studies have found that the dust reddening properties are correlated with galaxy’s properties (e.g., luminosity, Wang & Heckman, 1996). As such, reddening corrections should be measured for individual galaxies, from spectroscopy of their gas ionized by young stars.
The “gold standard” estimator is the Balmer decrement–H/H, which gives a reddening assuming a simple thin dust screen covers the H II regions in a given galaxy. This measured gas extinction in a galaxy might then be applied to its starlight, assuming that it is the same, or alternately half as much (Calzetti et al., 2000). However, Balmer decrement measurements require rest-frame optical spectra, which are especially difficult to obtain in high-redshift galaxy surveys.
In this paper, we present new data on the SFRs and dust reddening for 400 H-selected galaxies at –0.5. The sample is obtained from the Subaru Deep Field (SDF; Kashikawa et al., 2004) with deep broad-band and narrow-band (NB) imaging from Subaru’s prime focus imager, Suprime-Cam (Miyazaki et al., 2002). Throughout this paper, (1) all distance dependent measurements adopt a flat cosmology with , , and km s-1 Mpc-1, (2) a Chabrier (2003) initial mass function is assumed, and (3) we adopt a Calzetti et al. (2000) dust reddening formalism.
2. The Sample
Our new analysis is based on two unique samples of emission-line galaxies
selected in SDF by their excess flux in NB filters (Ly et al., 2007, hereafter L07).
These are NB921 (Å; Å) and NB973
(Å; Å).
Our selection of NB excess emitters uses the NB color–magnitude diagram
(illustrated in Figure 1), as in previous papers
(Fujita et al. 2003; L07, and references therein).
In total, 2512 NB921 and 1666 NB973 line emitters are identified, with
a minimum observed equivalent width (EW) of 32Å (0.2 mag NB excess),
and 70Å (0.25 mag NB excess), respectively.
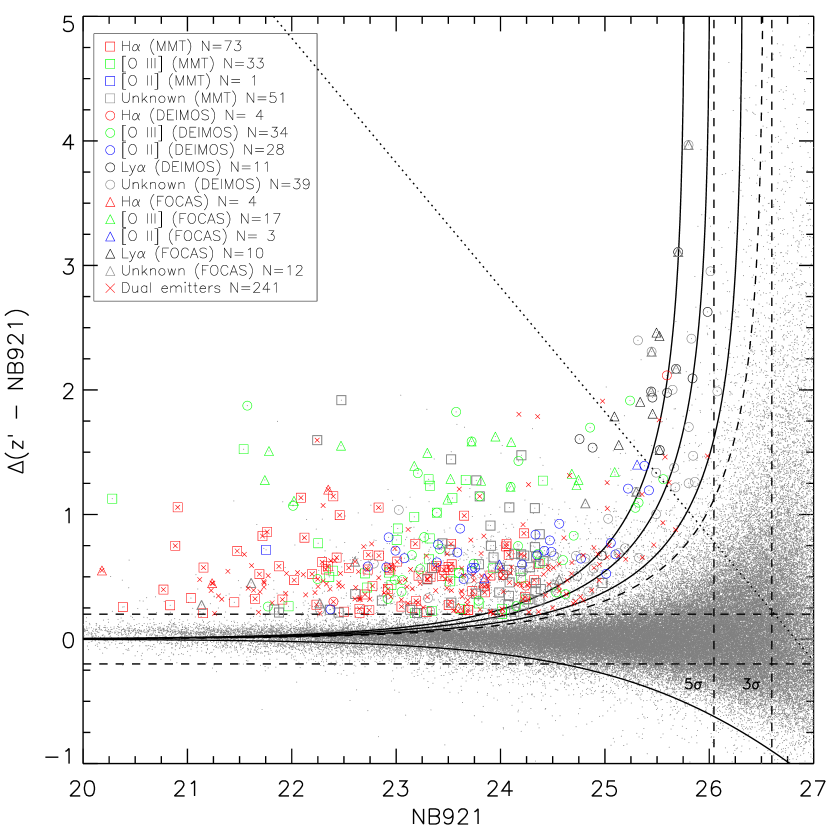
Since the NB filters are not centered on the central wavelength of the ′-band, correction to the continuum fluxes, as derived by extrapolating the ′–′ color, was applied to estimate the flux at the wavelength of the NB filter. This color correction decreases the scatter in ′–NB for non-NB excess emitters (at bright magnitudes) by as much as 50% for the NB973 sample, and allows us to select genuine emission-line sources down to 0.25 mag excess. The correction also reduces the contamination from red galaxies without emission lines, which are our greatest “false positives.”
2.1. Identification of H Emitters
Next we separate out the NB-excess sources whose NB emission is due to the H line, at redshifts of (NB921) and (NB973). In particular, these must be distinguished from other NB excesses produced by other strong nebular emission lines, such as [O iii] 5007 and [O ii] 3727 at higher redshifts. Our preferred method of identifying the H emitters is through spectroscopic redshifts, where available (see colored symbols in Figure 1 and Section 2.2.1).
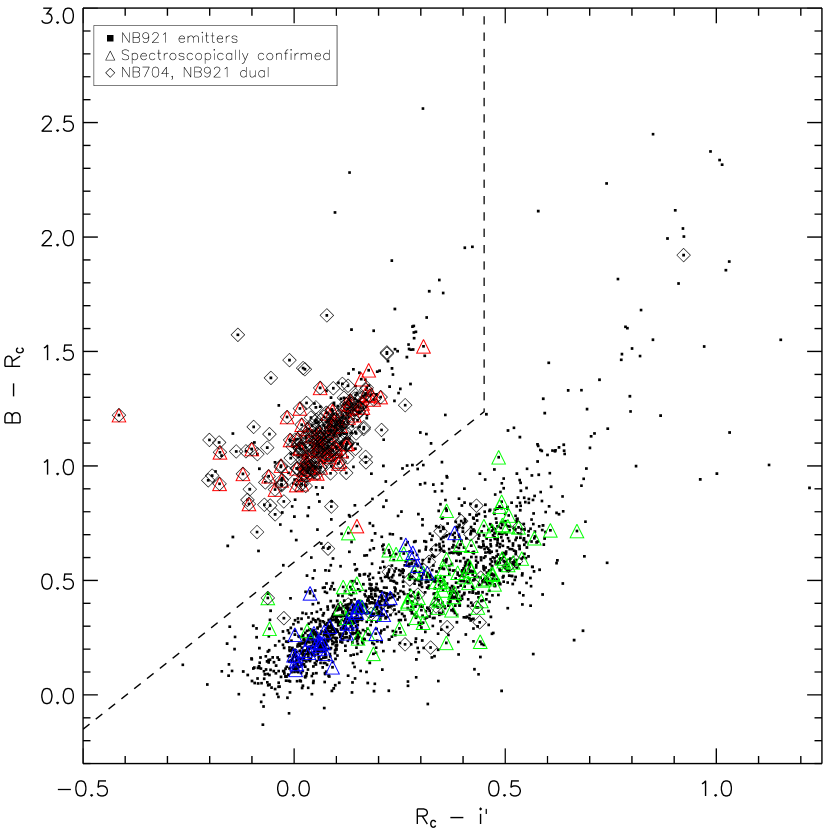
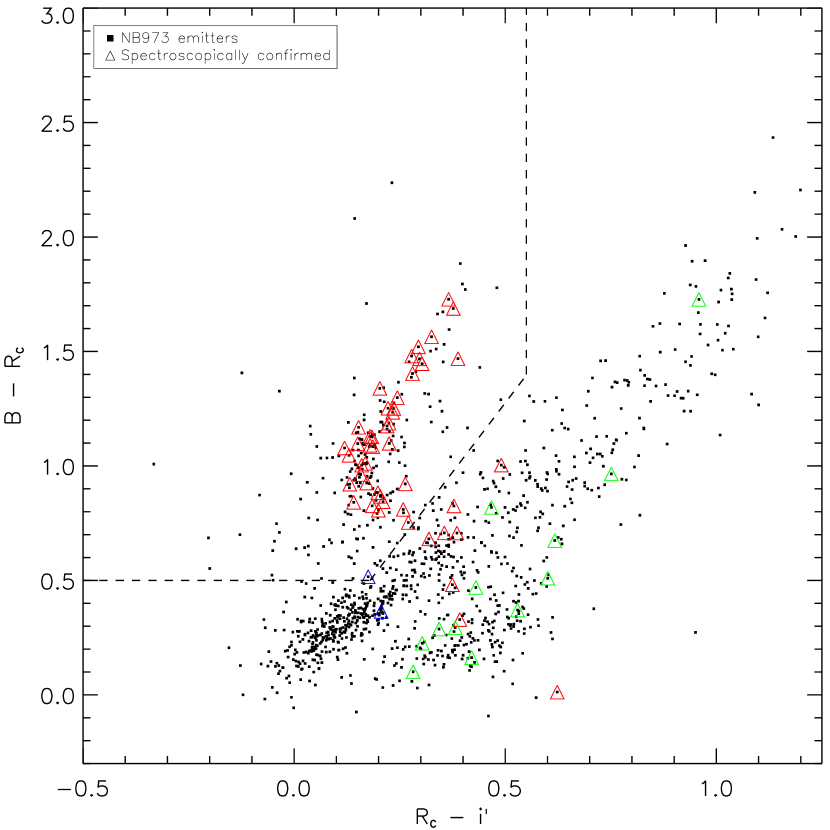
For the remaining NB-emitting galaxies lacking spectroscopy, we use the broad-band color technique developed in L07 to identify H emitters. We illustrate in Figure 2 the – and –′ colors of our NB excess emitters. There is a clear locus of sources with red – and blue –′ colors. Color cuts (indicated by dashed lines in Figure 2) were chosen to separate these H emitters from higher-redshift populations, which lack a Balmer/4000Å break in the – color. Such a selection was defined in our previous paper to yield a low (3%) interloper contamination rate (L07). The current larger sample strongly confirms the reliability of this broad-band color classification, as we again find small interloper fractions. A total of 401 and 249 H emitters are identified.
2.2. Independent Confirmations of H Reliability
2.2.1 Spectroscopy
Using several optical spectrographs, we observed 326 NB921 and 102 NB973 excess emitters. Our NB973 spectroscopic observations are sparser, since that sample became available much later. The majority (50% and 78% for the NB921 and NB973 samples, respectively) of our spectra are from Hectospec (Fabricant et al., 2005), the multi-object fiber-fed spectrograph for the MMT. We extend our spectroscopic sample with Subaru’s FOCAS (Kashikawa et al., 2002), and Keck’s DEIMOS (Faber et al., 2003). Our spectra typically have 1–2 hours of on-source integrations. The acquisition and reduction of DEIMOS and FOCAS data have been discussed in previous papers (Kashikawa et al., 2006; Ly et al., 2007; Kashikawa et al., 2011). The MMT spectra were reduced following standard procedures with the hsred reduction pipeline, and will be described further in Ly et al. (2012, in preparation).
Among these spectroscopically targeted NB921-excess emitters, 71% (232) have reliable redshifts (based on at least one other emission line). Similarly, 72% (73) of the NB973-excess emitters are spectroscopically identified. We note that these success rates are probably lower limits, since we do not include 23 (an additional 7%) NB921 and 6 (an additional 6%) NB973 sources that show single weak emission lines in their spectra which, if they are real, are consistent with the redshifts predicted by an emission line in the NB filter. The numbers of spectroscopically confirmed H, [O iii], [O ii], and Ly lines in NB921 (NB973) are 81 (47), 78 (12), 42 (2), and 21 (1), respectively. Thus, 20% of our H samples have been confirmed spectroscopically.
We note that Hectospec suffers from poor sensitivity and flat-fielding issues redward of 8500Å. While H is not measured in these spectra, the redshift determination is reliable due to detection of bluer emission lines, generally [O iii], H, and [O ii]. And for 41 (20) cases with strong emission lines, H is also detected at () significance. Thus the spectroscopy provides several emission-line ratios, which are useful for a number of astrophysical studies. In this Letter we concentrate on the estimation of extinction from the Balmer decrement; we defer discussions of gas metallicity measurements for these galaxies to a forthcoming paper (Ly et al. 2012, in preparation).
2.2.2 Dual Line Detection with NB Filter Pairs
We have independent confirmations of the reality of a reliable fraction of our NB emission lines, from imaging in a second NB filter. Our NB704111Å; Å. imaging of the SDF allows us to detect the [O iii] emission at while H simultaneously enters the NB921 filter (this was first presented in L07, ). Other surveys (Hippelein et al., 2003; Sobral et al., 2011; Nakajima et al., 2012) have exploited similar dual line coincidences to confirm emission-line galaxies at a particular redshift.
In SDF, a total of 241 “dual emitters” were identified. Among the dual emitters, 80 were spectroscopically targeted, and only nine of them have unidentified redshifts. Among the remaining 71 sources, 66 of them were H emitters. There are only two cases of dual [O ii] and H at . Since these lines are weaker than [O iii] and H for typical star-forming galaxies at these redshifts, it is not a surprise that the majority of spectroscopically confirmed dual emitters are at . These dual emitters are shown as red crosses in Figure 1 and black diamonds in Figure 2; they further confirm that the two-color selection for H NB921 emitters is highly effective (89% meets the ′ color cuts). Since the redshift ranges covered in H by NB921 and in [O iii] by NB704 only overlap by roughly 50%, the large rate of dual emitters indicates that nearly all H emitters have [O iii] emission, if only it is searched for at the appropriate redshift.
3. Observables for H Emitters
3.1. H Luminosities
The H fluxes () and luminosities () are derived (see L07) from the ′ and NB filter measurements, as follows:
| (1) | |||||
| (2) |
where is the flux density in erg s-1 cm-2 Å-1 for band “X”, ’s are the FWHMs of the filters ( = 955Å), and is the luminosity distance.
3.2. Stellar Populations from SED Modeling
We modeled the fifteen-band SED of each galaxy to derive stellar masses, SFRs, dust reddening ((–)), and stellar ages. At , the data span rest-frame 1000Å–1.5m. The spectral synthesis models are discussed further in Ly et al. (2011b). In brief, we use the FAST code (Kriek et al., 2009), with exponentially declining star-formation history models from Bruzual & Charlot (2003). In these pure stellar-continuum broadband fits, the redshifts are accurately fixed, either from the spectroscopic values when available, or from the presence of H in the NB bandpass. If nebular emission lines were accounted for, we expect to obtain somewhat younger less massive galaxy fits (Atek et al., 2011).
4. Results
4.1. Balmer Decrements
A subset of our H emitters with MMT spectroscopy222We only consider the great majority of our spectra, from the MMT, since their emission-line flux ratios are better determined. has significant detection of H. To obtain accurate emission-line fluxes from spectra, we calibrated them using Hectospec observations of standards. To check the accuracy of our flux calibration, we compare the estimated continuum fluxes in our spectra for 5000Å–8000Å to those from our ancillary broad-band optical data. We find good one-to-one agreement at the 20% level. We correct for stellar H absorption by assuming a rest-frame EW of 2Å.
To obtain the H fluxes, two corrections must be applied. First, one must correct the NB emission-line fluxes for contamination from [N II] 6548,6583. Local studies have found that the H/[N II] flux ratio to be 2.3 (Kennicutt, 1992; Gallego et al., 1997). However, in L07, we found from optical spectroscopy that many of our H emitters have very weak [N II] emission. This is expected, as our galaxy population probes lower masses ( M☉), and the mass–metallicity relation would suggest weaker [N II] emission. In our same MMT spectroscopic observations, we obtained spectra of 19 H emitters at from another NB filter. Aside from redshift, these galaxies are no different from those at in terms of luminosity, stellar mass, and H fluxes. For these galaxies we measured an average H/[N II](6548+6583) ratio of 5.62.0. We assume that this average applies to all our NB measurements.
Second, the NB filters do not have perfectly rectangular transmissions, and as a result, the measured emission-line fluxes can be underestimated when an emission line falls away from the center of the NB filter. To correct for this effect, we generated model spectra consisting of a flat continuum with an added emission line of various strengths at the location that is dictated by the spectroscopic redshift. We convolved these spectra with our filters’ throughputs to measure the expected observed ′–NB colors. When compared to the measured ′–NB colors from our imaging, we are able to determine the intrinsic EW of the emission line, and hence the intrinsic emission-line flux when scaled by the continuum flux.
The combination of spectroscopy and NB photometry allows us to estimate Balmer decrement for individual galaxies. Among 73 NB921 (47 NB973) H emitters with MMT spectroscopy, we have 30 (26) 5 H detections, 16 (10) 3–5 H detections, and 9 (4) 2–3 “detections” which we show 3 lower limits on the Balmer decrements.
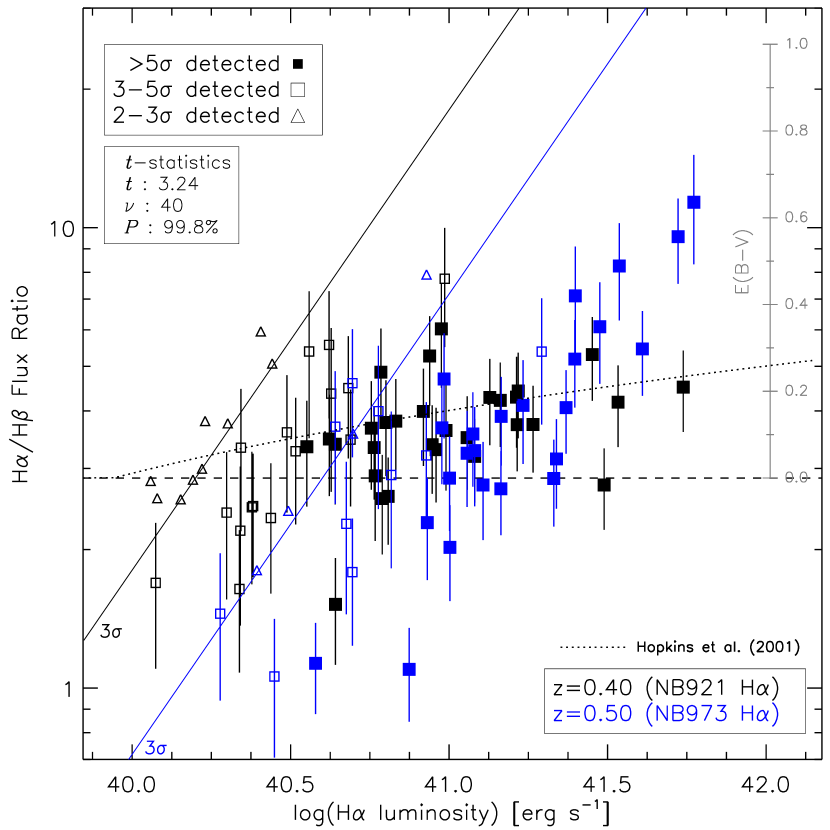
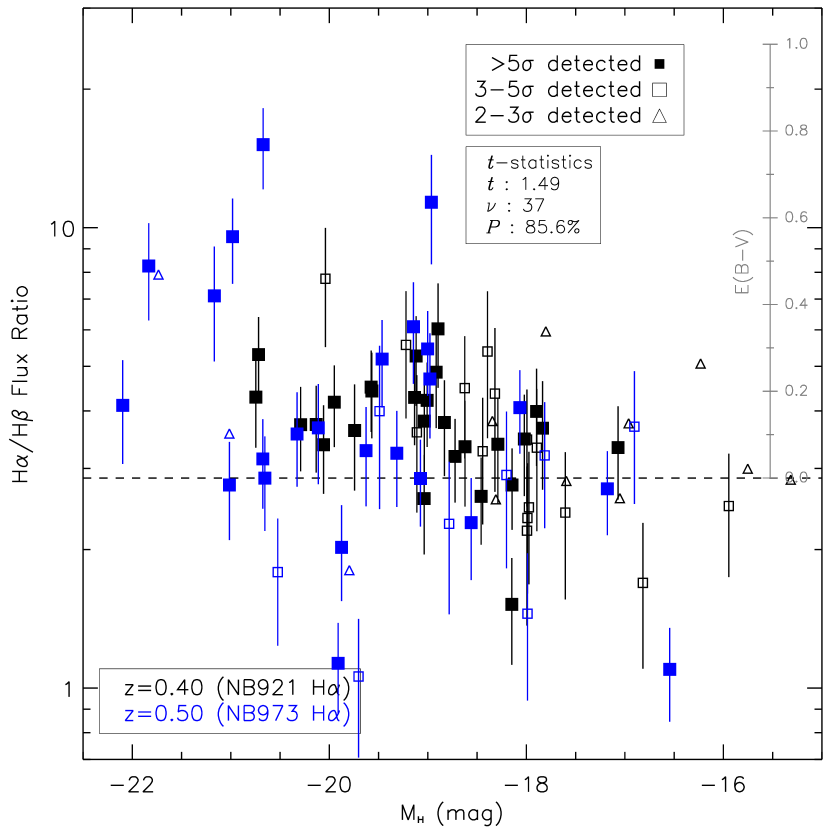
In Figure 3, we compare the Balmer decrements for these galaxies against their H observed luminosities and absolute -band magnitudes, . We find a correlation between the Balmer decrement and H luminosity (99.8% significance), which is qualitatively consistent with those derived for galaxies by Hopkins et al. (2001) (hereafter H01; see Equation 4.2). We determine that dust reddenings are systematically larger in the more massive galaxies, but the correlation is weak (85.6% significance). Other studies (e.g., Garn et al., 2010) have also found a correlation between dust attenuation and stellar mass.
Although not illustrated, we did compare the (–) inferred from Balmer decrement against those estimated from SED modeling. We find a weak correlation, and are limited by significant Balmer decrement measurement uncertainties and a small sample.
4.2. Reliable Estimates on the Extinction-Corrected SFRs
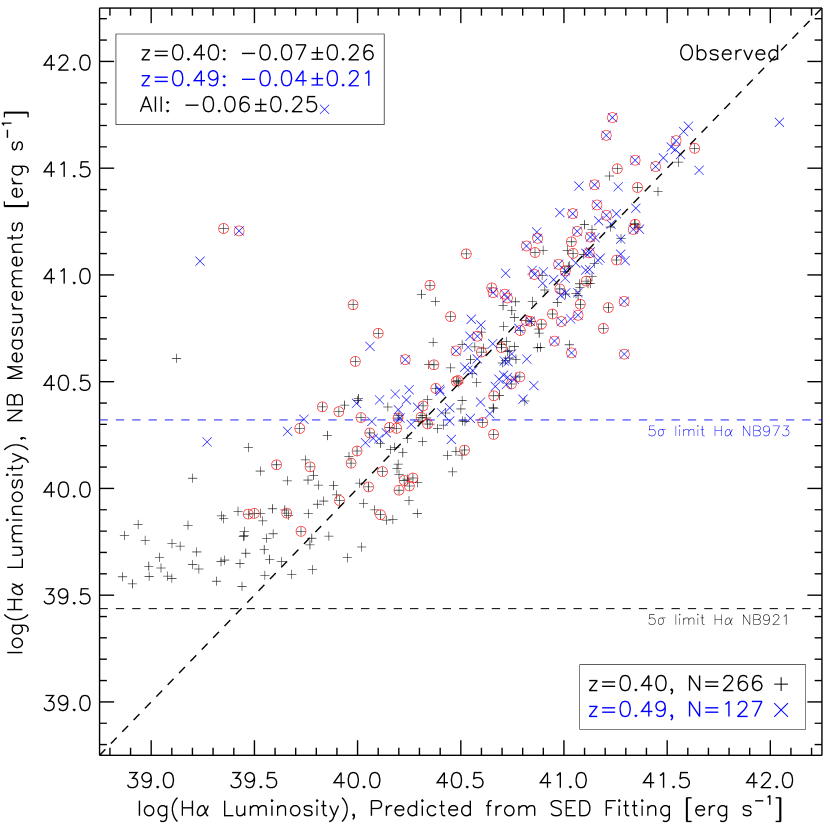
Since estimating (–) from the Balmer decrement is difficult, we pursue other methods to correct for dust attenuation. We illustrate in Figure 4 a comparison between the reddened H luminosity from NB observations and the SED-predicted reddened H luminosity:
| (3) | |||||
| (4) | |||||
The factor of 1.85 is for the ratio between stellar and nebular reddening: (–)gas = 1.85 (–) (Calzetti et al., 2000), and is the conversion constant for the Kennicutt et al. (2009, hereafter K09) SFR– relation:
| (5) |
Since the modeling was performed with only broad-band photometry, the two axes are strictly independent of one another. It illustrates that a nearly one-to-one correspondence with an rms of 0.25 dex exists, and argues that the SFRs from SED modeling (hereafter “SED SFRs”) is reliable over 3 dex. Because the model fits to SFR and reddening are primarily influenced by the strength and slope of the UV continuum, the SED SFRs are essentially dust-corrected UV SFRs. This comparison also supports the idea that dust extinction is lower for starlight than for gas, consistent with Calzetti et al. (2000). Without a factor of 1.85, Figure 4 would show a statistical deviation of 0.10 dex (25%) from one-to-one.
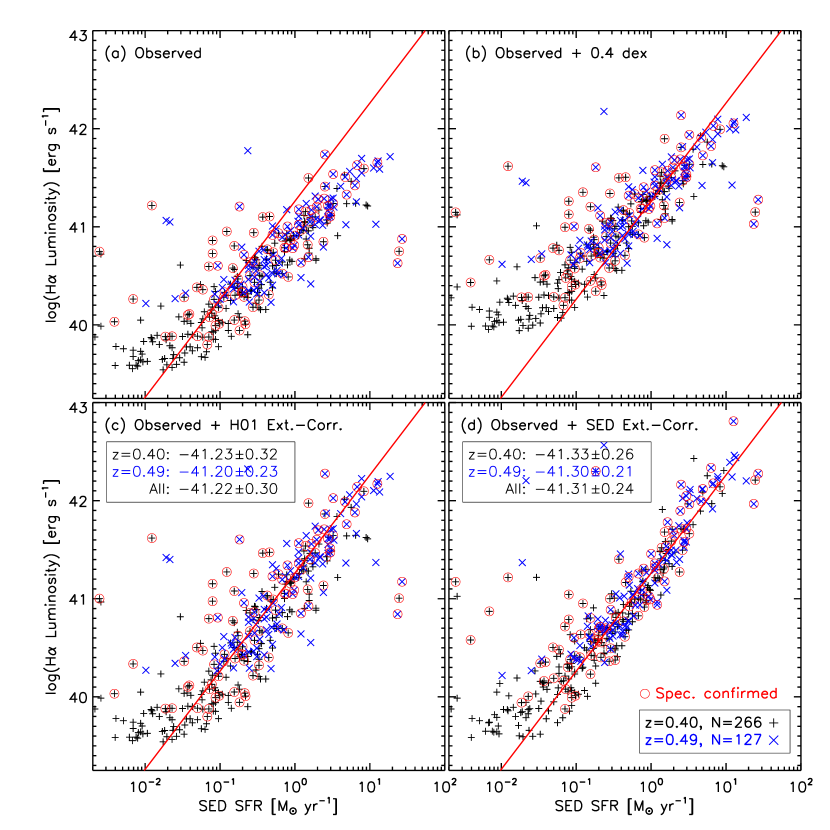
Using the SED SFRs as a reliable estimate of the intrinsic SFRs, we illustrate in Figure 5 the H luminosity with different statistical corrections for dust attenuation. We limit our analyses to galaxies where their photometric redshifts (derived from EaZy; Brammer et al., 2008) are consistent with the NB redshifts. Excluded galaxies are generally fainter sources where greater photometric uncertainties led to poorer fits. The H NB921 and NB973 samples are limited to 266 and 127 galaxies, respectively.
First, in Figure 5a, we show the observed H luminosity on the -axis. The majority of sources clearly fall below the K09 relation (red lines), as expected since these luminosities have not yet been de-reddened. Next we adopt three possible reddening corrections. The first is a uniform mag of extinction. This is shown in Figure 5b. Although the average correction is reasonable, it is systematically too large for those with low luminosities.
In the second, shown in Figure 5c, we adopt the H01 SFR-dependent reddening formalism recast in luminosity:
where and are the observed and intrinsic H luminosities, respectively. Adopting this dust-reddening correction, we find consistency with the SED SFRs over 3 dex with an rms of 0.3 dex.
Finally in Figure 5d, we use individual estimates of the from modeling each galaxy SED (see Equation 4). Compared with the H01 correction, this approach significantly reduces the scatter (rms of 0.24 dex). Figures 4 and 5 illustrate the following results:
-
1.
The assumption of mag applies for observed H luminosities of 1040.5–1042 erg s-1 (observed SFRs above 0.2–10 M☉ yr-1), but is invalid for galaxies with SFRs 0.2 M☉ yr-1.
-
2.
Dust reddening is greater in cases with higher H luminosities, which have been suggested by previous studies. This is further shown in Figure 3.
-
3.
The H luminosity-dependent H01 relation succeeds in making the two independent estimates of SFR agree across three orders of magnitude (–10 M☉ yr-1) with an rms of 0.3 dex. This suggests that the behaviors of dust in star-forming galaxies have remained the same (relative to the H luminosity) over the past five billion years. Similar findings by Momcheva et al. (2011) have been found, and extend the statement out to look-back time of 7 billion years ().
-
4.
With broad-band SED modeling (rest-frame 1000Å–1.5m), we have determined reliable de-reddened SFRs that can predict the H luminosity over 3 dex, and suggests that SFRs derived from full SED modeling can be used as a reliable substitute when direct H measurements are unavailable.
-
5.
These comparisons also indicate that dust reddening for the gaseous component is more significant than the stellar component, and is in agreement with Calzetti et al. (2000).
5. Conclusions
We used narrow-band imaging (at 9200Å and 9750Å) to identify large samples of line-emitting galaxies in the Subaru Deep Field. In our previous paper (L07) we developed broad-band color cuts to isolate those produced by the H line at . In this paper we present new spectroscopy of 400 NB excess emitters. We confirm that the overwhelming majority of them are true line emitters and that the previously used color selection technique is highly efficient for identifying H emitters.
We then find that the gas extinctions that we measure from the Balmer decrement increase systematically with higher H luminosity and with higher stellar mass. In particular, the correlation with H luminosity is consistent with H01.
Finally, we compare the de-reddened SFRs that adopt different reddening corrections with the SFR obtained from modeling the broad-band 1000Å–1.5m SED. We find that a constant reddening correction is not appropriate for low luminosity galaxies, and that a correction which increases with luminosity proposed by H01 yields a good (0.3 dex) overall agreement with the modeled SFRs over 3 dex. We also compare the observed H luminosity from NB measurements with those predicted when the SED SFRs are converted to an H luminosity and reddened. We find significant one-to-one agreement over 3 dex with an rms of 0.25 dex. Such finding suggests that broad-band far-ultraviolet to near-infrared SED modeling can yield reliable SFRs for star-forming galaxies at intermediate redshifts modulo direct H measurements.
References
- Atek et al. (2011) Atek, H., et al. 2011, ApJ, 743, 121
- Brammer et al. (2008) Brammer, G. B., van Dokkum, P. G., & Coppi, P. 2008, ApJ, 686, 1503
- Bruzual & Charlot (2003) Bruzual, G., & Charlot, S. 2003, MNRAS, 344, 1000
- Buat et al. (2002) Buat, V., Boselli, A., Gavazzi, G., & Bonfanti, C. 2002, A&A, 383, 801
- Calzetti et al. (1994) Calzetti, D., Kinney, A. L., & Storchi-Bergmann, T. 1994, ApJ, 429, 582
- Calzetti et al. (2000) Calzetti, D., Armus, L., Bohlin, R. C., Kinney, A. L., Koornneef, J., & Storchi-Bergmann, T. 2000, ApJ, 533, 682
- Colbert et al. (2006) Colbert, J. W., Malkan, M. A., & Rich, R. M. 2006, ApJ, 648, 250
- Faber et al. (2003) Faber, S. M., et al. 2003, Proc. SPIE, 4841, 1657
- Fabricant et al. (2005) Fabricant, D., et al. 2005, PASP, 117, 1411
- Fujita et al. (2003) Fujita, S. S., et al. 2003, ApJ, 586, L115
- Gallego et al. (1997) Gallego, J., Zamorano, J., Rego, M., & Vitores, A. G. 1997, ApJ, 475, 502
- Garn et al. (2010) Garn, T., et al. 2010, MNRAS, 402, 2017
- Goto et al. (2010) Goto, T., et al. 2010, A&A, 514, A6
- Hicks et al. (2002) Hicks, E. K. S., Malkan, M. A., Teplitz, H. I., McCarthy, P. J., & Yan, L. 2002, ApJ, 581, 205
- Hippelein et al. (2003) Hippelein, H., et al. 2003, A&A, 402, 65
- Hopkins et al. (2001) Hopkins, A. M., Connolly, A. J., Haarsma, D. B., & Cram, L. E. 2001, AJ, 122, 288
- Chabrier (2003) Chabrier, G. 2003, PASP, 115, 763
- Kashikawa et al. (2002) Kashikawa, N., et al. 2002, PASJ, 54, 819
- Kashikawa et al. (2004) Kashikawa, N., et al. 2004, PASJ, 56, 1011
- Kashikawa et al. (2006) Kashikawa, N., et al. 2006, ApJ, 648, 7
- Kashikawa et al. (2011) Kashikawa, N., et al. 2011, ApJ, 734, 119
- Kennicutt (1992) Kennicutt, R. C., Jr. 1992, ApJ, 388, 310
- Kennicutt et al. (2009) Kennicutt, R. C., et al. 2009, ApJ, 703, 1672 [K09]
- Kriek et al. (2009) Kriek, M., van Dokkum, P. G., Labbé, I., Franx, M., Illingworth, G. D., Marchesini, D., & Quadri, R. F. 2009, ApJ, 700, 221
- Ly et al. (2007) Ly, C., et al. 2007, ApJ, 657, 738 [L07]
- Ly et al. (2009) Ly, C., et al. 2009, ApJ, 697, 1410
- Ly et al. (2011a) Ly, C., et al. 2011a, ApJ, 726, 109
- Ly et al. (2011b) Ly, C., et al. 2011b, ApJ, 735, 91
- Malkan et al. (1995) Malkan, M., Teplitz, H., & McLean, I. 1995, ApJ, 448, L5
- Meurer et al. (1999) Meurer, G. R., Heckman, T. M., & Calzetti, D. 1999, ApJ, 521, 64
- Miyazaki et al. (2002) Miyazaki, S., et al. 2002, PASJ, 54, 833
- Momcheva et al. (2011) Momcheva, I., et al. 2011, AJ, submitted
- Nakajima et al. (2012) Nakajima, K., et al. 2012, ApJ, 745, 12
- Oke (1974) Oke, J. B. 1974, ApJS, 27, 21
- Salim et al. (2007) Salim, S., et al. 2007, ApJS, 173, 267
- Shim et al. (2009) Shim, H., et al. 2009, ApJ, 696, 785
- Sobral et al. (2011) Sobral, D., et al. 2011, MNRAS, in press (arXiv:1109.1830)
- Wang & Heckman (1996) Wang, B., & Heckman, T. M. 1996, ApJ, 457, 645