Discovery of a compact gas-rich DLA galaxy at :
evidences for a starburst-driven outflow
††thanks: Based on data obtained with MagE at the Clay telescope of the Las Campanas Observatory (CNTAC Prgm. ID 2011B-90)
and X-shooter/UVES at the Very Large Telescope of the European Southern Observatory
(Prgm. ID 286.A-5044 and 385.A-0778).
We present the detection of Ly , [O iii] and H emission associated with an extremely strong damped Lyman- (DLA) system ( ) at towards the quasar SDSS J113520.39001053.56. This is the largest H i column density ever measured along a QSO line of sight, though typical of what is seen in GRB-DLAs. This absorption system also classifies as ultra-strong Mg ii system with Å. The mean metallicity of the gas (Zn/H = 1.1) and dust depletion factors (Zn/Fe = 0.72, Zn/Cr = 0.49) are consistent with (and only marginally larger than) the mean values found in the general QSO-DLA population.
The [O iii]-H emitting region has a very small impact parameter with respect to the QSO line of sight, ″ (0.9 kpc proper distance), and is unresolved. From the H line, we measure a significant star formation rate SFR 25 M⊙ yr-1 (uncorrected for dust). The shape of the Ly line is double-peaked, which is the signature of resonant scattering of Ly photons, and the Ly emission is spatially extended. More strikingly, the blue and red Ly peaks arise from distinct regions extended over a few kpc on either side of the star-forming region. We propose that this is the consequence of Ly transfer in outflowing gas. The presence of starburst-driven outflows is also in agreement with the large SFR together with a small size and low mass of the galaxy ( M⊙). From putting constraints on the stellar UV continuum luminosity of the galaxy, we estimate an age of at most a few yr, again consistent with a recent starburst scenario.
We interpret the data as the observation of a young, gas rich, compact starburst galaxy, from which material is expelled through collimated winds powered by the vigorous star formation activity. We substantiate this picture by modelling the radiative transfer of Ly photons in the galactic counterpart. Though our model (a spherical galaxy with bipolar outflowing jets) is a simplistic representation of the true gas distribution and velocity field, the agreement between the observed and simulated properties is particularly good (spectral shape and width of the Lyman- emission, spatial configuration, escape fraction as well as absorption kinematics, H i column density and dust reddening).
Finally, we propose that selecting DLAs with very high H i column density may be an efficient way to detect star-forming galaxies at small impact parameters from the background QSO lines of sight.
Key Words.:
quasars: absorption lines – galaxies: ISM – galaxies: high-redshift – galaxies: star formation – quasars: individual: SDSS J113520.39001053.561 Introduction
Detecting and performing detailed studies of high- (i.e. ) galaxies is observationally a challenging task. Several observational strategies have emerged in the past 15 years, each of them targeting a subset of the population of high- galaxies –which is named after the selection technique– with some overlap in their properties. For example, because of their selection in flux-limited surveys, Lyman-break galaxies (LBGs, Steidel et al., 2003) tend to probe the bright end of the high-redshift galaxy luminosity function. A fraction of LBGs are also Lyman- emitters (LAEs, see e.g. Cowie & Hu, 1998). However, as most LAEs are selected from the Ly emission line, they tend to sample lower luminosities better than colour-selected LBGs (Fynbo et al., 2003; Kornei et al., 2010). Indeed, recent deep searches of LAEs seem to have reached the faint end of the high- luminosity function (e.g. Rauch et al., 2008; Grove et al., 2009).
In turn, the detection of damped Lyman- systems (DLAs) in absorption against bright background sources (such as quasars or gamma ray burst (GRB) afterglows) has the major advantage that it does not depend on the luminosity of the associated galaxies but on the cross-section of the neutral gas. These systems are selected from their large neutral hydrogen column densities, (Wolfe et al., 1986) and represent the main reservoir of neutral hydrogen at high redshift (e.g. Noterdaeme et al., 2009b). The presence of associated heavy elements (e.g. Prochaska & Wolfe, 2002) and molecules (e.g. Petitjean et al., 2000; Ledoux et al., 2003; Noterdaeme et al., 2008), the evolution with redshift of the H i mass density in DLAs (Péroux et al., 2003; Prochaska et al., 2005; Noterdaeme et al., 2009b) and the detectability of DLAs over a wide range of redshift make them the appropriate laboratories for studying the cosmological evolution of star formation activity in a luminosity-unbiased way.
Although observational studies of DLAs have been pursued over 25 years, an important question that remains unanswered yet is the connection between DLAs and star-forming galaxies. Because of their selection, most DLA galaxies probably lay on the faint end of the luminosity function (e.g. Fynbo et al., 2008). Nevertheless, DLA galaxies can provide substantial contributions to the global SFR density at high redshifts (Wolfe et al., 2003; Srianand et al., 2005; Rauch et al., 2008; Rahmani et al., 2010). In addition, it has long been debated whether the kinematics of the absorbing gas, studied through the velocity profiles of metal absorption lines, is more representative of that of large rotating galactic discs (Prochaska & Wolfe, 1997) or small low-mass galactic clumps (Ledoux et al., 1998) that build up hierarchically galaxies known today (e.g. Haehnelt et al., 1998). The detection of DLA galactic counterparts is therefore of first importance to shed light on the nature of DLAs.
Until recently, searches for direct emission from high redshift intervening DLA galaxies have resulted mostly in non-detections (e.g. Bunker et al., 1999; Kulkarni et al., 2000, 2006; Lowenthal et al., 1995; Christensen et al., 2009, as well as several unpublished works) with few cases spectroscopically confirmed through the detection of Ly- emission (Møller et al., 2002, 2004). Thankfully, improved selection strategies have emerged from the understanding that correlations between metallicity, mass and luminosity observed for field galaxies also apply to DLA galaxies (Møller et al., 2004; Ledoux et al., 2006; Fynbo et al., 2008). This led to several new detections (Fynbo et al. 2010, 2011, Krogager et al., in prep).
In this paper, we present an interesting case with the detection of Ly , H and [O iii] emission associated with an extremely strong DLA system at towards the quasar SDSS J113520.39001053.56 (hereafter J11350010). In Sect. 2, we detail our observations performed with MagE and X-shooter and describe UVES data retrieved from the archive. The properties of the absorbing gas along the QSO line of sight are studied in Sect. 3. We analyse and discuss the emission properties of the galaxy in Sect.4. We use radiative transfer (RT) modelling of the galactic Ly emission to test our results in Sect. 5. Finally, we present our conclusions in Sect. 6. In this work, we use standard CDM cosmology with , and H0 = 70 Mpc-1 (Komatsu et al., 2011).
2 Observations and data reduction
2.1 Clay/MagE
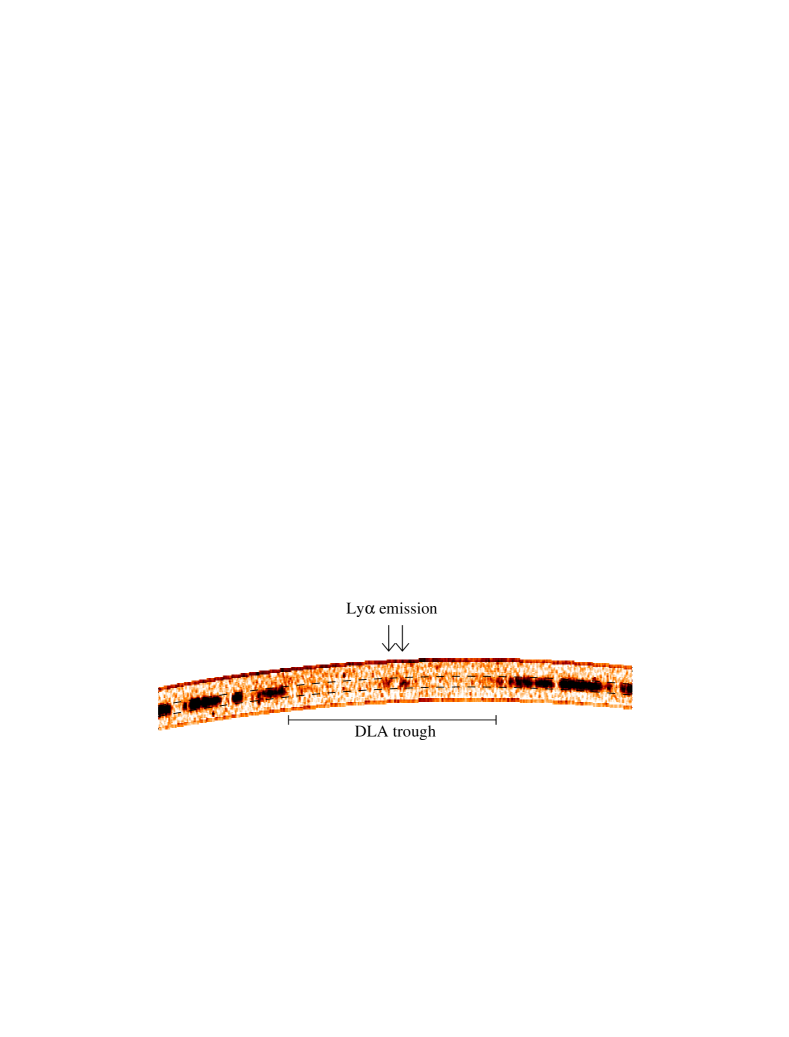
We observed J11350010 () on February 12, 2011 with the Magellan Echellette spectrograph (MagE; Marshall et al., 2008) mounted on the 6.5 m Clay telescope at Las Campanas Observatory. MagE is a moderate-resolution long-slit spectrograph covering at once the range 300 nm to 1 m. The spectrograph has been designed to have excellent throughput in the blue with an overall efficiency (telescope plus instrument) higher than 15% at 3900 Å. In spite of very bad weather conditions, we could obtain a 1 h spectrum of the quasar with a slit width of 2 arcsec (the length is fixed to 10 arcsec). This allowed us to cover a 1785 kpc region around the QSO (proper distance at ) in a single exposure. We detected a double-peaked Lyman- emission at the systemic velocity of metal absorption lines (see Fig. 1). The significance of the detection (using a 3015 pixels aperture) is above 7 for each peak independently. From Fig. 1 it is also clear that the emission falls well within the extent of the QSO trace, indicating a small impact parameter ( arcsec). Unfortunately, the bad observing conditions prevented us from obtaining additional spectra of this target at other slit angles and/or narrower slit width. Nevertheless, the detection in a single exposure demonstrates that MagE is particularly well suited to search for faint Ly emission at high redshift. The length of the slit and the good spatial sampling (0.3 arcsec/pixel) allows one to efficiently cover the expected position of DLA galaxies as well as to measure their impact parameter using spectra obtained at 2-3 slit position angles (see e.g. Fig. 1 of Fynbo et al., 2010). Similar searches with MagE are probably also possible even further in the blue, close to the atmospheric cutoff.
2.2 VLT/X-shooter
Follow-up observations were performed in service mode with X-shooter (Vernet et al., 2011) at the European Southern Observatory (ESO) Very Large Telescope (VLT). The observations were performed under good seeing ( arcsec), at low airmass, and in dark time (new moon) on May 1st and 2nd, 2011 using Director Discretionary Time. X-shooter covers the full wavelength range from 300 nm to 2.5 m at intermediate spectral resolution thanks to the simultaneous use of three spectroscopic arms (UVB, VIS and NIR). Therefore, X-shooter is a suitable instrument not only for detecting Ly down to the atmospheric cutoff, but also for detecting rest-frame optical lines (this work and Fynbo et al. 2010, 2011). We used the long-slit mode to observe the quasar at three position angles (PAs) for slightly more than 1 h each. To optimise the sky subtraction in the NIR, the nodding mode was used following a ABBA scheme with a nod throw of 5 arcsec and an additional jitter box of 1 arcsec. The log of the X-shooter observations is given in Table 1.
The 2D and 1D spectra were extracted using the X-shooter pipeline v1.3.7 (Goldoni et al., 2006). We remarked a constant 0.5 pixel shift for exposures from the VIS arm (resp. UVB) towards redder (resp. bluer wavelengths)111This could originate from a thermal drift between calibration and science exposures, combined with possible flexure residuals or from a problem with the current X-shooter pipeline.. The shift was clearly apparent in the overlapping UVB-VIS region and by comparing both UVB and VIS spectra with a high-resolution UVES spectrum (see below) of the same object. This was further confirmed by comparing the observed (VLT rest-frame) wavelengths of telluric absorption lines (at 7000, 7600 and 9400 Å) with a synthetic spectrum from HITRAN (Rothman et al., 2005). Although this has little consequence on the science results, we corrected the wavelength scales accordingly.
The 1D spectra were then combined altogether using a sliding window and weighting each pixel by the inverse of its variance. The spectrum has been corrected for relative spectral response of the instrument using standard stars as reference. Subsequent constant rescaling of the UVB and VIS spectra was necessary to match the SDSS spectrum. The NIR spectrum was scaled to match the VIS spectrum in the overlapping region around m. We then corrected the overall spectrum for Galactic extinction using dust map from Schlegel et al. (1998). The observed flux at m corresponds very well (within 10%, see also Fig. 6) to the J-band magnitude extracted from 2MASS images (J = 17.19, Schneider et al., 2010).
The spectral resolution of the combined spectrum in the visible, , was measured directly from the width of telluric absorption lines. This is higher than the nominal resolution expected for the setting used () and is due to the seeing being smaller than the slit width. We estimated the UVB and NIR resolution following Fynbo et al. (2011) and obtained and , respectively. We checked that the resolution in the UVB is consistent with the width of the narrowest lines in the spectrum.
| PA | Observing date | DIMM seeing | Air Mass | Exposure time (s) | ||
|---|---|---|---|---|---|---|
| (arcsec) | UV | Vis | NIR | |||
| 0° | 01/05/2011 | 0.760.06 | 1.1 | 41000 | 4965 | 42480 |
| 60° | 01/05/2011 | 0.590.07 | 1.2 | 41000 | 4965 | 42480 |
| 60° | 02/05/2011 | 0.800.09 | 1.1 | 41000 | 4965 | 42480 |
2.3 VLT/UVES
Finally, we retrieved a single 4760 s exposure high-resolution spectrum from the ESO archive (Prgm. ID.: 385.A-0778(A), PI: C. Péroux), which was obtained using the VLT Ultraviolet and Visual Echelle Spectrograph (UVES; Dekker et al., 2000) with both blue and red arms with Dichroic 1 and a binning . We reduced the spectrum using the UVES pipeline v4.9.5 based on the ESO Common Pipeline Library system. The seeing varied between 1.01 and 1.37″ during the exposure, yielding a resolving power of in the blue and in the red with the slit width of 1″. The signal-to-noise ratio of the UVES spectrum is S/N6 per pixel at 5000 Å, i.e. more than a factor of 10 lower than the SNR in the X-shooter spectrum at the same wavelength. However, its spectral resolution is about 5 times higher. While most of the paper is based on X-shooter data, the availability of a UVES spectrum will help us to check the velocity spread and structure of the absorption lines as well as detect saturation of the latter.
3 Properties of the absorbing gas
In this section, we study the properties of the absorbing gas along the QSO line of sight. We analysed the DLA system at towards J11350010 using standard Voigt-profile fitting techniques to derive the column densities of different species. Atomic data were taken from Morton (2003) and abundances are given with respect to solar values (Asplund et al., 2009) with [X/H] X/HX/H.
3.1 Neutral gas content
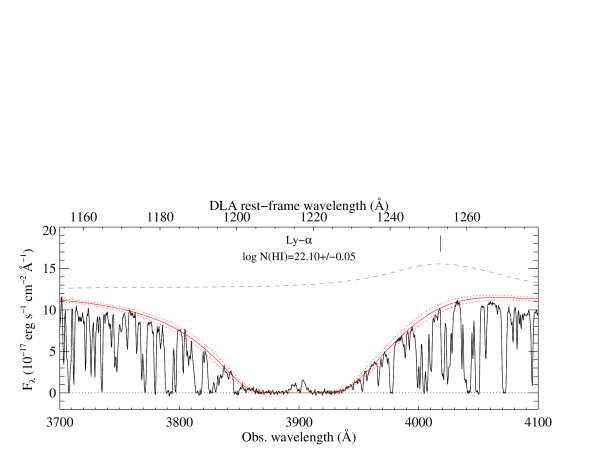
From fitting the damped Lyman- absorption line, we measure the total column density of atomic hydrogen to be (see top panel of Fig. 2). Though the exact placement of the QSO continuum is somewhat complicated by the presence of the QSO Ly +O vi emission line, the H i column density is very well constrained by the core of the DLA profile. This is the largest H i column density ever measured in a QSO absorber at high-.
3.2 Metal and dust content
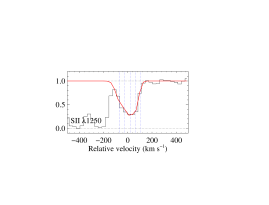
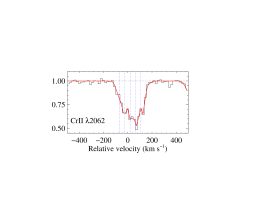
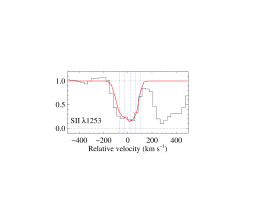
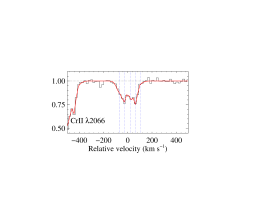
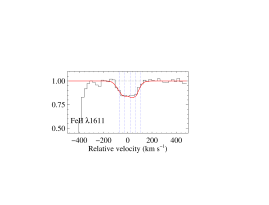
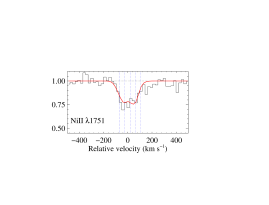
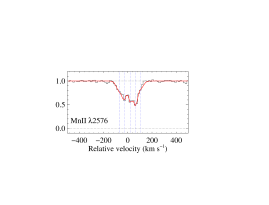
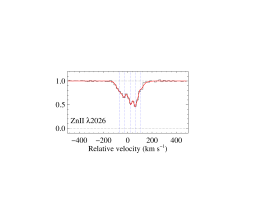
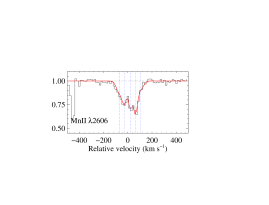
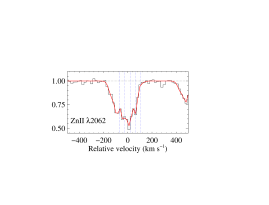
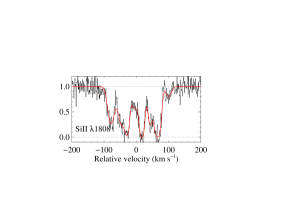
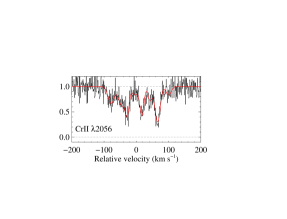
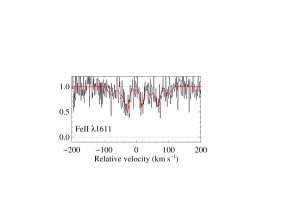
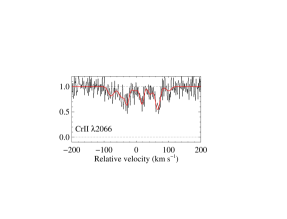
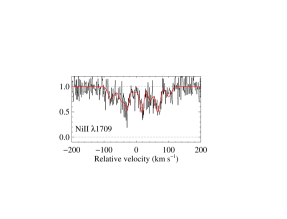
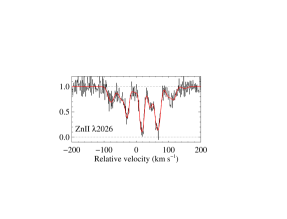
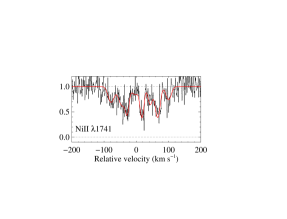
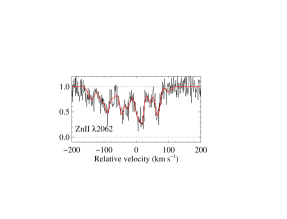
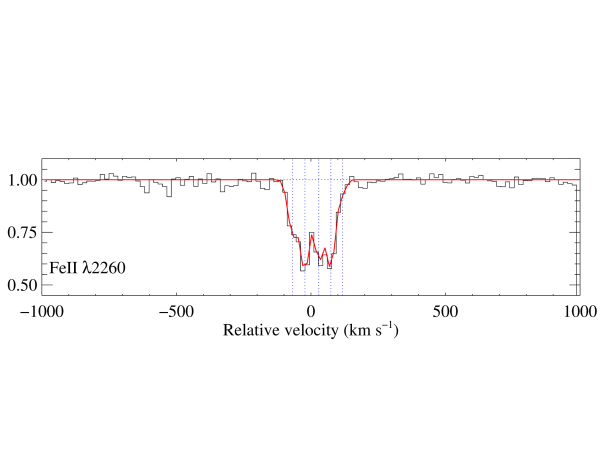
Absorption lines from S+, Si+, Fe+, Zn+, Ni+, Cr+ and Mn+ are detected spread over around in the X-shooter spectrum. Five components were used to model the observed absorption lines. The continuum was fitted locally around each absorption line using low order splines over unabsorbed regions. The results from the simultaneous multiple Voigt-profile fitting are presented in Fig. 3 and Table 2. Note that, because of the lower spectral resolution in the UVB arm () compared to the VIS arm (), the overall profile appears smoother for absorption lines in the UVB (S ii1250,1253, Fe ii1611 and Ni ii1709,1741,1751).
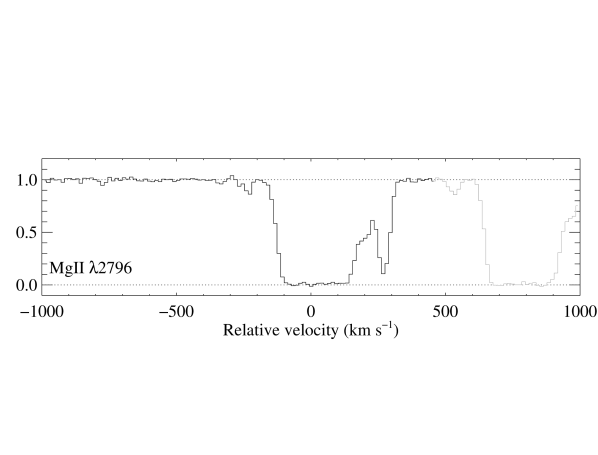
Measuring column densities using medium-resolution spectroscopy may lead one to underestimate the true values since saturation of the lines can be easily hidden and the velocity decomposition of the profile may be too simplistic. The availability of a high-resolution UVES spectrum in the ESO archive provides a good opportunity to check the values derived here. We performed an independent analysis of the UVES spectrum to measure the column densities of the metals. The high-resolution velocity profile (see Fig. 4) presents well separated clumps as inferred from the X-shooter spectrum (see Fig. 3). The total column densities obtained using UVES are given in the last column of Table 2. The agreement between the X-shooter and UVES values is pretty good, the highest deviation being 0.19 dex for which is affected by saturation effects undetected in the X-shooter spectrum. The UVES-derived value could also be underestimated since saturation of Si ii1808 is also visible at high resolution. For other species (except S ii which is also likely saturated), the better defined continuum in the X-shooter spectrum and the availability of several lines (e.g. Mg i2852, Fe ii2249,2260, not covered by UVES) may compensate the lower spectral resolution. Therefore, while medium spectral resolution may generally lead to an underestimation of the column densities, here, X-shooter provides rather accurate values. Mg ii lines are heavily saturated with a very large equivalent width ( Å), making the system eligible as Ultra-Strong Mg ii system (USMg ii; Nestor et al., 2007).
The overall DLA metallicity is found to be [Zn/H] , which is typical of the overall population of DLAs (Prochaska & Wolfe, 2002). Interestingly, the zinc and hydrogen column densities measured here place the DLA close to the observational limit proposed by Prantzos & Boissier (2000) beyond which the quasar would be too attenuated to be observable (see also Boissé et al., 1998; Vladilo & Péroux, 2005).
 |
 |
 |
 |
 |
 |
 |
 |
 |
 |
 |
 |
 |
 |
 |
 |
 |
 |
 |
 |
 |
 |
 |
 |
 |
 |
| Species | ()a𝑎aa𝑎aQuoted errors are rms errors from fitting the Voigt profiles. | ||||||
|---|---|---|---|---|---|---|---|
| X-shooter | X-shooter | UVES | |||||
| =2.2059 | =2.2063 | =2.2068 | =2.2073 | =2.2077 | Total | Total | |
| Mg0 | 11.790.06 | 12.490.01 | 12.810.01 | 12.870.04 | 12.210.04 | 13.280.02 | 13.220.19 |
| Si+ | 15.680.04 | 15.730.05 | 15.740.03 | 15.760.03 | 14.480.17 | 16.340.02b𝑏bb𝑏bThese values are likely underestimated due to saturation effects. | 16.530.04b𝑏bb𝑏bThese values are likely underestimated due to saturation effects. |
| S+ | 15.350.10 | 15.180.14 | 15.820.12 | 15.700.16 | 16.190.08b𝑏bb𝑏bThese values are likely underestimated due to saturation effects. | ||
| Cr+ | 13.420.04 | 13.540.03 | 13.480.02 | 13.610.02 | 12.650.11 | 14.130.01 | 14.140.01 |
| Mn+ | 12.770.04 | 12.920.03 | 13.010.01 | 13.120.02 | 12.580.05 | 13.620.01 | |
| Fe+ | 14.980.04 | 15.230.02 | 15.120.01 | 15.220.01 | 14.290.09 | 15.760.01 | 15.840.03 |
| Ni+ | 13.830.05 | 14.010.04 | 13.940.03 | 14.060.03 | 13.110.16 | 14.590.02 | 14.590.05 |
| Zn+ | 12.710.04 | 12.770.04 | 13.020.02 | 13.090.02 | 12.080.12 | 13.540.01 | 13.600.01 |
The presence of dust can be inferred from the depletion factors of iron, manganese, nickel and chromium compared to zinc: [Zn/Fe] , [Zn/Cr] , [Zn/Mn] and [Zn/Ni] . These values are marginally higher than the typical values found in DLAs (see e.g. Noterdaeme et al., 2008) and in-between the values found in warm neutral gas in the Galactic disk and the Halo (Welty et al., 1999). Similar depletion pattern have been observed along gas-rich lines of sight in the SMC (Welty et al., 2001). Interestingly, this depletion pattern is also very similar to that found in the strong DLAs at towards HE 00271836 (Noterdaeme et al., 2007) and at towards SDSS J081634144612 (Guimarães et al., submitted), both of which have very large H i column densities ( and 22.0, respectively). Excess of UV flux from local star formation activity was inferred in the case of HE 00271836 from the excitation of H2 lines. SDSS J081634144612 is also an H2-bearing DLA. Unfortunately, in the case of J11350010, H2 lines fall bluewards of the Lyman-break from a Lyman-limit system at . In addition, CO lines are not detected.
3.3 Dust reddening
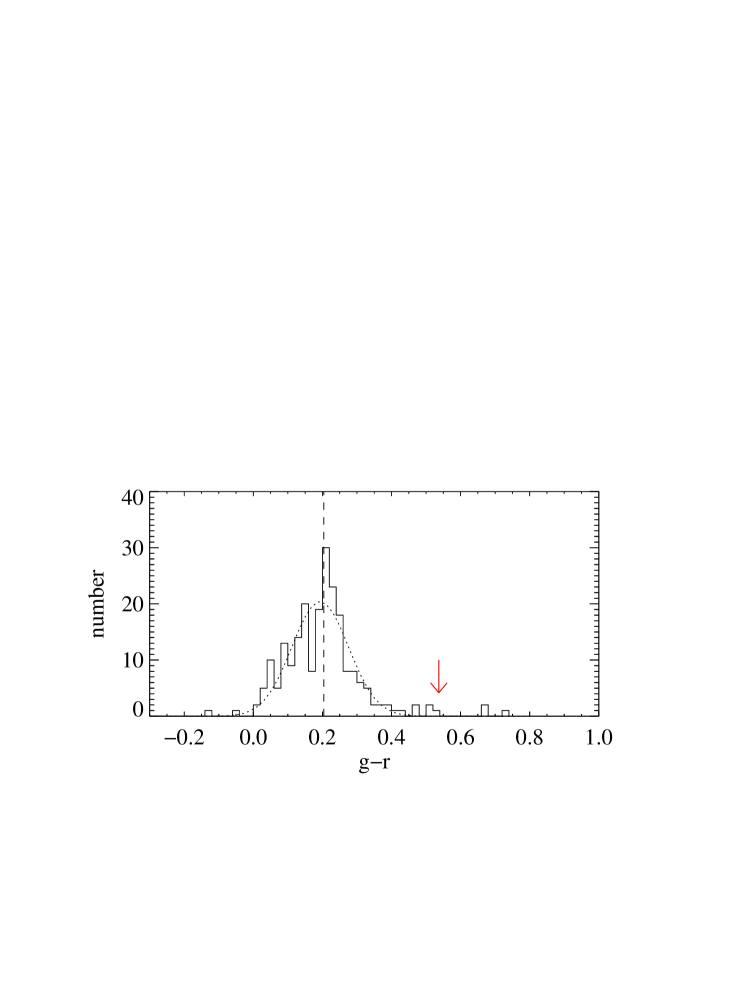
Having established that some dust is present in the system –with a relative abundance quantified by the depletion factor– we can now study the integrated effect of this dust along the line of sight. The median colour for a control sample of 222 non-BAL QSOs with and similar redshift (within around ) is with a dispersion of 0.08 mag (see Fig. 5). J11350010 is among the 2% redder QSOs with . This means that the significance of J11350010 being redder than the average is between 2.4 (face value, assuming the red tail of the colour distribution is only due to intrinsic spectral shape variation) and 4.2 (considering the dispersion of 0.08 mag around the median value, i.e. that other QSOs in the red tail are also reddened by intervening systems333Note that errors from the SDSS photometric calibrations are less than 0.02 mag.).
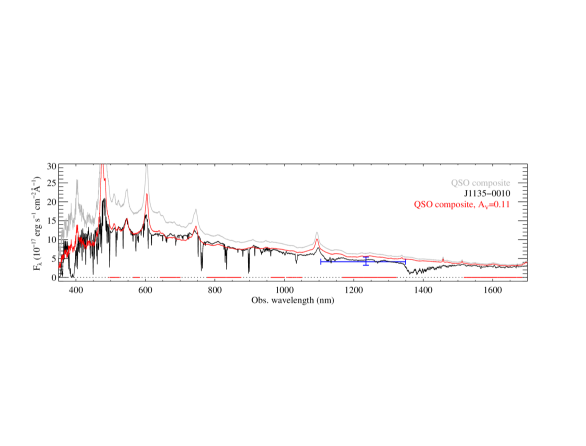
We can also measure the reddening of the QSO light by the intervening DLA following the technique described in Srianand et al. (2008) and Noterdaeme et al. (2010a): The observed X-shooter spectrum is reasonably well matched with a QSO composite (Telfer et al., 2002), reddened by an SMC extinction law (Gordon et al., 2003) with A mag or . This is higher than the mean value for the overall DLA population (Frank & Péroux, 2010; Khare et al., 2011). However, because of the large column density, the extinction-to-gas ratio mag cm2 is lower than the mean value for DLAs ( mag cm2; Vladilo et al., 2008) whereas the depletion factors are only slightly above typical DLA values. This could be the consequence of a non-uniform distribution of dust in the H i gas. It seems that in the present system, the relative abundance of dust is quite typical of the overall DLA population (i.e. low), but its large column density produces a detectable reddening of the background QSO.
Similarly, the quasar Q 09181636 is reddened by a foreground DLA galaxy (Fynbo et al., 2011). In that case molecular hydrogen is detected –a clear indication for the presence of dust (Ledoux et al., 2003; Noterdaeme et al., 2008). These examples of dust attenuation of the background quasar reinforce the view that optically-selected QSO samples may be biased against lines of sight passing through the inner (gas-, molecular- and metal-rich) regions of foreground galaxies (e.g. Noterdaeme et al. 2009a, 2010a).
4 Properties of the DLA galaxy
4.1 Impact parameter and star formation rate
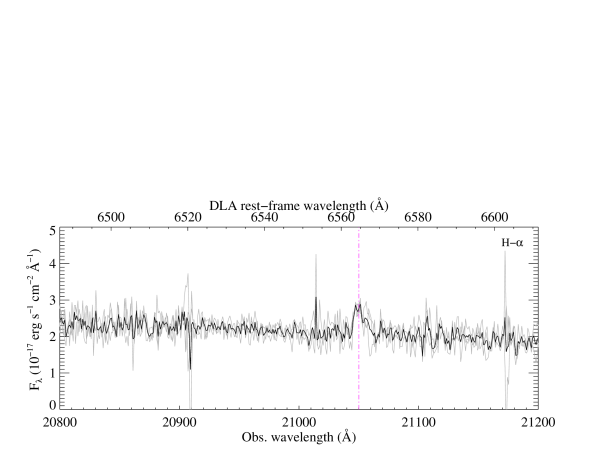
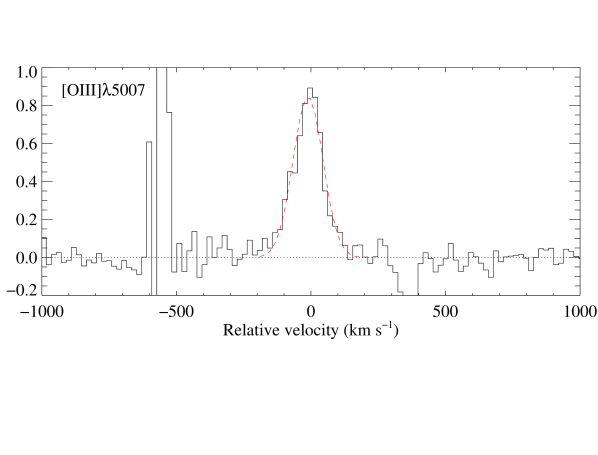
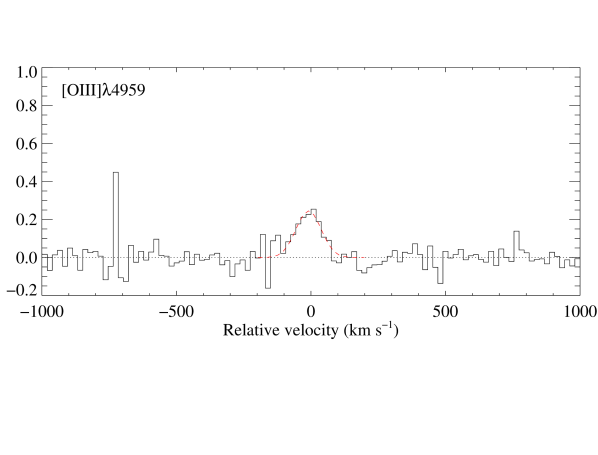
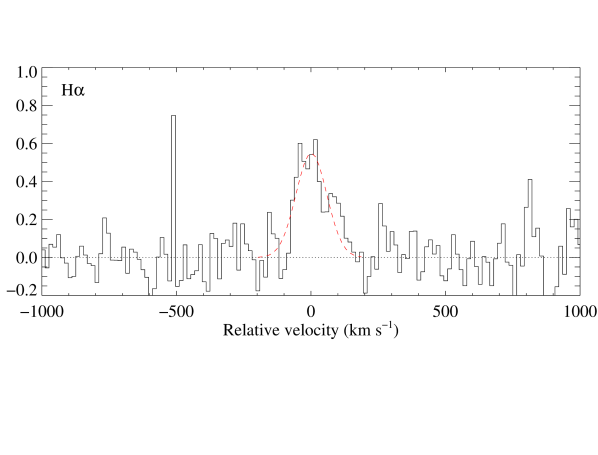
In addition to the double-peaked Ly emission (see Figs. 1 and 2), we detect [O iii]4959,5007 (Fig. 7) and H- (Fig. 8) at the three position angles. Unfortunately, because the H- line falls on a sky emission line, we could not measure its strength. The [O ii]3727 doublet is not detected but a stringent upper limit on the corresponding flux can be derived from the data (see Table 3).
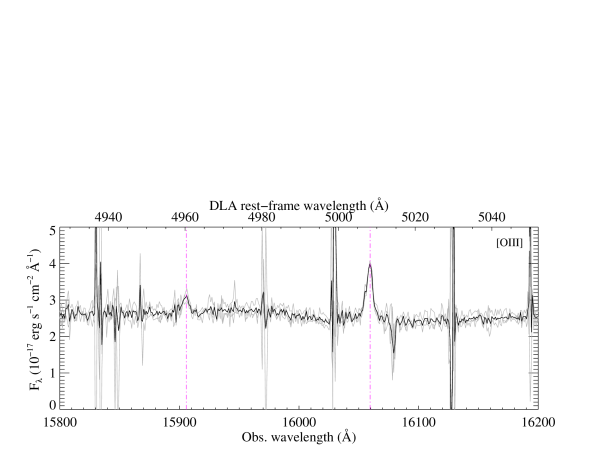
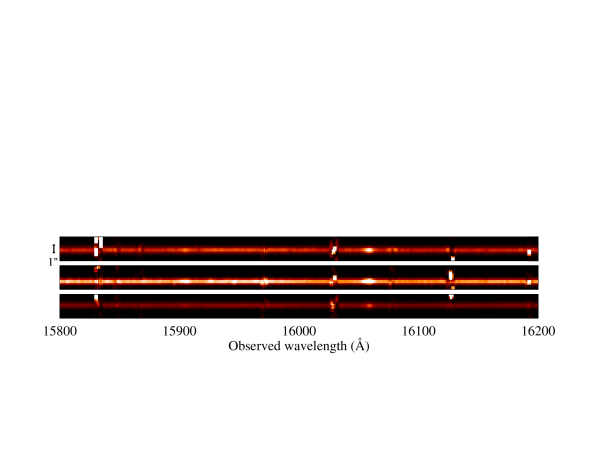
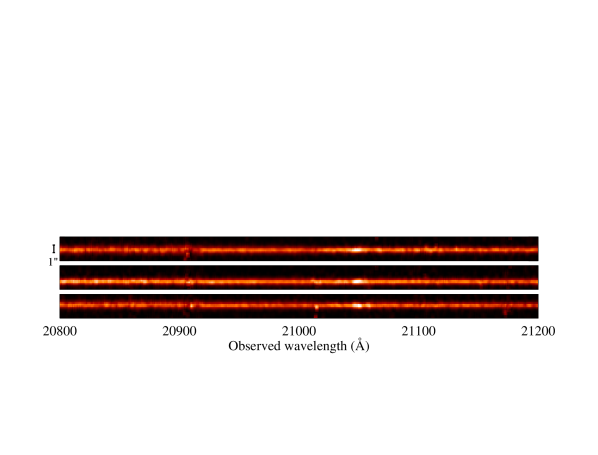
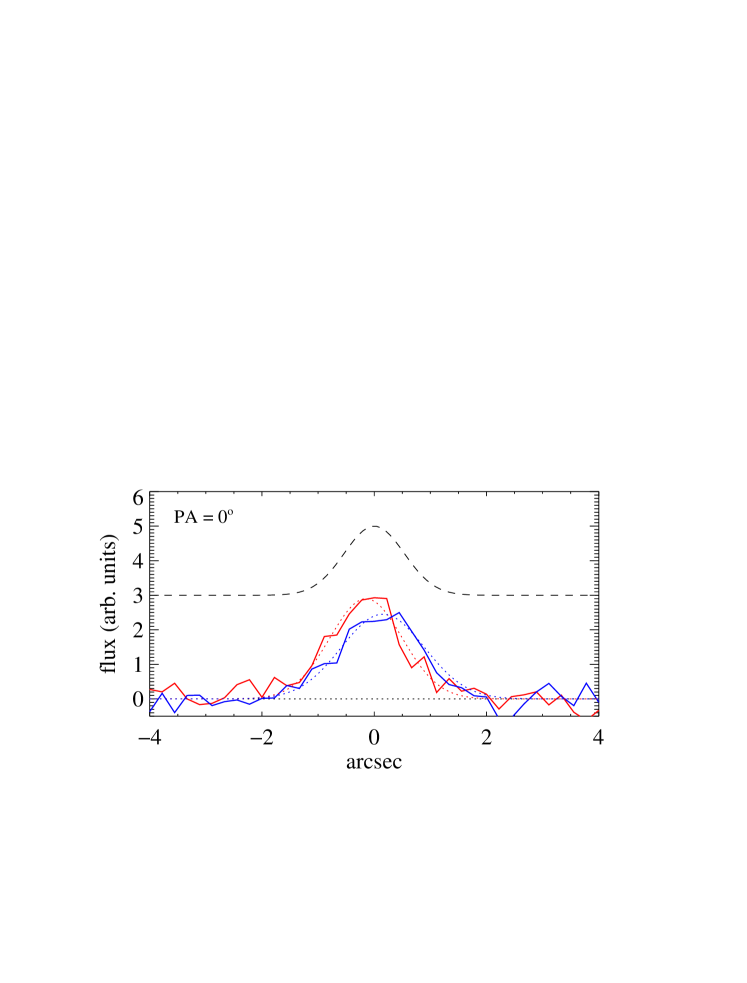
By triangulating the position of the [O iii]5007 emission with respect to that of the QSO trace (as done by Møller et al. 2004 and Fynbo et al. 2010), we measure precisely the impact parameter between the QSO and the galaxy (see Fig. 9). We note that while only two slit angles would suffice to determine the position of the galaxy emission, the use of three different position angles nicely confirms the location, in spite of the impact parameter being much smaller than the seeing. The small impact parameter (, corresponding to 0.9 kpc at ) explains the almost equal emission line strengths measured at different PA (hence no differential slit losses) and the absence of detectable velocity shift between [O iii] emission line measurements at different PAs (that would result from different locations with respect to the slit axis). Finally, the spatial extent of the [O iii] emission equals that of the QSO trace within errors for PA=0 and 60°, and is marginally larger than the QSO trace for PA=°. This indicates that the [O iii] emission is compact, with some spatial elongation of arcsec in the ° direction. The H emission is also spatially unresolved and consistent with arcsec. From the unresolved (or only barely resolved) [O iii] and H emission, the very small impact parameter and the good seeing (see Fig. 9), it is also clear that slit losses are negligible.
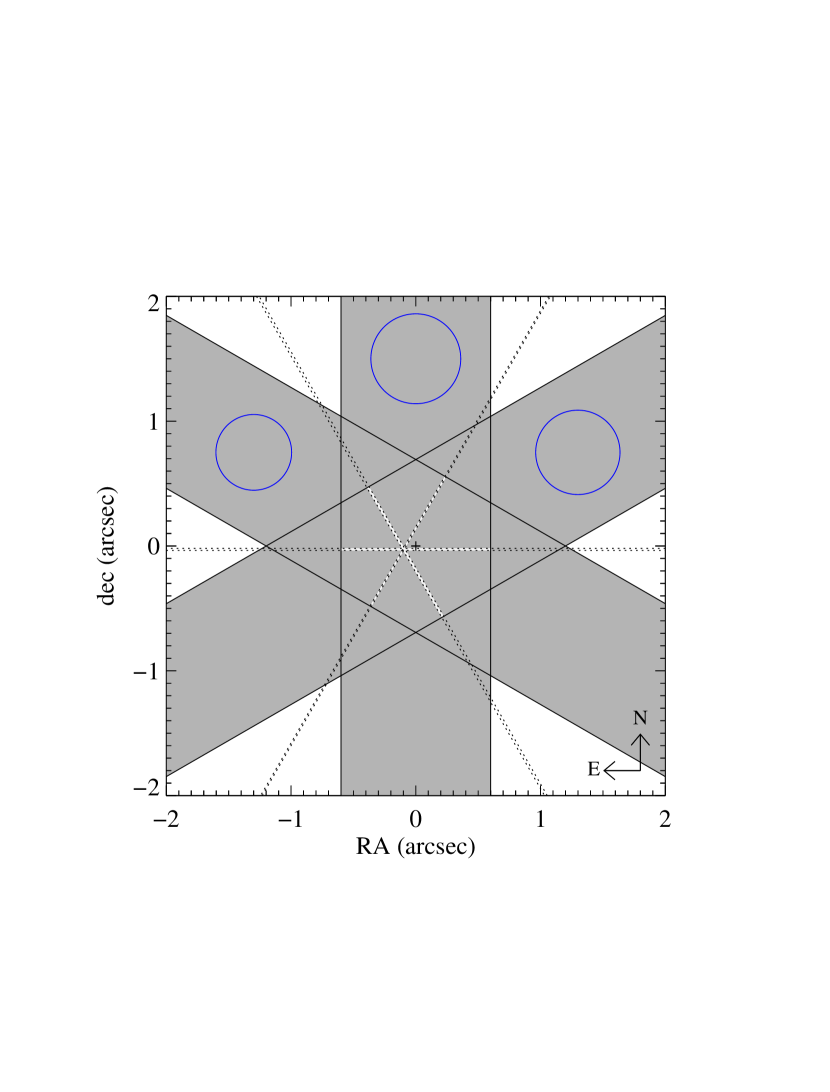
Table 3 presents the line fluxes measurements. From the luminosity of the H line, we derive a significant star formation rate of about 25 M⊙ yr-1 (uncorrected for dust), adopting the SFR-luminosity calibration from Kennicutt (1998).
Because the most sensitive key emission line diagnostics (e.g. ; [N ii]/H ) cannot be used here, there is some degeneracy between the measurement of the ionisation parameter and the metallicity of the emitting region. However, the strict lower limit on the [O iii] to [O ii] ratio indicates a high ionisation parameter cm s-1 (fig. 5 of Kobulnicky & Kewley, 2004) and the low H to [O iii] ratio therefore indicates a metallicity in the range (see fig. 9 of Weatherley et al., 2005). The metallicity in the absorbing gas is found at the low end of this range, but the impact parameter is too small to interpret this as a gradient (see e.g. Péroux et al., 2011). We note however that the two metallicities do not apply to the same phase (ionised versus neutral) and that H i gas arise in several clouds, some of which (possibly infalling) are likely to have a metallicity smaller than in the star-forming region. Interestingly, the high -value agrees well with the typical value for LBGs (e.g. Pettini et al., 2001) and active compact starburst galaxies (Martin, 1997). The high excitation of [O ii] places indeed the DLA galaxy in a region of the [O iii]/[O ii] vs [N ii]/[O ii] diagram mostly populated by blue compact galaxies, metal poor galaxies and GRB host galaxies (fig. 5 of Levesque et al., 2010).
| Line | Flux | Luminosity | Derived |
|---|---|---|---|
| ( erg/s/cm2) | ( erg/s) | quantities | |
| Ly | 14.30.5 | 5.60.2 | (a)𝑎(a)(a)𝑎(a)footnotemark: |
| 3727 | (3 ) | ||
| 4959 | 3.00.7 | 1.20.3 | |
| 5007 | 12.30.9 | 4.80.4 | (cm s-1) |
| H | 8.22.1 | 3.20.8 | SFR (M⊙ yr-1) = 256(b)𝑏(b)(b)𝑏(b)footnotemark: |
4.2 The double-peaked Ly emission
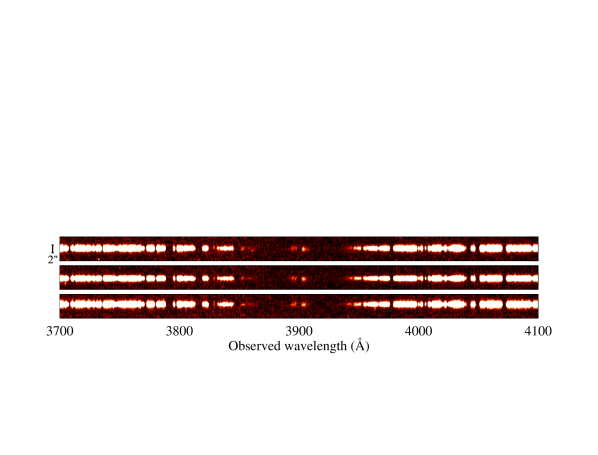
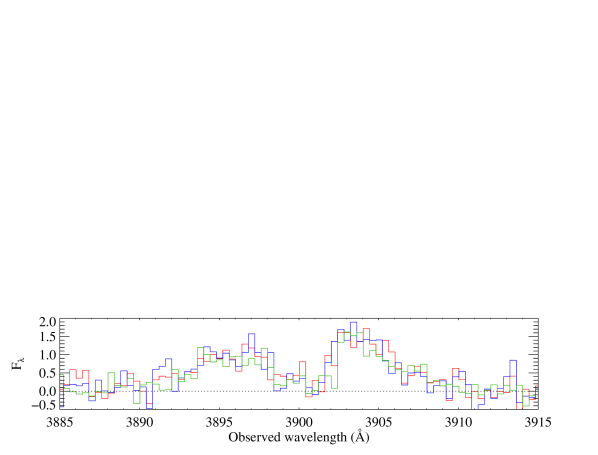
The Ly emission is characterised by an almost-symmetric double-peak profile which is detected in the DLA trough in each UVB spectrum (all three position angles, see Fig. 2). Several physical processes can produce Ly radiation at comparable levels: i) star formation activity, ii) Lyman- fluorescence induced by the UV background or the QSO (Spitzer, 1978), iii) cooling radiation (e.g. Dijkstra et al., 2006b) due to the release of part of the gravitational energy from infalling gas into Ly radiation (this is more likely to take place if the galaxy is massive). When only Ly is detected, it is not straightforward to identify the astrophysical origin of the emission (see discussion in Rauch et al., 2008). Here, since we detect other lines –from which we derive a high star formation rate– most Ly photons seemingly originate from star formation activity.
The velocity spread of the Ly line is much larger than that of H and [O iii] (Fig. 10). This can be understood as the natural consequence of radiative transfer through optically thick H i medium (e.g. Zheng & Miralda-Escudé, 2002; Dijkstra et al., 2006a): because Ly photons need to scatter out of the line centre in order to escape their emission region, we can expect an extended double-peaked profile. However, in practice, the resulting profile is a complex convolution of the input spectrum, the velocity and density fields as well as the turbulent and thermal motions. Qualitatively, in case of an homogeneous, isotropic expanding shell around the source, the blue peak is severely diminished because Ly photons with higher frequencies are seen in the resonant frequency by the outflowing gas in the observer’s direction. Ly photons can nevertheless escape being redshifted by back-scattering, producing a red peak. This is probably the case for the Ly emission associated to the DLA towards Q 22220946 (Fynbo et al., 2010). Conversely, the red peak is diminished in case of infalling gas.
Here, the double-peaked profile could be more representative of a quasi-static medium around the emitting source (Verhamme et al., 2006). However, in this scenario, we would expect that Ly photons with different frequencies are seen coming from the same projected region, i.e. that the spatial locations of the red and blue peaks coincide. We will see further (Sect. 4.3) that this is not the case. Another possibility is the presence of scattering gas with high velocities in an anisotropic configuration. This can be the case for collimated winds or streams of infalling gas. Considering the spectral shape of Ly emission in a sample of high- UV-selected star-forming galaxies (with properties very similar to that studied here), Kulas et al. (2012) also conclude that the Ly emission reveals complex velocity structures that cannot be reproduced with simple shell models. It is therefore important to study the kinematics of the emitting and scattering regions in order to understand the shape of the Ly profile as well as its spatial and velocity spread.
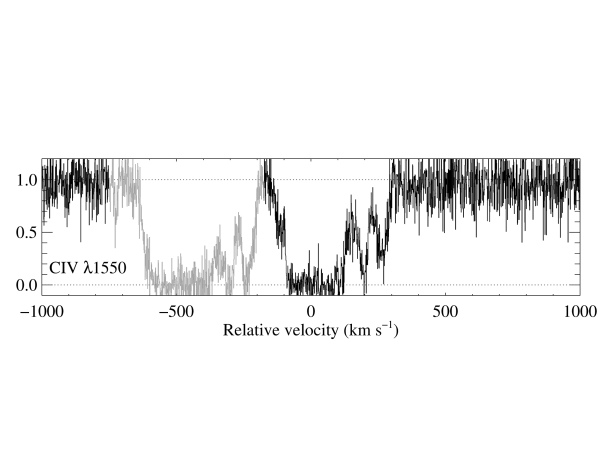
The velocity dispersion of the emitting galaxy can be inferred from the spectral width of the [O iii] and H emission lines555These lines are resolved at the spectral resolution of about 40 in the NIR. and is about FWHM120 . This provides an estimate of the projected rotational/dispersion velocity of the galaxy, though we note that turbulent motion in the star formation region can contribute to the width of the line. Nevertheless, the measured [O iii] velocity width is also consistent with the velocity spread of metal absorption lines (see Fig. 10). Using X-ray data, Martin (1999) have estimated that gas will escape through starburst-driven galactic winds from galaxies with . The velocity measured here would therefore favour a wind scenario. In that case, as discussed above, the outflowing gas must be ejected anisotropically to preserve the blue and red peaks. Interestingly, from the UVES spectrum, two C iv components are seen detached from the main profile at . These detached high-ionisation components likely arise from outflowing gas (see e.g. Fox et al., 2007a, b).
Another observational constraint comes from the Ly escape fraction. From the Ly/H ratio, we observe , considering case B recombination theory (Brocklehurst, 1971). Such a high escape fraction is intriguing given the high H i-column density measured close to the star-forming region. This suggests that Ly photons escape efficiently along particular directions with low column densities (e.g. Tenorio-Tagle et al., 1999; Mas-Hesse et al., 2003), high velocity gradients (Kunth et al., 1998; Östlin et al., 2009; Atek et al., 2008) and/or bounce off of the surface of dense clouds in a clumpy medium (e.g. Neufeld, 1991; Atek et al., 2009). Finally, we note that absorption by the intergalactic medium (IGM) could in principle still affect the blue peak of the Ly emission. However, Laursen et al. (2011) showed that the consequences of intergalactic Ly transmission are important only for , where the Ly forest is denser.

4.3 Spatial configuration and mass
In Fig. 11, we compare the location and extension of the Ly emission along the slit with the spectral PSF, obtained from fitting the QSO trace in the same wavelength region. We measure the positions of the blue and red peaks along each slit (for each PA) by fitting Gaussian profiles to the corresponding Ly emissions. The triangulation strongly constrains the location of the centroid of the red and blue emitting regions (see Fig. 12). As for [O iii], the three constraints from the different PAs intersect well in a single small region. Interestingly, the centroid of the blue and red emissions do not coincide and are found on each side of the location of the [O iii] emission.
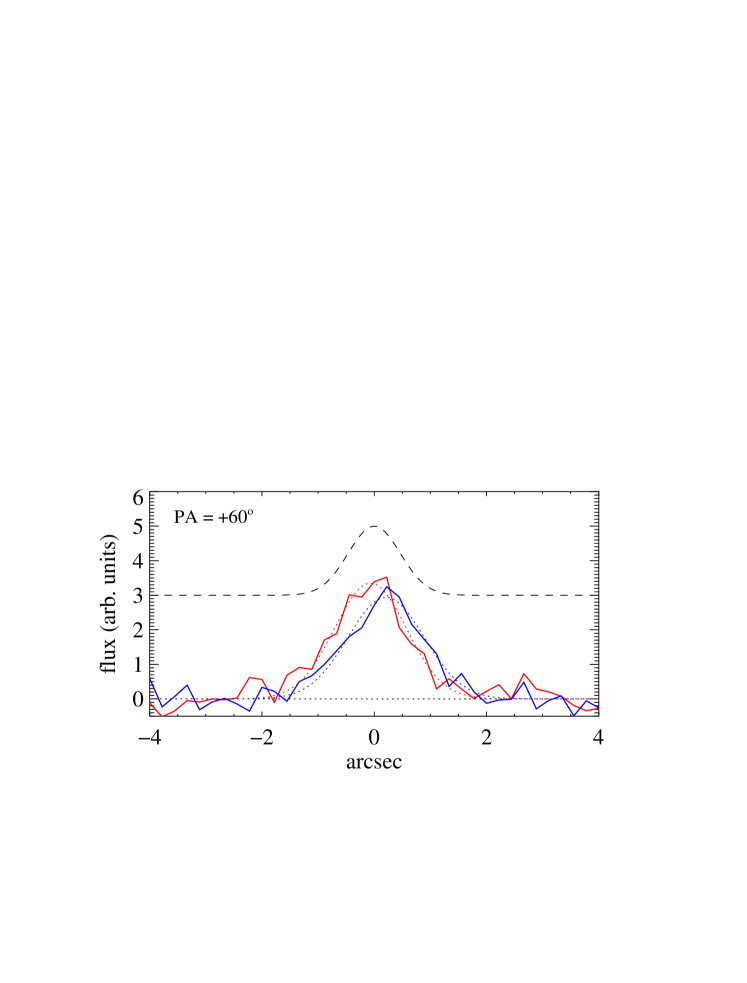
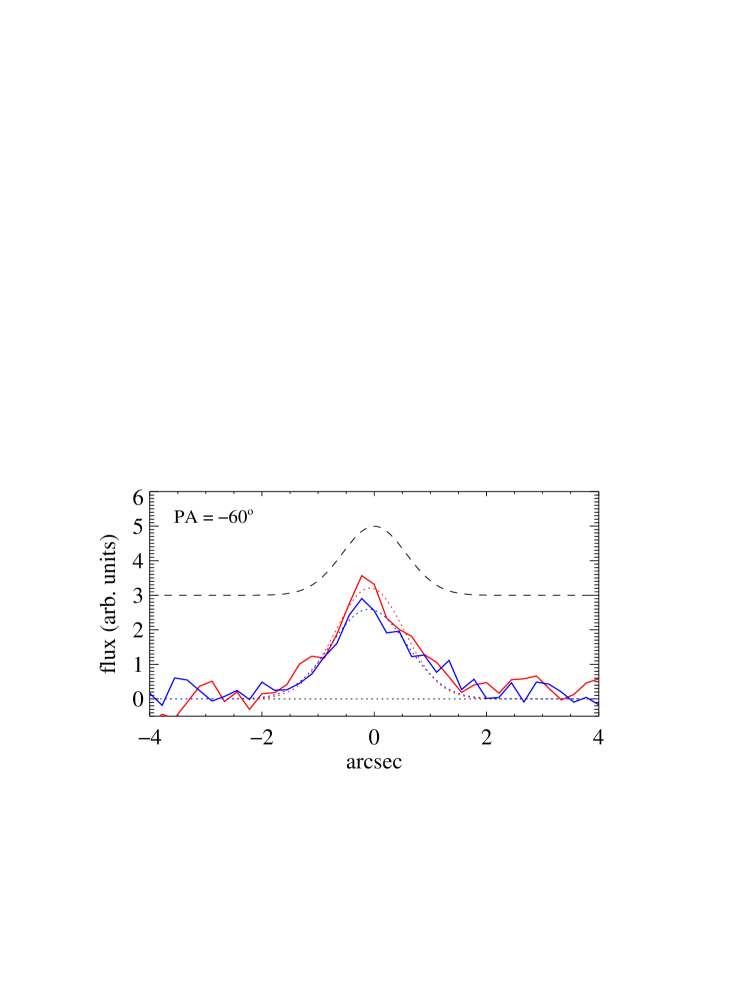
From Fig. 11 it is also clear that the Ly emission is wider than the seeing. While the observed spatial profile is the convolution of the spectral PSF and the actual brightness profile, we found that this can be well reproduced by a simple Gaussian model. We then deconvolved the observed profile and obtained the spatial extend of the emission for each PA. The results are shown in Fig. 12 as dotted polygons which are the intersection of the FWHMs along each PA. These regions where Ly photons are detected are then well fitted by ellipses.
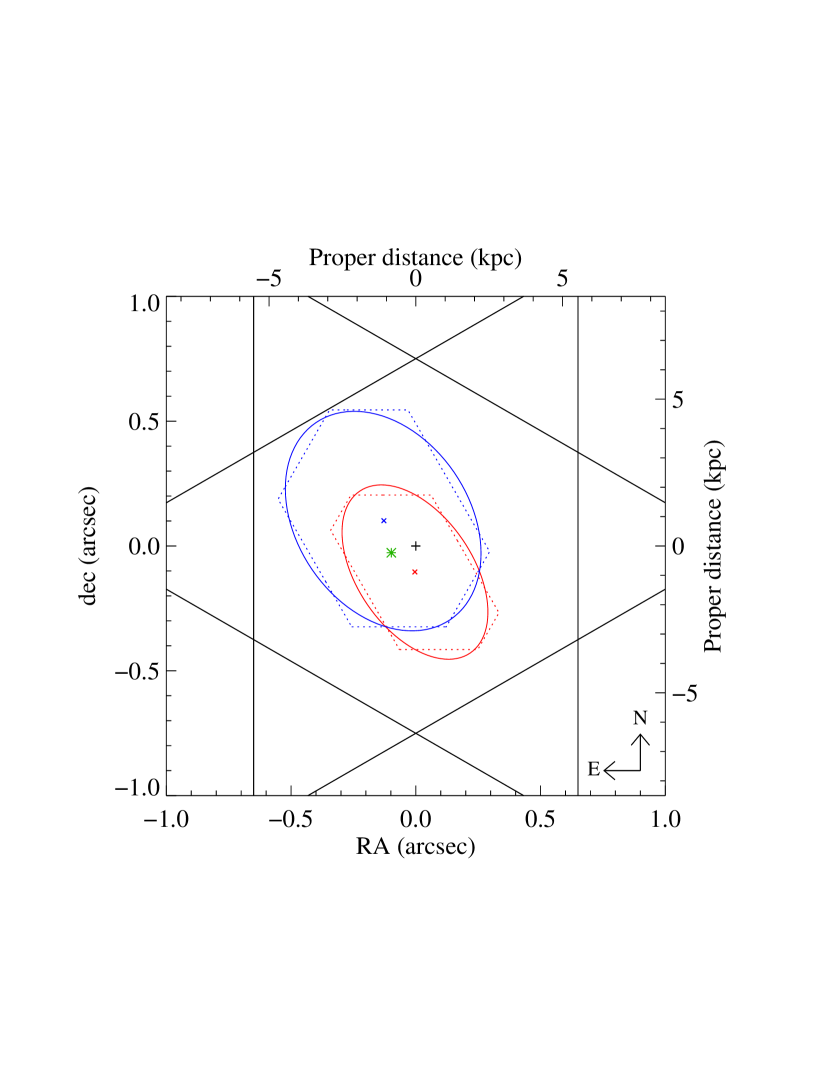
The observed configuration can be explained if the QSO line of sight passes through the inner gas-rich parts (possibly disc) of a compact galaxy with a radius of the order of kpc (as constrained by the spatial extent of the [O iii] emission). The expansion of a starburst-driven super-bubble is quickly stopped in the dense gas region, and naturally shape bipolar outflows (e.g. Veilleux et al., 2005, and references therein). Ly photons arising from the vigorous star formation region escape preferentially in the wind directions where the column densities are lower (Heckman et al., 2001) and scatter off collimated outflowing gas (with velocities of the order of at least several 100 , as inferred from the detached C iv absorption components). This would produce the two distinct observed Ly emission regions. We will test this picture in Sect. 5.
Considering a DLA galaxy half-light radius of a few kpc (see Sect. 4.1), the velocity dispersion (measured in Sect. 4.2) provides us with a rough estimate of the virial mass of the galaxy to be of order of 1010 M⊙, similar to that of the SMC (e.g. Bekki & Stanimirović, 2009). The DLA studied here seems therefore to arise from an intermediate mass galaxy. The mass of neutral gas within the galaxy radius can also be estimated –at best at the order of magnitude level– to be a few M⊙ (considering a uniform column density over a projected region of a few kpc2). Simulations have revealed the existence of an anti-correlation between the mass of the galaxy and the escape fraction (see e.g. Fig. 9 of Laursen et al., 2009b). According to these simulations, the low virial mass of the DLA galaxy here is well consistent with the large Ly escape fraction. Finally, the high star formation rate and the low virial mass are favourable to starburst-driven outflowing winds (e.g. Samui et al., 2008).
There are evidences that strong Mg ii systems are associated to star-forming galaxies at intermediate redshifts. For example, the correlation between the [O ii] luminosity and the Mg ii equivalent width (Noterdaeme et al., 2010b) indicates that stronger Mg ii systems are found closer to their host galaxy. While this correlation does not necessarily imply the presence of winds (see López & Chen, 2012), Nestor et al. (2011) observed an association between the most extreme absorbers and starburst galaxies. These authors further showed that galactic outflows are necessary to account for their large velocity spread. Therefore, the extremely large Mg ii equivalent equivalent width measured here could further support an association with a starburst galaxy. This is also in agreement with the suggestion by Bouché et al. (2011) that strong Mg ii absorbers could trace star formation-driven winds in low-mass haloes (). Indeed, the Mg ii profile is spread beyond the bulk of low-ionisation metals and, as seen for C iv, presents detached components that likely arise from the low column density outflowing gas (see Fig. 10).
4.4 Stellar continuum
We can obtain further information on the nature of the DLA galaxy by constraining its stellar UV continuum at the bottom of saturated Ly lines at . These lines arise from IGM clouds that are located behind the galaxy and therefore completely absorb the quasar flux but not that of the galaxy. Conversely, saturated Ly lines at absorb in turn photons from both the QSO and the galaxy at the corresponding wavelength. In order to check the accuracy of the sky subtraction, we measured the mean residual zero-flux level at the bottom of a saturated line at Å (i.e. at ) to be erg s-1 cm-2 Å-1.
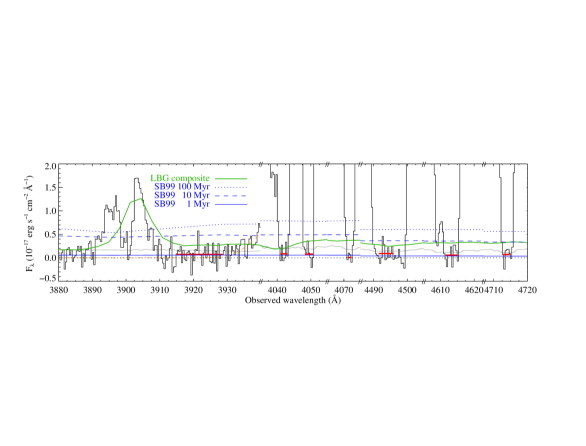
In Fig. 13, we plot portions of the X-shooter spectrum around saturated Ly lines at (including the red side of the DLA line as in Møller et al. 2004). While the UVES spectrum is far too noisy666The error level is around 4.510-17 erg s-1 cm-2 Å-1. to detect the Ly emission –and a fortiori the continuum–, we used its higher spectral resolution to confirm that the lines are truly saturated and not blends of lines. In the figure, we compare the X-shooter line-flux residuals with the LBG composite spectrum from Kornei et al. (2010) scaled to match the observed Lyman- flux. The observed continuum flux is lower than what is expected from a typical Lyman-break galaxy with the same Ly flux, or equivalently, the Ly equivalent width is larger in the DLA galaxy than in the LBG composite. This could indicate that the DLA galaxy has a more recent stellar population than typical LBGs, as expected in the case of a young starburst galaxy. If the star formation is recent in the DLA galaxy, we can expect that it has not yet reached the plateau in the luminosity at Å (with contribution from both massive and intermediate-mass stars) but that it has a higher relative flux further in the UV (mostly from massive-stars), which triggers the H line.
Using starburst99 (Leitherer et al., 1999), we estimate that the stellar UV luminosity of the galaxy would reach about erg s-1 Å-1 at 1500 Å for a Salpeter IMF, a metallicity (close to what is observed both in the emitting and absorbing gas) and the H -derived SFR of 25 M⊙ yr-1 in about 100 Myr. This conclusion is little dependent on the adopted IMF and exact value of the metallicity. The UV luminosity plateau is much higher than what is observed, indicating that the star formation in the galaxy is very recent. The predicted spectrum at yrs is still significantly higher than the observed spectrum while models at yrs predict a flux below the observed one (see Fig. 13). We recall however that we cannot correct for dust extinction because the H line is not available, meaning that models can overpredict the observed flux for a given age. Since the Ly escape fraction is large, the metallicities are low and the amount of dust along the QSO line of sight (i.e., very close to the star-forming region) is small, we can assume that the effect of dust on the UV continuum is probably not very large. The mean flux in the saturated lines is 111.1 erg s-1 cm-2 Å-1, while the systematic error due to sky subtraction is probably much lower than that estimated above (from a single line in a bluer region of the spectrum). This means that we likely detect the galaxy continuum, as can also be seen directly from Fig. 13 where the red segments are systematically above zero (dotted line). This exercise therefore gives us a rough estimate of the age of the star-forming activity. Even allowing for a factor of 5 underestimate of the UV luminosity (due to dust extinction and uncertainties in the sky subtraction), we find that the star formation has been triggered yrs before the rest-frame time of the observation, with a enhanced population of massive stars. This age is typical of what is seen in Ly -selected LAEs at high redshift (e.g. Pirzkal et al., 2007; Gawiser et al., 2007; Lai et al., 2008; Finkelstein et al., 2009).
5 Modelling the galaxy counterpart
Unlike non-resonant lines like H , the Ly line is not readily fitted by, e.g., a Gaussian. Many processes dictate the shape of the line, and as discussed in Sect. 4.2, analytical fits are only available for the very simplest models, such as a spherical, homogeneous, isothermal, dustless, static blobs of gas (Dijkstra et al., 2006a). We must turn to numerical simulations to build more realistic models. Resonant scattering being stochastic in nature, so-called Monte Carlo simulations are an obvious choice, where the journey of individual photons are traced as they scatter their way out of a simulated or modelled galaxy (e.g. Zheng & Miralda-Escudé, 2002; Tasitsiomi, 2006; Verhamme et al., 2006; Laursen & Sommer-Larsen, 2007).
To this end, we apply the Ly radiative transfer code MoCaLaTA (Laursen et al., 2009a), including the effects of dust (Laursen et al., 2009b), to a semi-realistic model galaxy. As discussed in Sect. 4.2, Ly photons escaping from an expanding agglomeration of gas tend to diffuse in frequency to the red side of the line centre. Conversely, for collapsing gas the photons escape more easily after having diffused to the blue side (see e.g. Dijkstra et al., 2006a). Both scenarios are met in astrophysical contexts, although by far most observed Ly lines are characterised by an asymmetric red wing (e.g. Venemans et al., 2005; Nilsson et al., 2007; Tapken et al., 2007; Grove et al., 2009).
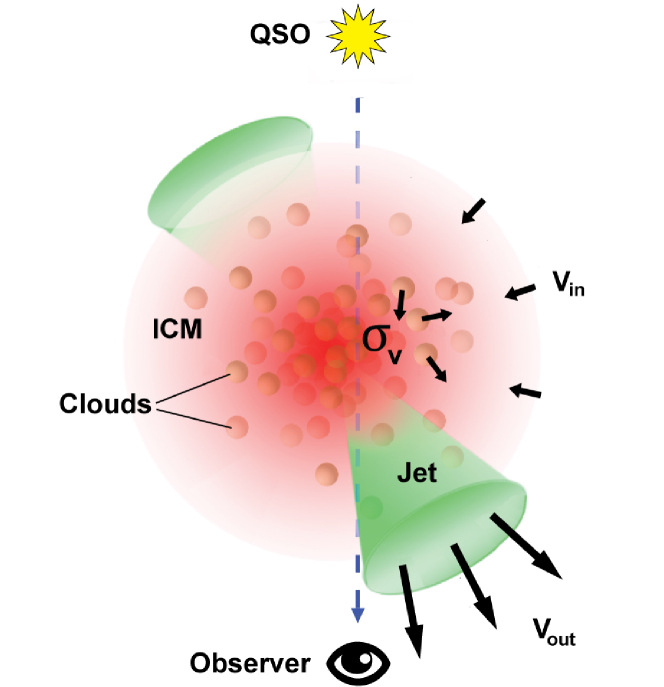
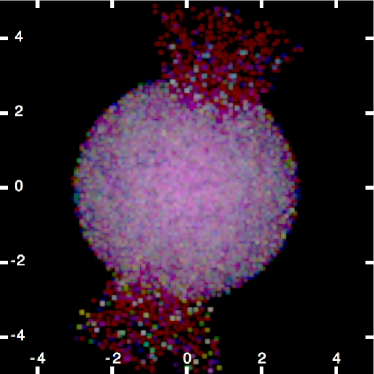
Here, we interpret the spatial separation of the blue and the red part of the spectrum found in Sect. 4.3 as being caused by a smooth, overall cold gas accretion, with a high, chiefly central star formation giving rise to two jets of outflowing gas. The galaxy is hence modelled as a sphere of gas existing in two phases; warm, spherical neutral clouds of high gas and dust density, dispersed in a hotter and more tenuous inter-cloud medium (ICM). Both the gas density of the ICM and the number density of clouds decrease exponentially from the centre. Two jets of higher ionisation fraction are assumed to expel gas at high velocities (as seen from the detached C iv components, see Fig. 10) from near the centre and outward in opposite directions, while the rest of the galaxy is characterised by a net small overall infall of gas. We assume that there are no neutral clouds inside the jets. The model is illustrated in Fig. 14.
A model galaxy is constructed on a grid of cells, each cell being characterised by the following parameters: neutral hydrogen density , dust density , gas temperature , and three-dimensional bulk velocity . The parameters are uniform within a given cell. In essence, a large number of Ly radiative transfer (RT) calculations are conducted, and the favoured model is then the one that at the same time reproduces reasonably well not only the observed spectrum, but also the other observables we have at hand: i) a SFR of yr-1, ii) a Ly escape fraction of , iii) the location of blue and red photons on the sky seen in Figs. 11 and 12 with respect to the galactic centre given by the [O iii] emission, iv) a large H i column density and colour excess through the whole system at the sightline toward the quasar, and v) a few ( 8) clouds intercepted by the QSO line of sight, spanning a velocity range , as inferred from the metal absorption lines (Fig. 4).
Many observational constraints we have on the physical parameters of the galaxy allow us to make a qualified estimate of some of the input parameters of the model:
The inferred metallicity of [Zn/H] , together with the depletion ratios from Sect. 3.2, give us an idea about the amount of dust. Assuming again an SMC extinction law, and scaling the extinction in each cell to the appropriate metallicity, provides .
The dust is assumed to scale also with , i.e. with a reduced density in the intercloud medium (ICM). In this picture, dust is destroyed in regions where hydrogen is ionised. Furthermore, the jet is assumed to be devoid of dust. Note, however, that since the largest part of the photons’ journey takes place inside the high density clouds, the presence of dust outside the clouds does not have a strong impact on the RT.
Distributing the total H i column density to several clumps implies an average cloud column density of the order of a few . This provides a relation between cloud size and neutral hydrogen density inside the clouds (e.g. for a few cm-3, the clouds should be a few hundred parsec across). The extent of the [O iii] emission (of the order of 3 kpc, see Sect. 4.1) constrains the physical size of the system.
The rest of the variables are estimated from known typical values. To find the best-fitting model, in principle an -dimensional grid of the different parameters controlling the RT could be constructed, running the RT calculations for every model, and finding the best one through minimisation. This approach has already been followed, albeit for an outflowing shell model of four parameters only. Verhamme et al. (2008) and Schaerer et al. (2011) fitted observed Ly profiles by modelling the galaxies as a thin shell characterised by a column density of homogeneously mixed gas and dust with some temperature and expansion velocity. In our model, however, a much higher number of parameters may be varied, and searching a parameter space this big is not feasible. Furthermore, as made clear above we aim not only the fit the spectrum, but to reproduce several observables. Consequently, instead, in practice we run a large number of RT calculations with different initial conditions, inspect the results visually, change slightly one or a few parameters which from experience are believed to be the appropriate ones before running a new series, until a satisfactory set of results are obtained.
5.1 Results from modelling
The values used for the preferred model are given in Table 4. With such a large number of parameters, of which many are to a large extent degenerate, we have no aspirations of matching perfectly all of the mentioned observed quantities. Nevertheless, it is striking that a relatively simple model manages to give meaningful results.
| Parameter | Value |
|---|---|
| Box size | 10 kpc |
| Galaxy radius | 3 kpc |
| Number of clouds | 4000 |
| Cloud radii | 150 pc |
| Cloud temperature | K |
| Cloud densitya𝑎aa𝑎aEscape fraction assuming case B recombination, i.e. Ly-H-. | 5 cm-3 |
| Cloud/ICM metallicity | 0.08 Z⊙ |
| Cloud velocity dispersion | 60 |
| Overall infall velocity | 60 |
| Central ICM densitya𝑎aa𝑎aAll densities refer to neutral hydrogen only. | cm-3 |
| ICM densitya𝑎aa𝑎aAll densities refer to neutral hydrogen only. scale length | 2 kpc |
| ICM temperature | K |
| Jet inner radiusc𝑐cc𝑐cThe gas accelerates from 0 km s-1 to the terminal velocity going from the inner to the outer radius of the jet. | 0.5 kpc |
| Jet outer radiusc𝑐cc𝑐cThe gas accelerates from 0 km s-1 to the terminal velocity going from the inner to the outer radius of the jet. | 5 kpc |
| Jet terminalc𝑐cc𝑐cThe gas accelerates from 0 km s-1 to the terminal velocity going from the inner to the outer radius of the jet. velocity | 400 km s-1 |
| Total jet column densitya𝑎aa𝑎aAll densities refer to neutral hydrogen only. | cm-2 |
| Jet temperature | K |
| Jet opening angle | 50∘ |
| Jet directiond𝑑dd𝑑dJet direction is in the coordinate system where the observer is located at (or actually ). | |
| Ly emission scale length | 1.5 kpc |
Spectrum
The synthetic spectrum of the best model is seen in Fig. 15.
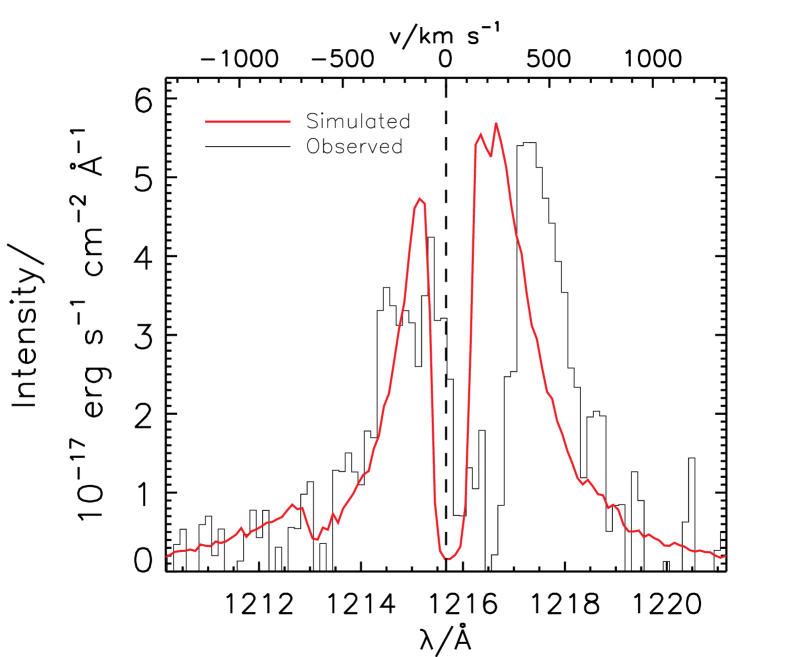
Although qualitatively the spectrum matches the observed spectrum reasonably, we have not been able to reproduce the apparent shift of the trough between the Ly peaks and the centroid of other emission lines of around 200 . Since Ly and H are produced in the same regions, this shift is rather puzzling. However similar shifts have recently been observed in several systems by Kulas et al. (2012). As discussed by these authors, complex geometry and velocity fields are needed to explain the observed profile. This means that our model is probably still too simplistic but increasing its complexity (and hence the number of parameters) would be beyond the scope of this paper.
Taking into account the simulated escape fraction in the direction of the observer (0.23), a SFR of 24 yr-1 was needed to fit the observed spectrum. These values are surprisingly well consistent with the observed ones (see Table 3).
Spatial separation of the red and blue photons
Figure 16 shows the surface brightness (SB) map of the simulated galaxy, along with the spectra extracted from two different apertures.
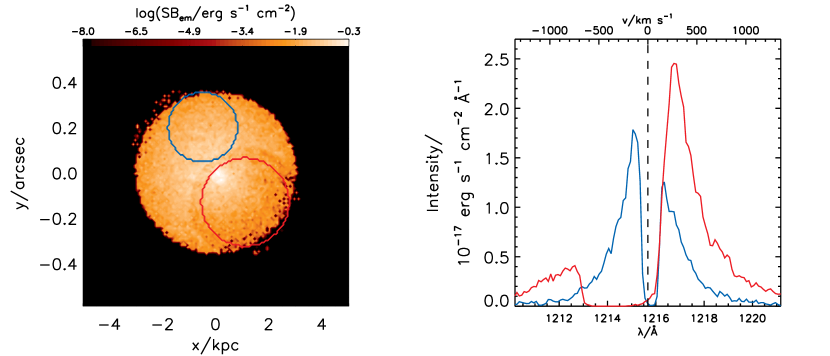
The jet covers the lower right portion of the galaxy, and it is seen that this effectively blocks blue Ly photons from escaping. On the other hand, the slight infall onto the rest of the galaxy skews the spectrum from that part toward being bluer. Consequently, the different parts of the spectrum indeed seem to escape at different locations on the sky. This SB map matches at least qualitatively the spatial configuration inferred in Sect. 4.3.
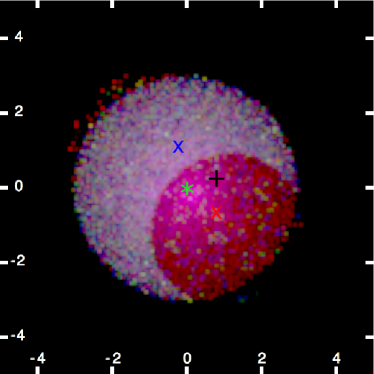
These effects are also seen in Fig. 17, where for comparison the system is also shown as it would look if observed from the side.
 |
 |
Here, it becomes obvious that an outflowing jet partially covering the galaxy may be responsible for the separation of the two parts of the spectrum. Interestingly, the dynamical age of the winds is found consistent with the age of the star formation activity.
Absorption properties along the QSO line of sight
Due to the stochasticity of the exact positions of the clouds in the model galaxy, the line of sight towards the quasar may or may not be representative of the system as a whole. To this end, 200 realisations of the favoured model have been carried out. This way, we obtain confidence limits for the quantities “observed” along the line of sight:
The number of clouds intercepted (either through the centre or the outskirts of a cloud) by the sightline is . The corresponding total total column density through the galaxy is then and the colour excess is . These values are well consistent with the observed ones.
By picking a few random realisation, having total hydrogen column density close to the measured value and uniform metallicity, we generated simulated absorption profiles of Si ii. These patterns resemble well the observed profile with well defined components of comparable strengths in a rather compact configuration (Fig. 4). This exercise further supports the view that the neutral gas in DLAs may well be distributed over the velocity components seen in the metal absorption profiles. Because H2 is usually detected associated to only a few components that constitute the metal profile (e.g. Petitjean et al., 2002; Noterdaeme et al., 2007), this means that measured molecular fractions (e.g. Petitjean et al., 2006) are lower limits to the actual value in the H2-bearing clumps (see also Noterdaeme et al., 2010a; Srianand et al., 2011).
 |
 |
 |
 |
 |
 |
5.2 Degeneracies in the model
Obviously, since we have not scanned the full parameter space, we cannot be entirely sure that we have found a unique solution for the model, and indeed some parameters are to a certain extent degenerate. However, in the process of finding the model that simultaneously matches all our observables we have tested several hundred different models, and in the end it became apparent that it was not possible to vary a given parameter much before one or more of the fits was clearly poor. For instance, the same value of could be obtained using a smaller (larger) number of higher (lower) density clouds. However, not only does this affect , but since most of the scatterings take place inside the clouds, this will also affect the shape of the emerging spectrum. Similarly, the amplitude difference of the two peaks could also be obtained with larger (smaller) velocity difference between the jet outflow and the overall infall of gas. However, this will affect both the velocity pattern of the clouds and the Ly escape fraction.
Finally, we note that a separation of the blue and red photons on the sky may in principle also be caused by rotation of the whole system (see Fig. 8 of Zheng & Miralda-Escudé, 2002). However, we aimed here at testing the picture first derived from the observed absorption and emission properties of the DLA galaxy (all consistent with a young outflowing starburst galaxy, relatively compact and of low mass), and not to test possible geometries that only explain the Ly emission alone.
6 Conclusion: implications for the DLA-galaxy connection
At low and intermediate redshifts, galaxies of all spectral types have been found associated to QSO absorption systems (e.g. Le Brun et al., 1997; Bergeron & Boissé, 1991; Steidel, 1995), which were generally selected upon their Mg ii absorption lines. While strong Mg ii are also likely DLAs (Rao et al., 2006), little is known about the galaxies associated to bona-fide DLAs at high redshift. Because of their selection upon the cross-section of neutral gas only, we can expect that DLA arise from galaxies with a large diversity of morphological types (see Battisti et al., 2012, for recent results at low redshift). It is thus very important to search for the associated galaxies and look for possible trends between the properties of the absorbers and their associated galaxies to start drawing a coherent picture of DLA galaxies.
Considering the velocity width of low-ionisation metal profiles, Ledoux et al. (2006) proposed that DLAs with higher metallicities are associated to more massive galaxies. This interpretation led Fynbo et al. to select high metallicity DLAs to search for associated galaxies. In three cases, DLA galaxies have been found at respectively 6, 16 and 4 kpc (Fynbo et al. 2010, 2011, Krogager et al., in prep), demonstrating the efficiency of the selection. Since there is some delay between the peak of star formation and the injection of metals in the ISM, we can expect that DLA galaxies selected this way have already passed through an epoch of star formation (interestingly, the abundances of nitrogen and oxygen reveal a picture in which DLAs undergo successive star bursts (Petitjean et al., 2008)). In addition, the large H i extent of massive galaxies can explain the relatively large impact parameters found for high-metallicity selected DLA galaxies (Krogager et al., in prep).
The velocity spread of low-ionisation metal lines ( ) and the metallicity ([Zn/H]) place the DLA towards J11350010 in a intermediate regime on the metallicity-velocity correlation observed by Ledoux et al. (2006). This is consistent with the intermediate mass derived for the DLA galaxy. We measure a high star formation rate of M⊙ yr-1 at very small impact parameter from the QSO line of sight ( 0.9 kpc). The SFR is much above the values measured in a population of extended, low surface brightness Ly emitters, recently proposed to be the optical counterparts of DLAs (Rauch et al., 2008). The Ly luminosity is also much higher than the average Ly flux from DLAs obtained by stacking several hundreds of DLA fibre spectra from the SDSS (Rahmani et al., 2010) and the measured SFR is also well above the limit obtained from searches of extended continuum emission of DLAs by Wolfe & Chen (2006). Clearly, the DLA galaxy studied here lays at the high-luminosity end of the general DLA-galaxy population. It is therefore important to understand how the absorption properties of the DLA can reveal the presence of an actively star-forming galaxy at small impact parameter.
From the absorption point of view, the DLA studied here has a relative metal and dust content typical of the general DLA population. Clearly, what makes the DLA towards J11350010 different from other DLAs is the large H i column density which is, to our knowledge, the largest ever measured along a QSO line of sight. If intervening absorption systems follow some kind of Schmidt-Kennicutt law (see e.g. Chelouche & Bowen, 2010), then we can expect that high column density systems are, among different classes of absorbers, those most closely associated with star-forming regions. Indeed, high surface density is expected to trigger star formation (Schaye, 2004) since the high column density H i gas can collapse into cold and molecular gas subsequently feeding the star formation. According to Schaye (2001), this could provide a natural explanation888We note however that while a transition is seen in the molecular fraction at in our galaxy (Savage et al., 1977), this transition is not readily seen in DLAs (Noterdaeme et al., 2008) nor in SMC (Tumlinson et al., 2002), where it probably occurs at higher column densities. See also Erkal et al. (2012). to the steep slope seen in the H i-frequency distribution at high column density (Noterdaeme et al., 2009b), though a dust bias against high column density systems is not excluded (Pei & Fall, 1995).
In addition, high H i column density systems are frequently seen at the redshift of long-duration gamma ray burst (GRB) afterglows (e.g. Vreeswijk et al., 2004; Chen et al., 2005; Berger et al., 2006; Jakobsson et al., 2006; Ledoux et al., 2009; Fynbo et al., 2009). Because there is accumulating evidence that these phenomena are connected to the death of massive stars (see e.g. Galama et al., 1998; Bloom et al., 1999; Fruchter et al., 2006), it is expected that GRB explosions occur in star-forming regions. Interestingly, the DLA galaxy studied here also appears to share some properties with at least a fraction of GRB host galaxies: namely being a young compact star-forming galaxy (see e.g. Savaglio et al., 2009; Levesque et al., 2010).
Selecting the most gas-rich DLAs could therefore be an efficient way to detect the associated galaxies at small impact parameter and during a period of active star formation. With the steadily increasing number of known DLAs, especially thanks to the SDSS (see Prochaska et al., 2005; Prochaska & Wolfe, 2009; Noterdaeme et al., 2009b) and soon to the ongoing Baryon Oscillation Spectroscopy Survey (Eisenstein et al., 2011), we can hope to test this hypothesis further in the near future.
Acknowledgements.
We warmly thank the Chilean National Time Allocation Committee for allowing us to perform the observations with MagE and Las Campanas Observatory staff for support. We are grateful to the ESO Director Discretionary Time allocation committee and the ESO Director General, Tim de Zeeuw, for allowing us to carry out the X-shooter observations. We thank Paranal Observatory staff for carrying out the X-shooter observations in service mode, Guido Cupani for help with treating the X-shooter data and Lorena Fuentealba for help with graphical issues. We made use of the ESO Science Archive Facility and of the Sloan Digital Sky Survey database. PN acknowledges support from CONICYT-CNRS and kind hospitality by the Departamento de Astronomía de la Universidad de Chile during the time part of this work was done. PL acknowledges funding from the Villum Foundation. PPJ and RS gratefully acknowledge support from the Indo-French Centre for the Promotion of Advanced Research (Centre Franco-Indien pour la promotion de la recherche avancée) under Project N.4304-2. MJM was supported by a Master scholarship through FONDECYT grant No. 1100214 and is now supported by a Fulbright-CONICYT PhD fellowship. JPUF acknowledges support from the ERC-StG grant EGGS-278202. The Dark cosmology centre is funded by the DNRF. SL was supported by FONDECYT grant No. 1100214.References
- Asplund et al. (2009) Asplund, M., Grevesse, N., Sauval, A. J., & Scott, P. 2009, ARA&A, 47, 481
- Atek et al. (2008) Atek, H., Kunth, D., Hayes, M., Östlin, G., & Mas-Hesse, J. M. 2008, A&A, 488, 491
- Atek et al. (2009) Atek, H., Kunth, D., Schaerer, D., et al. 2009, A&A, 506, L1
- Battisti et al. (2012) Battisti, A. J., Meiring, J. D., Tripp, T. M., et al. 2012, ApJ, 744, 93
- Bekki & Stanimirović (2009) Bekki, K. & Stanimirović, S. 2009, MNRAS, 395, 342
- Berger et al. (2006) Berger, E., Penprase, B. E., Cenko, S. B., et al. 2006, ApJ, 642, 979
- Bergeron & Boissé (1991) Bergeron, J. & Boissé, P. 1991, A&A, 243, 344
- Bloom et al. (1999) Bloom, J. S., Kulkarni, S. R., Djorgovski, S. G., et al. 1999, Nature, 401, 453
- Boissé et al. (1998) Boissé, P., Le Brun, V., Bergeron, J., & Deharveng, J.-M. 1998, A&A, 333, 841
- Bouché et al. (2011) Bouché, N., Murphy, M. T., Péroux, C., et al. 2011, MNRAS, 1548
- Brocklehurst (1971) Brocklehurst, M. 1971, MNRAS, 153, 471
- Bunker et al. (1999) Bunker, A. J., Warren, S. J., Clements, D. L., Williger, G. M., & Hewett, P. C. 1999, MNRAS, 309, 875
- Chelouche & Bowen (2010) Chelouche, D. & Bowen, D. V. 2010, ApJ, 722, 1821
- Chen et al. (2005) Chen, H.-W., Prochaska, J. X., Bloom, J. S., & Thompson, I. B. 2005, ApJ, 634, L25
- Christensen et al. (2009) Christensen, L., Noterdaeme, P., Petitjean, P., Ledoux, C., & Fynbo, J. P. U. 2009, A&A, 505, 1007
- Cowie & Hu (1998) Cowie, L. L. & Hu, E. M. 1998, AJ, 115, 1319
- Dekker et al. (2000) Dekker, H., D’Odorico, S., Kaufer, A., Delabre, B., & Kotzlowski, H. 2000, in Proc. SPIE Vol. 4008, p. 534-545, Optical and IR Telescope Instrumentation and Detectors, Masanori Iye; Alan F. Moorwood; Eds., 534–545
- Dijkstra et al. (2006a) Dijkstra, M., Haiman, Z., & Spaans, M. 2006a, ApJ, 649, 14
- Dijkstra et al. (2006b) Dijkstra, M., Haiman, Z., & Spaans, M. 2006b, ApJ, 649, 37
- Eisenstein et al. (2011) Eisenstein, D. J., Weinberg, D. H., Agol, E., et al. 2011, AJ, 142, 72
- Erkal et al. (2012) Erkal, D., Gnedin, N. Y., & Kravtsov, A. V. 2012, [ArXiv:1201.3653]
- Finkelstein et al. (2009) Finkelstein, S. L., Rhoads, J. E., Malhotra, S., & Grogin, N. 2009, ApJ, 691, 465
- Fox et al. (2007a) Fox, A. J., Ledoux, C., Petitjean, P., & Srianand, R. 2007a, A&A, 473, 791
- Fox et al. (2007b) Fox, A. J., Petitjean, P., Ledoux, C., & Srianand, R. 2007b, A&A, 465, 171
- Frank & Péroux (2010) Frank, S. & Péroux, C. 2010, MNRAS, 406, 2235
- Fruchter et al. (2006) Fruchter, A. S., Levan, A. J., Strolger, L., et al. 2006, Nature, 441, 463
- Fynbo et al. (2009) Fynbo, J. P. U., Jakobsson, P., Prochaska, J. X., et al. 2009, ApJS, 185, 526
- Fynbo et al. (2010) Fynbo, J. P. U., Laursen, P., Ledoux, C., et al. 2010, MNRAS, 408, 2128
- Fynbo et al. (2003) Fynbo, J. P. U., Ledoux, C., Möller, P., Thomsen, B., & Burud, I. 2003, A&A, 407, 147
- Fynbo et al. (2011) Fynbo, J. P. U., Ledoux, C., Noterdaeme, P., et al. 2011, MNRAS, 413, 2481
- Fynbo et al. (2008) Fynbo, J. P. U., Prochaska, J. X., Sommer-Larsen, J., Dessauges-Zavadsky, M., & Møller, P. 2008, ApJ, 683, 321
- Galama et al. (1998) Galama, T. J., Vreeswijk, P. M., van Paradijs, J., et al. 1998, Nature, 395, 670
- Gawiser et al. (2007) Gawiser, E., Francke, H., Lai, K., et al. 2007, ApJ, 671, 278
- Goldoni et al. (2006) Goldoni, P., Royer, F., François, P., et al. 2006, in Society of Photo-Optical Instrumentation Engineers (SPIE) Conference Series, Vol. 6269, Society of Photo-Optical Instrumentation Engineers (SPIE) Conference Series
- Gordon et al. (2003) Gordon, K. D., Clayton, G. C., Misselt, K. A., Landolt, A. U., & Wolff, M. J. 2003, ApJ, 594, 279
- Grove et al. (2009) Grove, L. F., Fynbo, J. P. U., Ledoux, C., et al. 2009, A&A, 497, 689
- Haehnelt et al. (1998) Haehnelt, M. G., Steinmetz, M., & Rauch, M. 1998, ApJ, 495, 647
- Heckman et al. (2001) Heckman, T. M., Sembach, K. R., Meurer, G. R., et al. 2001, ApJ, 558, 56
- Jakobsson et al. (2006) Jakobsson, P., Fynbo, J. P. U., Ledoux, C., et al. 2006, A&A, 460, L13
- Kennicutt (1998) Kennicutt, Jr., R. C. 1998, ARA&A, 36, 189
- Khare et al. (2011) Khare, P., vanden Berk, D., York, D. G., Lundgren, B., & Kulkarni, V. P. 2011, MNRAS, 1668
- Kobulnicky & Kewley (2004) Kobulnicky, H. A. & Kewley, L. J. 2004, ApJ, 617, 240
- Komatsu et al. (2011) Komatsu, E., Smith, K. M., Dunkley, J., et al. 2011, ApJS, 192, 18
- Kornei et al. (2010) Kornei, K. A., Shapley, A. E., Erb, D. K., et al. 2010, ApJ, 711, 693
- Kulas et al. (2012) Kulas, K. R., Shapley, A. E., Kollmeier, J. A., et al. 2012, ApJ, 745, 33
- Kulkarni et al. (2000) Kulkarni, V. P., Hill, J. M., Schneider, G., et al. 2000, ApJ, 536, 36
- Kulkarni et al. (2006) Kulkarni, V. P., Woodgate, B. E., York, D. G., et al. 2006, ApJ, 636, 30
- Kunth et al. (1998) Kunth, D., Mas-Hesse, J. M., Terlevich, E., et al. 1998, A&A, 334, 11
- Lai et al. (2008) Lai, K., Huang, J.-S., Fazio, G., et al. 2008, ApJ, 674, 70
- Laursen et al. (2009a) Laursen, P., Razoumov, A. O., & Sommer-Larsen, J. 2009a, ApJ, 696, 853
- Laursen & Sommer-Larsen (2007) Laursen, P. & Sommer-Larsen, J. 2007, ApJ, 657, L69
- Laursen et al. (2009b) Laursen, P., Sommer-Larsen, J., & Andersen, A. C. 2009b, ApJ, 704, 1640
- Laursen et al. (2011) Laursen, P., Sommer-Larsen, J., & Razoumov, A. O. 2011, ApJ, 728, 52
- Le Brun et al. (1997) Le Brun, V., Bergeron, J., Boisse, P., & Deharveng, J. M. 1997, A&A, 321, 733
- Ledoux et al. (1998) Ledoux, C., Petitjean, P., Bergeron, J., Wampler, E. J., & Srianand, R. 1998, A&A, 337, 51
- Ledoux et al. (2006) Ledoux, C., Petitjean, P., Fynbo, J. P. U., Møller, P., & Srianand, R. 2006, A&A, 457, 71
- Ledoux et al. (2003) Ledoux, C., Petitjean, P., & Srianand, R. 2003, MNRAS, 346, 209
- Ledoux et al. (2009) Ledoux, C., Vreeswijk, P. M., Smette, A., et al. 2009, A&A, 506, 661
- Leitherer et al. (1999) Leitherer, C., Schaerer, D., Goldader, J. D., et al. 1999, ApJS, 123, 3
- Levesque et al. (2010) Levesque, E. M., Berger, E., Kewley, L. J., & Bagley, M. M. 2010, AJ, 139, 694
- López & Chen (2012) López, G. & Chen, H.-W. 2012, MNRAS, 419, 3553
- Lowenthal et al. (1995) Lowenthal, J. D., Hogan, C. J., Green, R. F., et al. 1995, ApJ, 451, 484
- Marshall et al. (2008) Marshall, J. L., Burles, S., Thompson, I. B., et al. 2008, in Society of Photo-Optical Instrumentation Engineers (SPIE) Conference Series, Vol. 7014, Society of Photo-Optical Instrumentation Engineers (SPIE) Conference Series
- Martin (1997) Martin, C. L. 1997, ApJ, 491, 561
- Martin (1999) Martin, C. L. 1999, ApJ, 513, 156
- Mas-Hesse et al. (2003) Mas-Hesse, J. M., Kunth, D., Tenorio-Tagle, G., et al. 2003, ApJ, 598, 858
- Møller et al. (2004) Møller, P., Fynbo, J. P. U., & Fall, S. M. 2004, A&A, 422, L33
- Møller et al. (2002) Møller, P., Warren, S. J., Fall, S. M., Fynbo, J. U., & Jakobsen, P. 2002, ApJ, 574, 51
- Morton (2003) Morton, D. C. 2003, ApJS, 149, 205
- Nestor et al. (2011) Nestor, D. B., Johnson, B. D., Wild, V., et al. 2011, MNRAS, 412, 1559
- Nestor et al. (2007) Nestor, D. B., Turnshek, D. A., Rao, S. M., & Quider, A. M. 2007, ApJ, 658, 185
- Neufeld (1991) Neufeld, D. A. 1991, ApJ, 370, L85
- Nilsson et al. (2007) Nilsson, K. K., Møller, P., Möller, O., et al. 2007, A&A, 471, 71
- Noterdaeme et al. (2007) Noterdaeme, P., Ledoux, C., Petitjean, P., et al. 2007, A&A, 474, 393
- Noterdaeme et al. (2008) Noterdaeme, P., Ledoux, C., Petitjean, P., & Srianand, R. 2008, A&A, 481, 327
- Noterdaeme et al. (2009a) Noterdaeme, P., Ledoux, C., Srianand, R., Petitjean, P., & Lopez, S. 2009a, A&A, 503, 765
- Noterdaeme et al. (2010a) Noterdaeme, P., Petitjean, P., Ledoux, C., et al. 2010a, A&A, 523, A80
- Noterdaeme et al. (2009b) Noterdaeme, P., Petitjean, P., Ledoux, C., & Srianand, R. 2009b, A&A, 505, 1087
- Noterdaeme et al. (2010b) Noterdaeme, P., Srianand, R., & Mohan, V. 2010b, MNRAS, 403, 906
- Östlin et al. (2009) Östlin, G., Hayes, M., Kunth, D., et al. 2009, AJ, 138, 923
- Pei & Fall (1995) Pei, Y. C. & Fall, S. M. 1995, ApJ, 454, 69
- Péroux et al. (2011) Péroux, C., Bouché, N., Kulkarni, V. P., York, D. G., & Vladilo, G. 2011, MNRAS, 1918
- Péroux et al. (2003) Péroux, C., McMahon, R. G., Storrie-Lombardi, L. J., & Irwin, M. J. 2003, MNRAS, 346, 1103
- Petitjean et al. (2006) Petitjean, P., Ledoux, C., Noterdaeme, P., & Srianand, R. 2006, A&A, 456, L9
- Petitjean et al. (2008) Petitjean, P., Ledoux, C., & Srianand, R. 2008, A&A, 480, 349
- Petitjean et al. (2000) Petitjean, P., Srianand, R., & Ledoux, C. 2000, A&A, 364, L26
- Petitjean et al. (2002) Petitjean, P., Srianand, R., & Ledoux, C. 2002, MNRAS, 332, 383
- Pettini et al. (2001) Pettini, M., Shapley, A. E., Steidel, C. C., et al. 2001, ApJ, 554, 981
- Pirzkal et al. (2007) Pirzkal, N., Malhotra, S., Rhoads, J. E., & Xu, C. 2007, ApJ, 667, 49
- Prantzos & Boissier (2000) Prantzos, N. & Boissier, S. 2000, MNRAS, 315, 82
- Prochaska et al. (2005) Prochaska, J. X., Herbert-Fort, S., & Wolfe, A. M. 2005, ApJ, 635, 123
- Prochaska & Wolfe (1997) Prochaska, J. X. & Wolfe, A. M. 1997, ApJ, 487, 73
- Prochaska & Wolfe (2002) Prochaska, J. X. & Wolfe, A. M. 2002, ApJ, 566, 68
- Prochaska & Wolfe (2009) Prochaska, J. X. & Wolfe, A. M. 2009, ApJ, 696, 1543
- Rahmani et al. (2010) Rahmani, H., Srianand, R., Noterdaeme, P., & Petitjean, P. 2010, MNRAS, 409, L59
- Rao et al. (2006) Rao, S. M., Turnshek, D. A., & Nestor, D. B. 2006, ApJ, 636, 610
- Rauch et al. (2008) Rauch, M., Haehnelt, M., Bunker, A., et al. 2008, ApJ, 681, 856
- Rothman et al. (2005) Rothman, L. S., Jacquemart, D., Barbe, A., et al. 2005, J. Quant. Spec. Radiat. Transf., 96, 139
- Samui et al. (2008) Samui, S., Subramanian, K., & Srianand, R. 2008, MNRAS, 385, 783
- Savage et al. (1977) Savage, B. D., Bohlin, R. C., Drake, J. F., & Budich, W. 1977, ApJ, 216, 291
- Savaglio et al. (2009) Savaglio, S., Glazebrook, K., & Le Borgne, D. 2009, ApJ, 691, 182
- Schaerer et al. (2011) Schaerer, D., Hayes, M., Verhamme, A., & Teyssier, R. 2011, A&A, 531, A12
- Schaye (2001) Schaye, J. 2001, ApJ, 562, L95
- Schaye (2004) Schaye, J. 2004, ApJ, 609, 667
- Schlegel et al. (1998) Schlegel, D. J., Finkbeiner, D. P., & Davis, M. 1998, ApJ, 500, 525
- Schneider et al. (2010) Schneider, D. P., Richards, G. T., Hall, P. B., et al. 2010, AJ, 139, 2360
- Spitzer (1978) Spitzer, L. 1978, Physical processes in the interstellar medium (New York Wiley-Interscience, 1978. 333 p.)
- Srianand et al. (2011) Srianand, R., Gupta, N., Petitjean, P., et al. 2011, [ArXiv:1112.1438]
- Srianand et al. (2008) Srianand, R., Gupta, N., Petitjean, P., Noterdaeme, P., & Saikia, D. J. 2008, MNRAS, 391, L69
- Srianand et al. (2005) Srianand, R., Petitjean, P., Ledoux, C., Ferland, G., & Shaw, G. 2005, MNRAS, 362, 549
- Steidel (1995) Steidel, C. C. 1995, in QSO Absorption Lines, ed. G. Meylan, 139
- Steidel et al. (2003) Steidel, C. C., Adelberger, K. L., Shapley, A. E., et al. 2003, ApJ, 592, 728
- Tapken et al. (2007) Tapken, C., Appenzeller, I., Noll, S., et al. 2007, A&A, 467, 63
- Tasitsiomi (2006) Tasitsiomi, A. 2006, ApJ, 645, 792
- Telfer et al. (2002) Telfer, R. C., Zheng, W., Kriss, G. A., & Davidsen, A. F. 2002, ApJ, 565, 773
- Tenorio-Tagle et al. (1999) Tenorio-Tagle, G., Silich, S. A., Kunth, D., Terlevich, E., & Terlevich, R. 1999, MNRAS, 309, 332
- Tumlinson et al. (2002) Tumlinson, J., Shull, J. M., Rachford, B. L., et al. 2002, ApJ, 566, 857
- Veilleux et al. (2005) Veilleux, S., Cecil, G., & Bland-Hawthorn, J. 2005, ARA&A, 43, 769
- Venemans et al. (2005) Venemans, B. P., Röttgering, H. J. A., Miley, G. K., et al. 2005, A&A, 431, 793
- Verhamme et al. (2008) Verhamme, A., Schaerer, D., Atek, H., & Tapken, C. 2008, A&A, 491, 89
- Verhamme et al. (2006) Verhamme, A., Schaerer, D., & Maselli, A. 2006, A&A, 460, 397
- Vernet et al. (2011) Vernet, J., Dekker, H., D’Odorico, S., et al. 2011, A&A, 536, A105
- Vladilo & Péroux (2005) Vladilo, G. & Péroux, C. 2005, A&A, 444, 461
- Vladilo et al. (2008) Vladilo, G., Prochaska, J. X., & Wolfe, A. M. 2008, A&A, 478, 701
- Vreeswijk et al. (2004) Vreeswijk, P. M., Ellison, S. L., Ledoux, C., et al. 2004, A&A, 419, 927
- Weatherley et al. (2005) Weatherley, S. J., Warren, S. J., Møller, P., et al. 2005, MNRAS, 358, 985
- Welty et al. (1999) Welty, D. E., Frisch, P. C., Sonneborn, G., & York, D. G. 1999, ApJ, 512, 636
- Welty et al. (2001) Welty, D. E., Lauroesch, J. T., Blades, J. C., Hobbs, L. M., & York, D. G. 2001, ApJ, 554, L75
- Wolfe & Chen (2006) Wolfe, A. M. & Chen, H.-W. 2006, ApJ, 652, 981
- Wolfe et al. (2003) Wolfe, A. M., Prochaska, J. X., & Gawiser, E. 2003, ApJ, 593, 215
- Wolfe et al. (1986) Wolfe, A. M., Turnshek, D. A., Smith, H. E., & Cohen, R. D. 1986, ApJS, 61, 249
- Zheng & Miralda-Escudé (2002) Zheng, Z. & Miralda-Escudé, J. 2002, ApJ, 578, 33