Energetic feedback and 26Al from massive stars and their supernovae in the Carina region
Abstract
Aims. We study the populations of massive stars in the Carina region and their energetic feedback and ejection of 26Al.
Methods. We present a census of the stellar populations in young stellar clusters within a few degrees of the Carina Nebula. For each star we estimate the mass, based on the spectral type and the host cluster age. We use population synthesis to calculate the energetic feedback and ejection of 26Al from the winds of the massive stars and their supernova explosions. We use 7 years of INTEGRAL observations to measure the 26Al signal from the region.
Results. The INTEGRAL 26Al signal is not significant with a best-fit value of ph cm-2 s-1, approximately half of the published Compton Gamma Ray Observatory (CGRO) result, but in agreement with the latest CGRO estimates. Our analysis of the stellar populations in the young clusters leads to an expected signal of half the observed value, but the results are consistent within 2. We find that the fraction of 26Al ejected in Wolf-Rayet winds is high, and the observed signal is unlikely to be caused by 26Al ejected in supernovae alone, indicating a strong wind ejection of 26Al. Due to the lack of prominent O stars, regions with ages 10 Myr are often neglected in studies of OB associations. We find that in the Carina region such clusters contribute significantly to the stellar mass and the energetics of the region.
Key Words.:
Stars: abundances, early type, winds, outflows – ISM: abundances – Gamma rays: ISM1 introduction
Feedback from massive stars plays a crucial role in the formation of stars and in shaping the surrounding inter-stellar medium (ISM). We developed a new population synthesis tool to study the feedback from populations of massive stars in OB associations (Voss et al., 2009). In Voss et al. (2010) we applied the population synthesis to the nearby Orion region and found good agreement with observations of the region. However, the population of massive stars in Orion is not large enough to provide strong constraints on the feedback models. For this it is necessary to study a larger population including very high mass stars (100).
The Carina region hosts a large population of very young massive stars at a distance of 2.3 kpc (Allen & Hillier, 1993; Walborn, 1995; Smith, 2002) including 72 of spectral type O (Smith, 2006; Cappa et al., 2008), 6 Wolf-Rayet (WR) stars (van der Hucht, 2001), one luminous blue variable (LBV; Carinae) and three evolved red supergiants (Feinstein et al., 1980; Feinstein, 1981). The total stellar mass is estimated to be (Preibisch et al., 2011), and the total mass of the surrounding gas and dust is (Preibisch et al., 2011). The majority of the young stars reside in the Carina nebula (summarized in Smith, 2006), but the surrounding region hosts a large number of smaller open clusters with a wider range of stellar ages. While the stellar populations have been studied in the most prominent of these (NGC3293;NGC 3324 Evans et al., 2005; Cappa et al., 2008), many of the smaller clusters were never investigated in detail.
The content of massive stars in the Carina region is intermediate between the population of relatively well-studied small star-forming regions, such as Orion and Sco-Cen, and more distant superclusters, where single regions such as 30 Doradus, hosting 1000 O-stars, can affect the energetics and chemistry of their host galaxies. Therefore the Carina region is useful for the study of massive stars, feedback from massive stars, and important for the understanding of how the feedback mechanisms scale with the size/mass of the region. The population is similar to the Cygnus OB2 association hosting 80 (Hanson, 2003) stars of type O, which was the goal of a recent study similar to ours (Martin et al., 2009; Martin et al., 2010).
The radioactive isotope 26Al is ejected from massive stars through their winds and supernova explosions (Prantzos & Diehl, 1996). It is therefore intimately related to the energy feedback from massive stars. It has a mean lifetime of Myr and is traced by the -ray decay line at 1808.63 keV, observable by -ray observatories such as the COMPTEL instrument aboard the CGRO and the SPI instrument aboard INTEGRAL.
In the light of the uncertainties in the modelling of massive stars, it is necessary to perform multi-wavelength consistency checks, encompassing the different aspects of feedback provided by massive star clusters. In this paper we discuss the ejection of 26Al and the injection of energy into the ISM from the massive star population in the Carina region. This is complementary to the modelling and observations of the energy and UV balance studied by Smith (2006); Smith & Brooks (2007). The comparison between the theoretical models and the observables are important, both for understanding crucial parts of stellar evolution, in particular mass loss rates, nucleosynthesis and supernova explosions, and for understanding issues related to the ISM, such as star-formation and feedback mechanisms. A new generation of stellar models (Meynet & Maeder, 2005; Palacios et al., 2005; Limongi & Chieffi, 2006), improved observations of stellar populations in star-forming regions and the advent of the INTEGRAL observatory providing new 26Al observations, has allowed progress on the subject: Voss et al. (2010) studied the variations between different models of massive stars, in particular the effects of rotation and the strength of wind mass-loss on the the radio-active tracers and the energetics of star-forming regions. The individual nearby star-forming regions Sco-Cen (Diehl et al., 2010), Orion (Voss et al., 2010) and Cygnus (Martin et al., 2009; Martin et al., 2010) have been studied in detail and good agreement has been found between theory and the observations.
2 Observations of 26Al from the Carina region
2.1 CGRO results
The 26Al signal from the Carina region was discussed by Knödlseder et al. (1996), based on a measured flux of 3.2 ph s-1 cm-2 (with statistical and systematic uncertainties of 0.8 and 0.1, respectively). Their analysis showed that the signal is seen from within 2 degrees of the Carina Nebula direction only, although an origin from a larger region extending up to 6 degrees would also be consistent with the measurements. A subsequent analysis of the full CGRO database revised flux values down to 1.1–2.2 ph s-1 cm-2 (with % statistical error Plüschke, 2001). This signal corresponds to 0.005–0.010 of 26Al at the distance of the Carina Nebula. An origin from foreground stellar groups and from AGB stars is help implausible, and background groups would have to be exceptionally active to explain the flux (see Knödlseder et al., 1996, for a discussion). Here we use INTEGRAL observations for a new measurement of 26Al from the Carina region, and use a population synthesis approach (Voss et al., 2009) to compare to expectations.
2.2 INTEGRAL data analysis
We used INTEGRAL data taken between revolution 19 and 855 of the satellite. This corresponds to a total effective exposure of 17.6Ms on Carina, defined as a circular region with radius of 40∘ centred on . The methodology developed in Martin et al. (2009) to extract the 1809keV signal from Cygnus was again used for the present study. The reader is referred to the latter work for more details about data preparation, instrumental background modelling, and other technical aspects. We searched for emission in the 1806–1812keV band over the 245∘–325∘ longitude range, using two different methods.
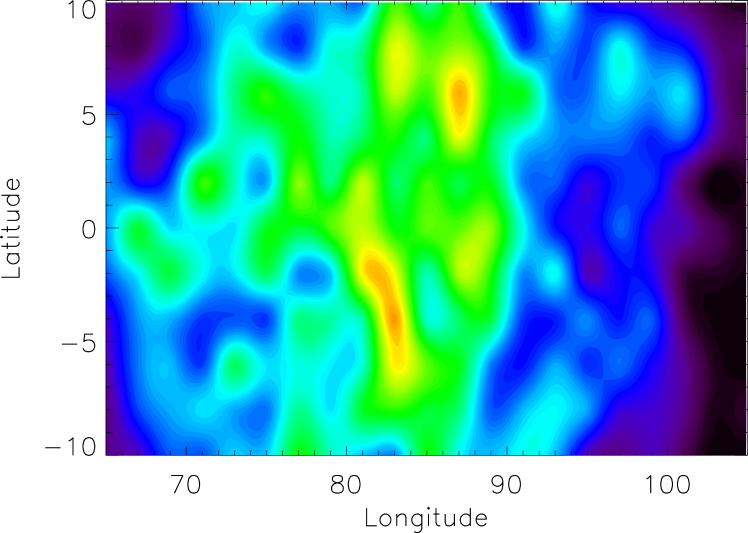
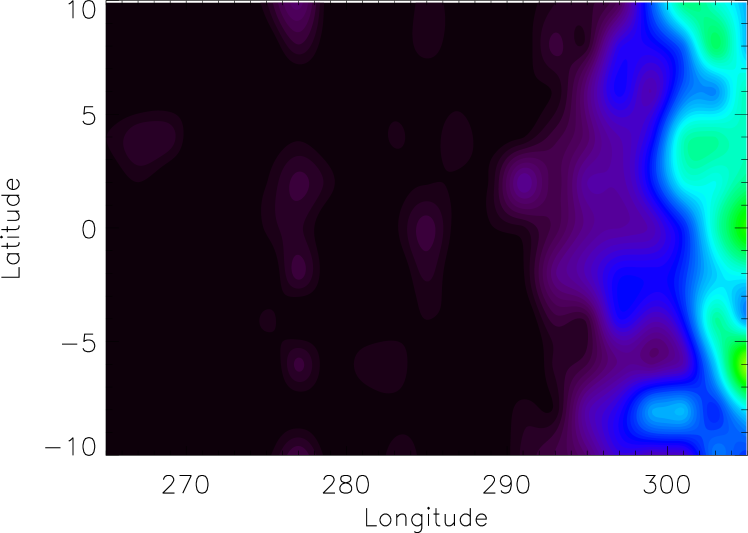
The first was a point-source scan, where we try to account for the data by the fitting of an instrumental background model and a sky model consisting of a single point-source. The operation is repeated for a grid of positions covering the whole Carina region. From this analysis, however, no significant excess emission was detected in the Carina region around where the main massive star clusters are located. Significant emission appears beyond , as we move towards the Galactic ridge, which dominates the allsky 1809keV emission. As a comparison, we did the same for the Cygnus region and found strong emission around , consistent with the dedicated analysis exposed in Martin et al. (2009) (while the exposure is similar for both regions, Cygnus hosts almost twice the number of O-stars, and is nearer). Fig. 1 shows the maximum likelihood ratio maps obtained for the Carina and Cygnus regions.
We then determined more quantitatively the 1809keV flux from the Carina region by fitting to the data extended sky models that describe better the expected 26Al decay emission from a conglomerate of star clusters. We used 2D Gaussian intensity distribution of various sizes and tried two different positions for these: the first is , which is the position of Trumpler 16, the richest cluster in terms of O stars, and the second is , which is the position of NGC3293, which is the cluster with the largest number of past supernovae (as extrapolated from its present-day IMF, see below). In that way, we tested two scenarios: one in which the 26Al content of the Carina region is assumed to be fed mostly by the WR-winds of present-day massive stars, and one in which it is assumed to result mostly from past supernovae. Fluxes in the range 1.0–1.5 ph s-1 cm-2 are obtained, with typical statistical uncertainties of order 1.0 ph s-1 cm-2. Combining information from both CGRO and INTEGRAL apparently points to a 1809keV flux from the Carina region, in the range 1–2 ph s-1 cm-2, corresponding to a 26Al mass of .
3 Analysis of the stellar populations
| Cluster | Number of O stars | Age | Distance |
|---|---|---|---|
| Myr | kpc | ||
| Bochum 10 | 1 | 7 | 2.3 |
| Bochum 11 | 5 | 2 | 2.3 |
| Loden 153 | 1 | 5.5 | 2.7 |
| NGC 3293 | 0 | 10 | 2.7 |
| NGC 3324 | 3 | 2.5 | 3.0 |
| Trumpler 14 | 9 | 1 | 2.3 |
| Trumpler 15 | 6 | 6 | 2.3 |
| Trumpler 16 | 43 | 2.5 | 2.3 |
To compute the amount of 26Al in the observed region it is necessary to understand the stellar content of the region, and how star formation developed in the last Myr. In our analysis we include the region considered by Knödlseder et al. (1996) to be the emitting region, that is a region approximately centered on the Carina Nebula, with a radius of . This includes the Carina Nebula itself, but also some clusters that are distant enough from this to not be linked directly to this by dynamics. In our main analysis we only consider clusters with a distance below kpc, but a possible contribution from the background will be discussed in Sect. 4.
The population of massive stars in clusters belonging to the Carina Nebula was presented in Smith (2006), and we adopt their stellar classifications and cluster ages (noting that ages of such young clusters are always very uncertain) and assume that the study is complete for the O stars. In addition we include the three supergiants listed in Feinstein et al. (1980); Feinstein (1981). For NGC 3324 and NGC 3293 we used Cappa et al. (2008) and Evans et al. (2005), respectively, with the addition of a red supergiant from Carraro & Patat (2001). Other clusters were found to be too old or small to contribute significantly to the observed 26Al signal e.g. Loden 165, NGC 3114, VdB Hagen 99, Bochum 9 (Carraro & Patat, 2001; Patat & Carraro, 2001). Additional WR stars that are found outside the main clusters were taken from van der Hucht (2001). Table 1 summarizes basic information about the clusters considered. Recent studies have shown that there is a significant population of OB stars obscured by dust from the Carina region itself (e.g. Povich et al., 2011). We will discuss this population in Sect. 5.2.
To use this information it is necessary to derive the stellar masses from the spectral types. We do this separately for the main sequence stars and for the evolved stars. As in Voss et al. (2010) we find the temperature and luminosity of the stellar spectral types of O stars from the line-blanketed models of Martins et al. (2005), using their observational scale. The masses were then found by comparing to the rotating stellar models of Meynet & Maeder (2005). In Voss et al. (2010) we compared the masses found from this method to the spectroscopic masses and found agreement, and a similar result was found by Weidner & Vink (2010). Fig. 2 compares the properties of the observed stars to isochrones from 4 different sets of stellar models. The analysis above was repeated for each of the sets, and the differences were found to be negligible compared to the uncertainties of our results. We used a similar approach for the most massive B-stars, where we took the extrapolation of the Martins et al. (2005) luminosities presented in Smith (2006), together with the effective temperatures of Zorec et al. (2009). The luminosities are only available for B-stars of luminosity class III and V. Luminosities for class IV were found by logarithmic interpolation between class III and V. B-stars of luminosity class I and II were assumed to be near the end of the main sequence, and were not included in this analysis. These stars were included as evolved stars in the analysis below.
It is not possible to derive the masses of evolved stars with this method. Instead we made crude estimates of the initial mass of these stars based on the ages of the clusters. This was done by assuming that the mass of the evolved stars must be above the most massive main sequence star in the host cluster and below the mass for which the stellar lifetime is equal to the age of the cluster. The list of evolved stars is given in Table 2. Some of the WR stars are not associated with clusters. We do not attempt to derive their ages, and the uncertainties resulting from these objects is discussed in Sect. 4.

| Name | Type | Cluster | Initial mass | 26Al |
|---|---|---|---|---|
| () | ||||
| HD 92809 | WC6 | Bochum 10 | 0.3–1.5 | |
| HD 92964 | B2 Ia | Bochum 10 | 0.0–0.3 | |
| HD 92852 | K1/3 III | Bochum 10 | 0.0–0.3 | |
| Evans 3293-001 | B0 Iab | NGC 3293 | 0.0–0.1 | |
| Evans 3293-002 | B0.7 Ib | NGC 3293 | 0.0–0.1 | |
| Feinstein CPD 3502 | M1.5 Iab-Ib | NGC 3293 | 0.0–0.1 | |
| HD 93129Aa | O2 If | Trumpler 14 | 80-120 | 0.0–4.0 |
| Car | LBV | Trumpler 16 | 80-120 | 0.0–4.0 |
| HD 93162 | WN6ha | Trumpler 16 | 80-120 | 2.0–8.0 |
| HD 93131 | WN6ha | Trumpler 16 | 80-120 | 2.0–8.0 |
| HD 92740A | WN7ha | Trumpler 16 | 80-120 | 2.0–8.0 |
| Hucht WR27 | WC6 | Field (2.5) | - | - |
| HD 94546 | WN4 | Field (4.05) | - | - |
| Hucht WR31a | WN11h | Field (8.0) | - | - |
| HD 90657 | WN5 | Field (3.88) | - | - |
| HD 95435 | WC5 | Field (6.11) | - | - |
| Hucht WR21a | WN6 | Field (?) | - | - |
3.1 Initial mass function
The set of initial masses can be used to derive an initial mass function (IMF) for the region. The IMF of Trumpler 16 was previously derived by Massey & Johnson (1993) who found it to be consistent with a single power-law with a slope of =1.3 above 15, where (the Salpeter slope is ). The stellar content of the group has been revised several times since then, in particular many binary components have been resolved, and the stellar evolutionary and atmosphere models have changed significantly. Furthermore Massey & Johnson (1993) assumed Gaussian statistics despite having bins with very few counts. We therefore provide a new fit to the IMF, fitting a single power-law to the initial stellar masses using maximum likelihood fitting.
Each of the clusters with a population large enough to achieve a meaningful fit were fitted individually, assuming that all stars above 15 have been identified. The results are given in Table 3. Clearly they are all consistent with the Salpeter (1955) mass function, but only Trumpler 16 provides relatively good statistics. A combined sample consisting of all the stars in the clusters that samples the complete 15–120 range yields a very similar result to the fit from Trumpler 16 alone. We also perform a combined fit to all the clusters, with an upper limit of 40 (to avoid incompleteness corrections). Interestingly this yields a relatively shallow slope. However, the smaller range means that this is relatively strongly affected by systematic errors on the stellar masses as well as a possible incompleteness of the sample at masses and it is not clear that the result should be trusted. To understand the dependence on these effects we have performed the fits with a higher completeness mass of , yielding results very similar to the Salpeter (1955) mass function.
| Cluster | IMF () | IMF () | Mass range | No. of stars | Supernovae | Total No. () |
| Bochum 10 | - | - | 15–32 | 5 | 2.34 | 7.34 |
| Bochum 11 | - | 15–120 | 6 | 0 | 6 | |
| Loden 153 | - | - | 15–45 | 2 | 0.43 | 2.43 |
| NGC 3293 | - | - | 15–22 | 23 | 20.5 | 53.5 |
| NGC 3324 | - | 15–120 | 3 | 0 | 3 | |
| Trumpler 14 | - | 15–120 | 13 | 0 | 13 | |
| Trumpler 15 | - | - | 15–40 | 11 | 3.08 | 14.08 |
| Trumpler 16 | 1.3 | 15–120 | 54 | 0 | 54 | |
| All young2 | 15–120 | 76 | 0 | 76 | ||
| All3 | - | - | 26.35 | 153.35 |
1Slope of a single power-law fit.
2Clusters young enough that no supernova explosions are believed to have occurred.
3Clusters with maximum stellar masses fitted in the 15–40 range.
In a recent survey of Trumpler 15, Wang et al. (2011) found a lack of massive stars () by extrapolating observations of stars of lower masses. Using the Kroupa (2001) mass function, they find that there should be stars, whereas they claim that none are observed. They conclude that either it is an anomaly of the IMF, or alternatively that all stars above have already exploded, which would indicate an age above 10 Myr, older than what is normally assumed for this cluster. Contrary to their results, our analysis finds that there are 6 stars in this cluster with masses above and that with an age of Myr, approximately 3 supernova have exploded, which is in agreement with the results at lower stellar masses. We believe that the discrepancy is the result of Wang et al. (2011) underestimating the masses of stars with early-type spectra.
Feinstein (1995) summed up the total masses of the observed stars in the individual clusters. With the updated stellar populations we improve these estimates. We furthermore take into account the completeness limits and the contribution from exploded stars to compare the initial stellar content of the individual groups. Our results show that TR 16 is still the dominant group, but that the older group (10 Myr) NGC 3293, that is often neglected due to the lack of O stars, has previously hosted a decent population of these ( stars are expected to have exploded as supernovae in this association). Assuming the Salpeter (1955) mass function, the Carina region hosts times as many stars as the more nearby Orion region (Voss et al., 2010). This is lower than what is expected from the observed number of O-stars (a factor of ), due to the somewhat higher age (5–6 Myr) of the bulk of the stars in Orion.
We furthermore use the Salpeter (1955) IMF to estimate the relative sizes of the open clusters, by extrapolating the number of stars in the observed mass ranges of the individual clusters. Estimates of the initial numbers of stars () are given in Table 3, together with the estimated number of SNe that have already exploded. While the young clusters (3.5 Myr) clearly dominate visually (and in terms of how well studied they are), especially the clusters that are part of the extended Carina Nebula, they only comprise half of the star formation within the last 10 Myr.
4 26Al
The amount of 26Al found from different analyses of CGRO and INTEGRAL data is in the range 0.004–0.009. Even the lower estimates are significantly higher than the largest expected mass emitted by a single object. The possibility of a much lower mass ejected by a foreground object was dismissed by Knödlseder et al. (1996). The current understanding that 26Al is almost exclusively being ejected by massive stars further limits the possibility of confusion by foreground objects, due to the completeness of the detection of nearby massive stars. The background of the Carina complex is less well understood, but clearly hosts young clusters with massive stars. For example the massive young cluster Westerlund 2 is within our field, at a distance of 8 kpc (Rauw et al., 2007). However, most of these are at large distances (at least twice the distance of the Carina Nebula) and within our search radius only Westerlund 2 has a content of young stars that can compare to Trumpler 16. The background can therefore only contribute a modest fraction of the observed signal.
To investigate the origin of the observed 26Al signal, we divide the stars into three categories:
-
•
main sequence (O) stars
-
•
exploded stars (SNe)
-
•
evolved (WR and supergiant) stars
and explore their contributions separately. We ignore the population of stars of spectral type B or later, as their wind contribution is negligible, and their lifetimes are long enough that they have not yet gone supernova.
26Al from O stars:
The initial stellar masses and current ages of the 66 O-stars with spectral types of O3 or later were estimated above. From following the wind ejection and radioactive decay of 26Al along the stellar tracks, we can associate a 26Al mass to each cluster along its evolution. The sum is found to be 5. While the average ages of the stars are pretty stable using the isochrone fitting, the individual ages are not very reliable, and the ages of the few most massive stars are quite important for the result. We therefore calculate an upper limit to the O-star contribution by assuming that all the O-stars are just about to evolve off the main sequence (this is the maximum age of the O-stars as they will change spectral type after this). This assumption gives an upper limit of 1.5. In this estimate the contribution from the O2 star in Tr 14 as well as Carinae was ignored. They are included in the discussion of the evolved stars instead.
26Al from supernovae:
We use our estimate of the number of supernova explosions in each cluster (see Table 3), together with the population synthesis tool described in Voss et al. (2009, 2010) to estimate the contribution from exploded stars to the observed 26Al. For each cluster the expected contribution and the error on the estimate is calculated using monte carlo simulations. In each simulation, the number of exploded stars is chosen from a Poissonian distribution with the mean values given in Table 3, and the masses of the stars are chosen randomly from the Salpeter (1955) mass function. The lower mass limit of the IMF is given by the stellar track with the lowest initial mass that has a lifetime shorter than the current age of the cluster. The ejection of 26Al from the winds and supernovae is followed taking into account the radioactive decay. This gives an estimate of 9 of 26Al from the supernova yields and 3 from the preceding winds of the exploded stars.
26Al from evolved stars:
The final contribution to the 26Al signal comes from the winds of the evolved stars. In Table 2 we list the evolved stars that we have identified inside the region. The cluster association of each evolved stars is listed. A number of WR stars in the catalogue of van der Hucht (2001) have no cluster association and they are listed as field sources, with the photometric distances given by the catalogue (only WR stars with estimated distances below 10 kpc are included in our list). The initial masses of the evolved cluster stars were assumed to be close to the maximum initial stellar mass given the age of the clusters. For each star we have identified stars in our stellar isochrones with similar initial masses and evolutionary states (spectral types) and used these to estimate the possible range of 26Al masses present in the ISM. These are also listed in Table 2. The field WR stars are more problematic, as their distances are unreliable, and there is no stellar population through which their approximate age can be deduced. However, due to the slope of the IMF and the shorter lifetimes of massive stars, most of them probably correspond to relatively low (for WR stars) initial masses of (25–40 ). As there is no foreground population of massive stars that they can belong to, most of them must be located behind the Carina Nebula. This is consistent with their estimated distances (however uncertain), and their contribution is therefore unlikely to be significant. From Table 2, it can be seen that the total mass of 26Al from all the evolved stars is unlikely to exceed 3. The most realistic estimate range is 1.5–2.0.
Population synthesis:
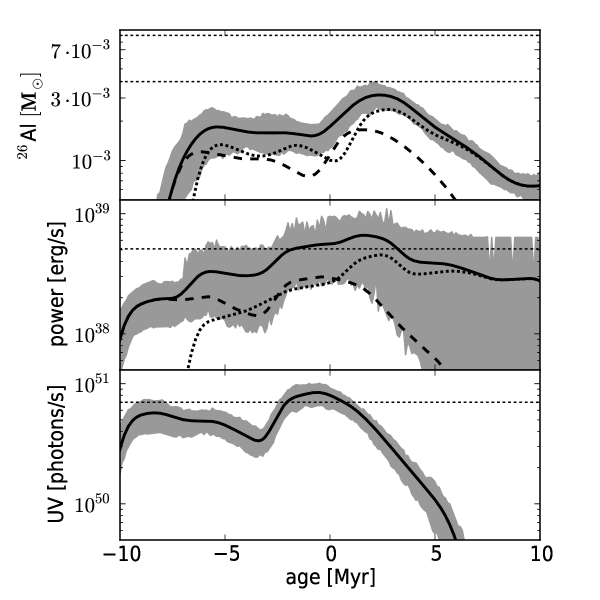
For comparison we compute the expectation of 26Al from the entire region using population synthesis (Voss et al., 2009), with the cluster ages from Table 1 and total star-numbers from Table 3. Each cluster was assumed to have a Gaussian age spread with =0.5 Myr. We used the model that gives the highest 26Al yields, with rotating stellar evolution models from Meynet & Maeder (2005) and supernova yields from Limongi & Chieffi (2006). The results are shown in the top panel of Fig. 3. Also shown as the range between the two horizontal dashed lines, is the most likely observed 26Al signal. As discussed in Sect. 2 the range should not be taken as a statistical confidence interval, due to the poorly constrained systematic effects of the different ways to measure the signal. The population synthesis model predicts that the signal is divided roughly evenly between the wind and the supernova contributions. This is mainly due to the fact that the population synthesis model predicts a lower wind contribution than what is found from the observed stars. However, this is consistent within the 90% variance caused by the sampling of the population of massive stars (see discussion in Voss et al., 2009). It is therefore just an effect of the actual realization of the population of massive stars, which yields a higher wind contribution to the 26Al than an average cluster (with the same properties). Also the slope of the time-profile is relatively steep, and it is therefore clear that small errors in the estimates of the cluster ages (especially of the youngest clusters) can have a relatively large influence on the conclusions from the population synthesis.
In the middle panel of Fig. 3 we show the energy injected into the ISM from the stars, predicted by the population synthesis. The total output can be seen to have risen to erg s-1 about 10 Myr ago, and then slowly increased to the current output of erg s-1. The energy budget of the associations in the Carina Complex was studied by Smith (2006); Smith & Brooks (2007), who found the stellar wind output to be erg s-1. This result did not take supernova contributions into account, and did not include NGC 3293. Taking these differences into account, their results are in good agreement with our population synthesis. They also estimated the mechanical energy needed to create the superbubble surrounding the region to be erg. This corresponds to erg s-1, assuming a constant power over the last 5 Myr. The horizontal dashed line in the middle panel of Fig. 3 shows this observational estimate. It has been multiplied by a factor of 10 to account for the observations from other regions showing that only a fraction of % of the kinetic energy goes into the expansion of the bubble (e.g. Brown et al., 1995; Cooper et al., 2004). The height of the line is in good agreement with the expectations, arguing for a similar energy efficiency of creating the superbubble in the Carina region. Our population synthesis predictions for the emission of hydrogen ionized UV photons are shown in the lower panel of Fig. 3. The UV emission was also studied by Smith & Brooks (2007). They found a rate just below s-1, in good agreement with our population synthesis model. From observations of the radio continuum, they deduced that the ISM around the Carina region absorbs ph s-1 of UV radiation, shown as the horizontal dashed line in the lower panel of Fig. 3 and the remaining % of the flux leak out from the region.
5 Discussion
5.1 Comparison with other young associations
Other regions were investigated recently. Population synthesis models of the regions Orion (Voss et al., 2010), Cygnus (Martin et al., 2009; Martin et al., 2010) and Sco-Cen (Diehl et al., 2010) were found to be consistent with observations. Similar to the results presented above, the analysis of both Orion and Cygnus supports theoretical models with high 26Al ejection from the WR-winds of the massive stars. However, due to the high statistical fluctuations of the 26Al output from individual regions, caused by the random sampling of the IMF each result is of low significance ().
An interesting aspect of comparing different regions is the differences in their star-formation histories. In Orion and Sco-Cen the 26Al output is dominated by populations of stars with ages Myr, where the ejection from supernova explosions is most important. Therefore more than 50% of the 26Al in these regions is expected to be emitted by the supernovae. Therefore these observations alone could not be used to distinguish between models with strong wind ejection, as all the 26Al could be emitted by supernovae if their yields were enhanced by a factor of 2. In the Carina and Cygnus regions the situation is different. In Carina we have estimated that only % of the signal comes from supernovae, and also in Cygnus the wind contribution dominates (Martin et al., 2009; Martin et al., 2010). An increase of the supernova ejection by a factor of would be needed to explain the signal with 26Al from supernovae alone, but this is not consistent with the observations of Orion, and Sco-Cen. It is therefore clear that the 26Al signals observed from Carina and Cygnus are not due to supernova ejecta alone, and a strong wind ejection component is necessary. This is therefore the strongest evidence of 26Al ejection in WR-winds to date.
5.2 Possible explanations for the high 26Al signal
We have shown above, that the most likely observed 26Al
signal is higher than the theoretical predictions, even for the
models with the strongest wind ejection.
Here we discuss possible effects that were not taken into account
in our analysis:
Hidden stars:
Recent results have shown that the population of OB stars in the
Carina region has been underestimated by a factor of %
(Povich et al., 2011). The extra OB stars are found outside the
clusters discussed above with some of them being in recently
identified clusters and the rest being distributed between
them. The reason these stars were not identified before is the
large absorbing column in front of them, caused by molecular
clouds in their local environment. The average visual extinction
of the OB candidates of Povich et al. (2011) is , and the
most absorbed candidates have an extinction . As 26Al
is observed with -rays, it is not affected by extinction, and
the hidden population can therefore provide a significant contribution
to the signal. However, we believe that the
hidden population contributes less than expected from the number of OB stars.
The large absorbing columns indicate that many of the stars are still
inside or near their parent molecular clouds. For example the
Treasury Chest cluster is estimated to be younger than 1 Myr
(Smith et al., 2005).
Groups of stars with the age where the 26Al signal is strongest
(3–10 Myr) provide enough kinetic energy and UV radiation to ionize/disperse
nearby clouds, and
are therefore much less likely to be obscured. On the other
hand some of the OB stars could be located behind other clouds. In the
Cygnus region, this is for example the case of Cygnus OB2, which is
heavily obscured, but contributes significantly to the 26Al signal
(Martin et al., 2009; Martin et
al., 2010). In Cygnus the contribution from a
diffuse population of massive stars was estimated to be %.
From the discussion above we believe that 26Al from
stars outside clusters and in hidden clusters that were not taken
into account in our analysis does contribute to the signal, but with
less than % (corresponding to the fraction of hidden massive stars)
of the total signal.
Nucleosynthesis uncertainties:
There are large uncertainties in the modelling of supernova
explosions (Woosley et al., 1995; Limongi & Chieffi, 2006). Furthermore the
uncertainties in the
nuclear reaction rates responsible for the formation of 26Al ejected
in the supernova explosions lead to uncertainties of a factor
(Iliadis et al., 2011). Both could explain the
results, if only the Carina region was observed. However, as discussed
above, the observations of the Sco-Cen and Orion regions
contradict strongly enhanced supernova yields. The nuclear
reaction rates responsible for the production of 26Al ejected
in stellar winds are much better constrained (Iliadis et al., 2011),
and the strong signal can therefore not be explained by the
uncertainties of these.
Binaries:
The yields from close binaries are challenging to quantify
(Langer et al., 1998). Such systems experience mass transfer episodes,
which can lead to
enhanced mass loss and mixing and early exposure and ejection of
chemically enriched layers of the stars. Furthermore, tidal forces
affect their rotation and mixing. This can in principle lead
to very high enhancement factors. However, the enhancement in binaries is
concentrated in very few particular systems. Large enhancements in
a few systems would lead to high fluctuations in the 26Al signal
over the sky, which are not seen. We therefore conclude that while
enhanced systems might explain a modest difference between the
theoretical models and the observations, most of the 26Al is
being ejected by “normal” stars.
Very massive stars:
There is growing evidence that stars can initially be more massive than the limit of 120 assumed in our study (Figer, 2005; Koen, 2006; Crowther et al., 2010; Bestenlehner et al., 2011), and the fact that many stars are born in multiple systems can both increase the yields significantly. Indeed, both have been invoked to explain properties of stars in the Carina Nebula, in particular Carinae. The 26Al yields of stars with masses above 120 have not been studied. However, the yields of stellar models increase relatively strongly with initial mass, and it is therefore likely that initially very massive stars can yield several times the amount of 26Al given by our most massive stellar model. Similar to the binaries, Large enhancements in a few stars would lead to high fluctuations in the 26Al signal over the sky, which are not seen, and we therefore believe that the possible contribution from such very massive stars must be modest.
5.3 Implications for stellar evolution
The effects discussed above are likely to be minor. It is possible that a combination of these effects are enough to account for the observed 26Al signal being higher than the highest theoretical model, including both a large wind and a large supernova contribution. We do therefore not find that the apparent discrepancy calls for significant changes in the modelling of massive stars. However, only % of the signal can be explained by 26Al ejected by supernova explosions. As discussed above in Sect. 5.1, the observations of other regions do not allow the supernova yields to be raised by a factor of few, and our results are therefore in support of a strong wind ejection.
Despite the downwards revision of the mass loss rates in the latest stellar evolutionary models (Vink et al., 2000; Meynet & Maeder, 2005), the integrated mass loss has not decreased significantly, and the 26Al ejection has actually increased (Palacios et al., 2005). This is due to the effects of rotation that makes the stars spend longer time in states with high mass loss rates, and the meridional circulation is increased, lifting 26Al to the surface. A further downwards revision of the wind mass loss rates (as suggested by e.g. Fullerton et al., 2006), would reduce the wind yields significantly, and our analysis might therefore be evidence against such a downwards revision (see also the discussion in Voss et al., 2010). Similarly, non-rotating models with current wind mass-loss prescriptions have low wind ejection of 26Al, and our results are therefore in support of rotational effects being significant.
5.4 Conclusions
We have studied the population of massive stars in the Carina region. Our analysis of the ejection of kinetic energy into the ISM and the emission of ionizing UV radiation, and our results are in agreement with previous theoretical estimates and observational results. 26Al is an important tracer of massive star evolution and the interaction between massive stars and their surroundings. We have constrained the 26Al signal from the region around the Carina Nebula, and shown that it is consistent with coming from the populations of massive stars in this region. Our results show that most % of the 26Al was ejected by the winds of massive stars. This result strongly favours rotating stellar evolutionary models, and is in disagreement with the suggested further reductions of the mass-loss rates due to clumping beyond what is included in the latest generation of models.
Acknowledgements.
This research is supported by NWO Vidi grant 016.093.305. PM acknowledges support from the European Community via contract ERC-StG-200911. Based on observations with INTEGRAL, an ESA project with instruments and science data centre funded by ESA member states.References
- Allen & Hillier (1993) Allen, D. A., & Hillier, D. J. 1993, PASA, 10, 338
- Bestenlehner et al. (2011) Bestenlehner, J. M., Vink, J. S., Gräfener, G., et al. 2011, A&A, 530, L14
- Brown et al. (1995) Brown, A. G. A., Hartmann, D., & Burton, W. B. 1995, A&A, 300, 903
- Cappa et al. (2008) Cappa, C., Niemela, V. S., Amorín, R., & Vasquez, J. 2008, A&A, 477, 173
- Carraro & Patat (2001) Carraro, G., & Patat, F. 2001, A&A, 379, 136
- Cooper et al. (2004) Cooper, R. L., Guerrero, M. A., Chu, Y.-H., Chen, C.-H. R., & Dunne, B. C. 2004, ApJ, 605, 751
- Crowther et al. (2010) Crowther, P. A., Schnurr, O., Hirschi, R., Yusof, N., Parker, R. J., Goodwin, S. P., & Kassim, H. A. 2010, MNRAS, 408, 731
- Diehl et al. (2010) Diehl, R., Lang, M.G., Martin, P., et al. 2010, A&A, 522, A51
- Evans et al. (2005) Evans, C. J., Smartt, S. J., Lee, J.-K. et al. 2005, A&A, 437, 467
- Feinstein et al. (1980) Feinstein, A., Moffat, A. F. J., & Fitzgerald, M. P. 1980, AJ, 85, 708
- Feinstein (1981) Feinstein, A. 1981, PASP, 93, 202
- Feinstein (1995) Feinstein, A. 1995, Revista Mexicana de Astronomia y Astrofisica Conference Series, 2, 57
- Figer (2005) Figer, D. F. 2005, Nature, 434, 192
- Fullerton et al. (2006) Fullerton, A. W., Massa, D. L., & Prinja, R. K. 2006, ApJ, 637, 1025
- Hanson (2003) Hanson, M. M. 2003, ApJ, 597, 957
- Iliadis et al. (2011) Iliadis, C., Champagne, A., Chieffi, A., & Limongi, M. 2011, arXiv:1101.5553
- Knödlseder et al. (1996) Knödlseder, J., Bennett, K., Bloemen, H., Diehl, R., Hermsen, W., Oberlack, U., Ryan, J., & Schönfelder, V. 1996, A&AS, 120, 327
- Koen (2006) Koen, C. 2006, MNRAS, 365, 590
- Kroupa (2001) Kroupa, P. 2001, MNRAS, 322, 231
- Langer et al. (1998) Langer, N., Braun, H., & Wellstein, S. 1998, Nuclear Astrophysics , 18
- Limongi & Chieffi (2006) Limongi, M., Chieffi, A., 2006, ApJ, 647, 483
- Martins et al. (2005) Martins, F., Schaerer, D., & Hillier, D. J. 2005, A&A, 436, 1049
- Martin et al. (2009) Martin, P., Knödlseder, J., Diehl, R., & Meynet, G. 2009, A&A, 506, 703
- Martin et al. (2010) Martin, P., Knödlseder, J., Meynet, G., & Diehl, R. 2010, A&A, 511, A86
- Massey & Johnson (1993) Massey, P., & Johnson, J. 1993, AJ, 105, 980
- Meynet & Maeder (2005) Meynet, G. & Maeder, A., 2005, A&A, 429, 581-598
- Meynet et al. (1997) Meynet, G., Gould, M., Prantzos, N., et al., 1997, A&A, 320, 460
- Mucciarelli et al. (2011) Mucciarelli, P., Preibisch, T., & Zinnecker, H. 2011, A&A, 533, A121
- Palacios et al. (2005) Palacios, A., Meynet, G., Vuissoz, C., et al., 2005, A&A, 429, 613-624
- Patat & Carraro (2001) Patat, F., & Carraro, G. 2001, MNRAS, 325, 1591
- Plüschke (2001) Plüshcke, S. 2001, Phd thesis, TU Munich
- Povich et al. (2011) Povich, M. S., Townsley, L. K., Broos, P. S., et al. 2011, ApJS, 194, 6
- Prantzos & Diehl (1996) Prantzos, N., & Diehl, R., 1996, Phys. Rep., 267, 1
- Preibisch et al. (2011) Preibisch, T., Ratzka, T., Kuderna, B., et al. 2011, A&A, 530, A34
- Preibisch et al. (2011) Preibisch, T., Schuller, F., Ohlendorf, H., Pekruhl, S., Menten, K. M., & Zinnecker, H. 2011, A&A, 525, A92
- Preibisch et al. (2011) Preibisch, T., Hodgkin, S., Irwin, M., al. 2011, ApJS, 194, 10
- Rauw et al. (2007) Rauw, G., Manfroid, J., Gosset, E., Nazé, Y., Sana, H., De Becker, M., Foellmi, C., & Moffat, A. F. J. 2007, A&A, 463, 981
- Robberto et al. (2010) Robberto, M., Soderblom, D. R., Scandariato, G., et al. 2010, AJ, 139, 950
- Salpeter (1955) Salpeter, E. E. 1955, ApJ, 121, 161
- Schaller et al. (1992) Schaller, G., Schaerer, D., Meynet, G., & Maeder, A. 1992, A&AS, 96, 269
- Smith (2002) Smith, N. 2002, MNRAS, 337, 1252
- Smith (2006) Smith, N. 2006, MNRAS, 367, 763
- Smith et al. (2005) Smith, N., Stassun, K. G., & Bally, J. 2005, AJ, 129, 888
- Smith & Brooks (2007) Smith, N., & Brooks, K. J. 2007, MNRAS, 379, 1279
- van der Hucht (2001) van der Hucht, K. A. 2001, VizieR Online Data Catalog, 3215, 0
- Vink et al. (2000) Vink, J. S., de Koter, A., & Lamers, H. J. G. L. M. 2000, A&A, 362, 295
- Voss et al. (2010) Voss, R., Diehl, R., Vink, J. S., & Hartmann, D. H. 2010, arXiv:1005.3827
- Voss et al. (2009) Voss, R., Diehl, R., Hartmann, D. H., Cerviño, M., Vink, J. S., Meynet, G., Limongi, M., & Chieffi, A. 2009, A&A, 504, 531
- Walborn (1995) Walborn, N. R. 1995, Revista Mexicana de Astronomia y Astrofisica Conference Series, 2, 51
- Wang et al. (2011) Wang, J., Feigelson, E. D.; Townsley, L. K., et al. 2011, ApJS, 194, 11
- Weidner & Vink (2010) Weidner, C., & Vink, J. 2010, arXiv:1010.2204
- Woosley et al. (1995) Woosley, S.E., Langer, N., Weaver, T.A., 1995, ApJ, 448, 315
- Zorec et al. (2009) Zorec, J., Cidale, L., Arias, M. L., Frémat, Y., Muratore, M. F., Torres, A. F., & Martayan, C. 2009, A&A, 501, 297