Chemical complexity in NGC 1068
Abstract
We aimed to study the chemistry of the circumnuclear molecular gas of NGC 1068, and to compare it with those of the starburst galaxies M 82 and NGC 253. Using the IRAM-30 m telescope, we observed the inner 2 kpc of NGC 1068 between 86.2 GHz and 115.6 GHz. We identified 35 spectral features, corresponding to 24 different molecular species. Among them, HC3N, SO, N2H+, CH3CN, NS, 13CN, and HN13C are detected for the first time in NGC 1068. Assuming local thermodynamic equilibrium (LTE), we calculated the column densities of the detected molecules, as well as the upper limits to the column densities of some undetected species. The comparison among the chemistries of NGC 1068, M 82, and NGC 253, suggests that, apart from X-rays, shocks also determine the chemistry of NGC 1068. We propose the column density ratio between CH3CCH and HC3N as a prime indicator of the imprints of starburst and AGN environments in the circumnuclear interstellar medium. This ratio is, at least, 64 times larger in M 82 than in NGC 1068, and, at least, 4 times larger in NGC 253 than in NGC, 1068. Finally, we used the UCL_CHEM and UCL_PDR chemical codes to constrain the origin of the species, as well as to test the influence of UV radiation fields and cosmic rays on the observed abundances.
1 Introduction
The proximity of NGC 1068 (D=14.4 Mpc, corresponding to a spatial scale on 1 pc, [24]) as well as its Seyfert 2 activity turn this galaxy into the best target to study the chemical composition of molecular clouds in the vicinity of an AGN. The molecular material close to the central engines of AGN is thought to be heavily pervaded by X-ray radiation originating in the nuclear accretion disk [18]. This strong radiation field has been claimed to be responsible for the observed abundance ratios of some species, such as HCO+/HCN, or HNCO/CS, which appear to be clearly different between AGN and starburst environments [14, 16, 20]. Observations of NGC 1068 in a number of other molecules, such as SiO, HOC+, and CN, have revealed a peculiar chemistry interpreted as the result of a giant X-ray dominated region (XDR) in its nucleus, where shocks could be also playing a role [25, 10, 17]. However, an overall chemical study of NGC 1068 has not been done so far due to a lack of unbiased observations of a large number of molecules. Here we present a molecular inventory of this archetypal AGN, which is similar to those already obtained for the starburst galaxies NGC 253 [19] and M 82 [2].
2 Observations and data analysis
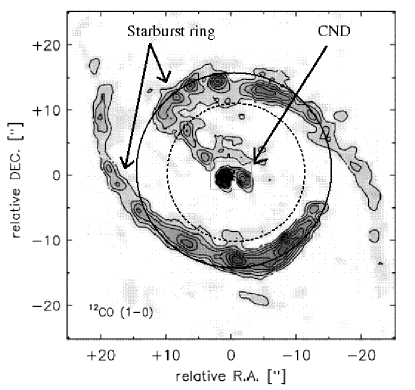
The observations were carried out with the IRAM-30 m telescope (Pico Veleta Observatory, Spain) between October 2009 and July 2010. We observed the circumnuclear disk of NGC1068 at a nominal position 02:42:40.9, = -00:00:46.0. The frequencies range observed is between 86.2 GHz and 115.6 GHz. We used the band E0 of the EMIR receiver and the WILMA autocorrelator. This receiver-backend configuration allowed us to cover 8 GHz simultaneously in the vertical and horizontal polarizations, and led to a channel width spacing of km s-1. The data were calibrated using the standard dual load method. The observations were done wobbling the secondary mirror with a switching frequency of 0.5 Hz and a beam throw of 220′′ in azimuth. We checked the pointing accuracy every hour towards the nearby bright continuum sources 2251+158 and 0113-118. The pointing corrections were always better than 4′′. The focus was also checked at the beginning of each run and during sunsets. The rejection of the image sideband was better than 10 dB along the band. The beam sizes ranged from 21′′ to 29′′. This implies that the observations at the lowest frequencies could have picked up some emission from the starburst ring, while the highest frequencies only detected the CND emission (see Fig. 1). We assume that, in the worse case scenario, the starburst ring contribution is lower than 30% [25].
The observed spectra were converted from antenna temperatures () to main beam temperatures () using the relation , where is the forward efficiency of the telescope, which values were between 0.94 and 0.95, and is the main beam efficiency, ranging from 0.77 to 0.81. Linear baselines were subtracted in all cases. The rms achieved is mK across the whole survey. The data were also corrected by the beam dilution effect as , where is the source averaged brightness temperature, is the source size and is the beam size. Based on NGC 1068 interferometric observations of 12CO, HCN, and 13CO [12, 23], we assumed an average source size of for all the molecular species.
3 Molecules in NGC 1068
We detected a total of 35 spectral features towards the AGN of NGC1068. There are no new extragalactic molecular detections. However, seven species or isotopologues are detected for the first time in this galaxy, namely HC3N, SO, N2H+, CH3CN, NS, 13CN, and HN13C. The line identification largely follows the method explained in [2]. We fitted Gaussian profiles to all the detected species. The resulting Gaussian parameters, as well as figures showing the data, and more specific comments about each molecule, will be presented in Aladro et al in preparation.
Assuming local thermodynamic equilibrium conditions and optically thin emission, we used rotation diagrams to determine the column densities () of the detected species [11]. However, some molecules, such as CO, HCN or HCO+, seem to be moderately optically thick in NGC 1068, as will be discussed in Aladro et al. in preparation. Therefore, their column densities are likely to be higher. On the other hand, in those cases where we detected only one transition of a given molecule, we assumed a rotational temperature () of K. The value might have an important impact in the column density determination only in extreme cases, such as K or K. Table 1 lists the obtained for each molecule, as well as the upper limits to the column densities of some other undetected molecules in NGC 1068.
We found that the CO species and their carbon and oxygen isotopologues, 13CO and C18O, are the most abundant molecules. On the contrary, HOC+ is the less abundant of the detected species in our survey. We took from the literature some molecular transitions that lie outside our 3 mm frequency range (see Table 1 for references). Few molecules show two different components in the Boltzmann diagrams. This is the case of 12CO, 13CO and CS. One of such components belongs to a colder gas with higher column densities, while the other one shows warmer rotational temperatures and lower column densities. This latter gas component is likely to arise from the inner regions of the molecular clouds.
| Molecule | [cm-2] | Molecule | [cm-2] | Molecule | [cm-2] |
|---|---|---|---|---|---|
| 12CO a | HCO | H2CO | |||
| SO N | OCS | ||||
| 13CO a | NS N | CH2NH | |||
| 13CN N | CH3CCH | ||||
| C18O b | HNCO | SO2 | |||
| C2H | N2H+ N | c-C3H | |||
| CN | C34S b | H2CS | |||
| HCN | H13CN | C2S | |||
| CH3OH | H13CN | HOCO+ | |||
| CS c | SiO | 13CS | |||
| H13CO+ | NH2CN | ||||
| HC3N N | CH3CN N | ||||
| HCO+ e | HN13C N | ||||
| HNC d | HOC+ |
-
N: New detection in NGC 1068.a Using extra detections by [13]. b Using extra detections by [20]. c Using extra detections by [5]. d Using extra detections by [22]. e Using extra detections by [16]. To calculate the upper limits of the NGC 1068 column densities, we assumed for all the cases a K and a width of 230 km s-1.
4 On the origin of the molecular emission
We used the UCL_CHEM code [26, 27] as well as the UCL_PDR code [6] to model the molecular emission of the detected species shown in Table 1. UCL_CHEM is a depth- and time-dependent chemical model that consists of two separated phases. In phase I, the free-fall collapse of a molecular cloud with atomic composition is simulated. The hydrogen density, initially 102 cm-3, is increased until it reaches a final density (free parameter), while the temperature remains low and constant, at 10 K. During this phase, atoms and molecules deplete on to the grains, and surface reactions, including hydrogenation, take place. Phase II simulates the chemistry of the molecular cloud after a source of radiation is switched on. We computed the temperatures at different visual extinctions using the UCL_PDR code. During Phase II we assume instantaneous evaporation of the molecular ices. Therefore, only gas-phase reactions take place during this second phase. We have considered 205 different molecules, of which 51 are surface species. 2345 reactions, taken from the UMIST database (http://www.udfa.net, [28]), are involved in the calculations.
Table 2 shows the values of the main parameters of UCL_CHEM. We used the NGC 1068 metallicity (1.056, [29]), and the standard initial element abundance ratios of C, O, N, S, He, Mg, and Si, compiled by [3]. We run a set of four models varying the radiation field and the cosmic-ray ionization rate, in order to sample a variety of conditions that may co-exist in the AGN. We used a number of assumptions when running our models. First, we used a constant density for Phase II. However, molecules are expected to trace environments of different densities, probably ranging from 103 cm-3 to 106 cm-3. Therefore, our models do not aim to simulate density gradients within molecular clouds. Second, we took a visual extinction of mag as an example of a photon-dominated region (PDR), and a mag as an example of a molecular cloud with a dense core. Third, in some cases molecular abundances vary with time. This mainly occurs in the dense cores of the simulated molecular clouds, where species do not reach a steady-state. We thus averaged the abundances over a range of time from to years. However, some molecules may have shorter or larger life cycles, and therefore their abundances may differ.
As can be seen in Table 2, the four models differ in the values of the radiation fields ( and 1000 in Harbing units) and the cosmic-ray ionization rate ( 1.310-17 s-1 and 1.310-15 s-1). Model a aims to simulate the physical conditions of hot cores, which have both low external radiation fields and cosmic ray ionization rates; in model b we increased the radiation field by a factor of 1000 with respect to model a in order to see the effects of strong UV fields in the chemistry of the molecular clouds; on the contrary, model c has low UV field, but a high cosmic ray rate; finally, model d has high values of both parameters. Table 3 shows whether, according to each model, the molecules are tracing dense gas regions, PDRs (i.e. the external zones of the molecular clouds), or both. Some species seem to not be strongly affected by the variations of UV and cosmic ray fields. Examples are C2H and CN, which always trace PDRs; or CH3OH, CS, SO, HNCO and SiO, which always trace dense gas regions. On the other hand, other molecules such as HCO+, HNC or N2H+, trace dense gas regions or PDRs depending on the physical conditions.
| Parameter | Model a | Model b | Model c | Model d |
|---|---|---|---|---|
| Initial H density (phase I) | 102 cm-3 | 102 cm-3 | 102 cm-3 | 102 cm-3 |
| Final H density (phases I and II) | 106 cm-3 | 106 cm-3 | 106 cm-3 | 106 cm-3 |
| Temperature (phase I) | 10 K | 10 K | 10 K | 10 K |
| Temperature (phase II) | 300 K | 300 K | 300 K | 300 K |
| Visual extinction | 2 & 10 mag | 2 & 10 mag | 2 & 10 mag | 2 & 10 mag |
| Gas-to-dust mass ratio | 100 | 100 | 100 | 100 |
| External UV radiation intensity | 1 Habing | 1000 Habing | 1 Habing | 1000 Habing |
| Cosmic-ray ionization rate | 1.310-17 s-1 | 1.310-17 s-1 | 1.310-15 s-1 | 1.310-15 s-1 |
| Molecule | Model a | Model b | Model c | Model d | ||||
|---|---|---|---|---|---|---|---|---|
| PDR | Dense Gas | PDR | Dense gas | PDR | Dense gas | PDR | Dense gas | |
| CO | ✓ | ✓ | ✓ | ✓ | ✓ | ✓ | ||
| C2H | ✓ | ✓ | ✓ | ✓ | ||||
| CN | ✓ | ✓ | ✓ | ✓ | ||||
| HCN | ✓ | ✓ | ✓ | ✓ | ✓ | |||
| CH3OH | ✓ | ✓ | ✓ | ✓ | ||||
| CS | ✓ | ✓ | ✓ | ✓ | ||||
| HC3N | ✓ | ✓ | ✓ | ✓ | ✓ | |||
| HCO+ | ✓ | ✓ | ✓ | ✓ | ✓ | |||
| HNC | ✓ | ✓ | ✓ | ✓ | ✓ | ✓ | ||
| HCO | ✓ | ✓ | ✓ | ✓ | ✓ | |||
| SO | ✓ | ✓ | ✓ | ✓ | ||||
| NS | ✓ | ✓ | ✓ | ✓ | ✓ | |||
| HNCO | ✓ | ✓ | ✓ | ✓ | ||||
| N2H+ | ✓ | ✓ | ✓ | ✓ | ||||
| SiO | ✓ | ✓ | ✓ | ✓ | ||||
| CH3CN | ✓ | ✓ | ✓ | ✓ | ||||
| HOC+ | ✓ | ✓ | ✓ | ✓ | ✓ | ✓ | ✓ | ✓ |
| CH3CCH | ✓ | ✓ | ✓ | ✓ | ||||
-
Ticks show whether each molecules trace PDRs/CRDRs, dense gas, or both. Boldface ticks indicate when the abundances given by the models match the observed abundances within one order of magnitude.
5 Molecular abundances in AGN and starburst galaxies
We aimed to compare the molecular abundances of NGC 1068 with those of the starburst galaxies M 82 and NGC 253. These are the three extragalactic objects whose chemical compositions are better known so far. NGC 253 and M 82 were also targets of unbiased molecular line surveys in the mm range, with 25 and 18 molecular species detected in their respective nuclear regions [19, 2]. The starburst in the center of M 82 is old, with an average stellar population age of Myr [15]. The nuclear starburst, together with a high supernova rate, create strong UV fields, and thus PDRs dominate the nucleus of M 82. On the other hand, NGC 253 is claimed to be in an early stage of the starburst evolution [20, 1], with younger stellar populations in its nucleus ( Myr [7]) where the PDRs, although present, do not drive the heating of molecular clouds. Instead, the nucleus of NGC 253 is dominated by large-scale shocks between molecular complexes. A detailed comparison of the M 82 and NGC 253 chemistries done by [2] showed that the ISM in both galaxies have different composition, and that molecular abundances can be used to distinguish the physical processes that dominate galaxy nuclei.
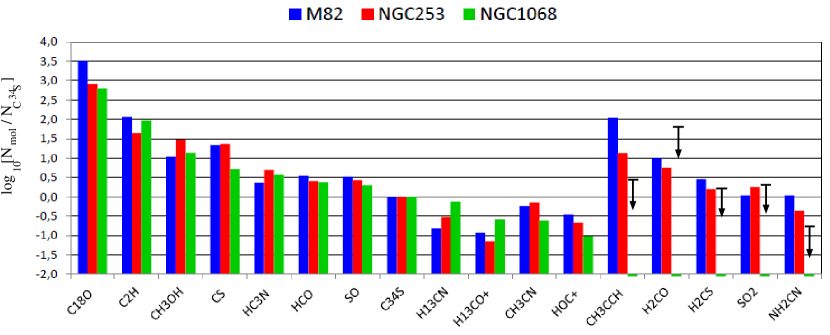
Figure 2 shows the molecular abundances in the central regions of M 82, NGC 253, and NGC 1068. The molecular ratios were calculated with respect to C34S because, apart from being optically thinner than the main sulfur isotopologue, it does not seem to be significantly affected by the type of nuclear activity in galaxies [20]. Furthermore, C34S has similar column densities in the three galaxies (few times cm-3, [2]). We note that while M 82 and NGC 253 are located at approximately the same distance, Mpc [8], NGC 1068 lies nearly five times further, at 14.4 Mpc [24]. While the comparison of the column densities in these galaxies would be biased by the distance, this should not affect the comparison of the fractional abundances. On the other hand, because of the different distances the IRAM-30m beam covered the central kiloparsecs of the AGN, while for the starburst galaxies, the beam covered the inner 360 pc.
Among all the species compared, only H13CN and H13CO+ show higher abundances with respect to C34S in NGC 1068 than M 82 and NGC 253. On the other hand, C2H, CH3OH, HC3N, HCO, and SO show similar abundances in all three galaxies (within a factor three). A third group is composed by those molecules that are clearly more abundant in M 82 and NGC 253 than in NGC 1068. From this group it can be drawn the clearest chemical differentiation between starbursts and AGN activities. Among the molecules detected in the three galaxies, CS/C34S is almost 5 times higher in NGC 253 than in NGC 1068. Similarly, CH3CN/C34S shows a difference of a factor 3 between NGC 253 and NGC 1068, while HOC+/C34S is a factor 4 more abundant in M 82 than in NGC 1068. It is remarkable that these three molecular ratios are very similar in M 82 and NGC 253 (see Fig. 2). Moreover, some of the biggest chemical differences are given by those molecules that were clearly detected in both starburst galaxies, but not in NGC 1068, such as CH3CCH, H2CO, H2CS, SO2 and NH2CN. Among them, CH3CCH/C34S is the ratio showing the highest contrast, being times higher in M 82 than in NGC 1068 and times higher in NGC 253 than in NGC 1068. Therefore, we computed other fractional abundances of CH3CCH with respect to the molecules having similar abundances in the three galaxies. We found that the most striking differences among the AGN and the starburst galaxies are given by R and R. CH3CCH and HC3N are claimed to be tracers of dense gas in galaxies [1], while C2H might be tracing both PDRs and dense gas regions [4]. To avoid comparisons of molecules that might be arising from different regions, we select [CH3CCH/HC3N] as the best ratio to chemically differentiate between AGN and starburst galaxies. We found that R when comparing M 82 with NGC 1068, and R when comparing NGC 253 with NGC 1068. We note that a factor of, at least, 64 is much larger than the R commonly used to differentiate between AGN and starburst environments [14, 16]. On the other hand, our upper limit to the column density of CH3CCH in NGC 1068 is not very tight, so the molecular ratios could be even larger. The values found for R indicate that the dense ISM in the NGC 1068 nucleus resembles more NGC 253 than M 82. This points at the existence of shocks (rather than PDRs) accompanying the strong X-ray fields present in the central regions of NGC 1068.
6 Conclusions
We carried out a molecular line survey with the IRAM 30-m telescope towards the active galactic nucleus of NGC 1068. We covered the frequencies between 86.2 GHz and 115.6 GHz, detecting a total of 35 spectral line features. Seven species, or their carbon isotopologues, are detected for the first time in this galaxy, namely HC3N, SO, N2H+, CH3CN, NS, 13CN, and HN13C.
Some molecules, such as CH3CCH, c-C3H2, OCS, SO2, NS, HOCO+, and NH2CN, are not detected in NGC 1068. We compared the molecular abundances of the NGC 1068 nucleus (claimed to be a giant XDR, e.g. [10]), with those of M,82 (claimed to be a giant PDR, [9]), and NGC 253 (claimed to be dominated by low-velocity shocks, [19]). We found that the ratio R shows the largest differences among the three galaxies. Specifically, R is at least 64 times larger in M 82 than in NGC 1068, and at least 4 times larger in NGC 253 than in NGC 1068. Therefore, this ratio can be used to disentangle between AGN and starburst physical environments. Furthermore, R indicates that UV fields are not probably strong enough in the inner 2 kpc of NGC 1068. Instead, shocks, could be playing a secondary role, after X-rays.
We used the time-dependent chemical (UCL_CHEM) and PDR (UCL_PDR) models to simulate the chemistry in molecular clouds under several physical conditions that might co-exist in AGN. We note, however, that our aim was not to simulate the particular environment in the center of NGC 1068, but to study the influence of UV and cosmic ray fields in the abundances of a large number of molecules. We found that some species seem to always trace photon-dominated regions and/or cosmic ray-dominated regions independently of the strength of the UV and cosmic ray fields (such as C2H and CN), while other species always trace dense gas regions (e.g. CH3OH, CS, SO, HNCO, and SiO). Finally, some molecules might be arising from the inner and/or outer layers of the molecular clouds depending on the strength of the external radiation fields (examples are HCO+, HNC and N2H+).
References
References
- [1] Aladro, R., Martín-Pintado, J., Martín, S., Mauersberger, R., & Bayet, E. 2011a, A&A, 525, A89
- [2] Aladro, R., Martín, S., Martín-Pintado, J., et al. 2011b, A&A, 535, A84
- [3] Bayet, E., Viti, S., Williams, D. A., & Rawlings, J. M. C. 2008, ApJ, 676, 978
- [4] Bayet, E., Viti, S., Williams, D. A., Rawlings, J. M. C., & Bell, T. 2009a, ApJ, 696, 1466
- [5] Bayet, E., Aladro, R., Martín, S., Viti, S., & Martín-Pintado, J. 2009b, ApJ, 707, 126
- [6] Bell, T. A., Roueff, E., Viti, S., & Williams, D. A., 2006, MNRAS, 371, 1865
- [7] Fernández-Ontiveros, J. A., Prieto, M. A., & Acosta-Pulido, J. A., 2009, MNRAS, 392, L16
- [8] Freedman, W. L., et al. 1994, ApJ, 427, 628
- [9] Fuente, A., García-Burillo, S., Gerin, M., et al. 2005, ApJL, 619, L155
- [10] García-Burillo, S., et al. 2010, A&A, 519, A2
- [11] Goldsmith, P. F., & Langer, W. D. 1999, ApJ, 517, 209
- [12] Helfer, T. T., & Blitz, L. 1995, ApJ, 450, 90
- [13] Israel, F. P. 2009, A&A, 493, 525
- [14] Kohno, K., Matsushita, S., Vila-Vilaró, B., et al. 2001, The Central Kiloparsec of Starbursts and AGN: The La Palma Connection, 249, 672
- [15] Konstantopoulos, I. S., Bastian, N., Smith, L. J., Westmoquette, M. S., Trancho, G., & Gallagher, J. S. 2009, ApJ, 701, 1015
- [16] Krips, M., Neri, R., García-Burillo, S., et al. 2008, ApJ, 677, 262
- [17] Krips, M., Martín, S., Eckart, A., et al. 2011, ApJ, 736, 37
- [18] Maloney, P. R., Hollenbach, D. J., & Tielens, A. G. G. M. 1996, ApJ, 466, 561
- [19] Martín, S., Martín-Pintado, J., & Mauersberger, R. 2006, A&A, 450, L13
- [20] Martín, S., Martín-Pintado, J., & Mauersberger, R. 2009, ApJ, 694, 610
- [21] Myers, S. T., & Scoville, N. Z. 1987, ApJl, 312, L39
- [22] Pérez-Beaupuits, J. P., Spaans, M., van der Tak, F. F. S., et al. 2009, A&A, 503, 459
- [23] Schinnerer, E., Eckart, A., Tacconi, L. J., Genzel, R., & Downes, D. 2000, ApJ, 533, 850
- [24] Tully, R. B. 1988, Nearby Galaxies Catalog, Cambridge University Press
- [25] Usero, A., García-Burillo, S., Fuente, A., Martín-Pintado, J., & Rodríguez-Fernández, N. J. 2004, A&A, 419, 897
- [26] Viti, S., & Williams, D. A. 1999, MNRAS, 305, 755
- [27] Viti, S., Collings, M. P., Dever, J. W., McCoustra, M. R. S., & Williams, D. A. 2004, MNRAS, 354, 1141
- [28] Woodall, J., Agúndez, M., Markwick-Kemper, A. J., & Millar, T. J. 2007, A&A, 466, 1197
- [29] Zaritsky, D., Kennicutt, R. C., Jr., & Huchra, J. P. 1994, ApJ, 420, 87