J/ polarization in collisions
at = 200 GeV in STAR ††thanks: Presented at Strangeness in Quark Matter, 18-24 September 2011 Polish Academy of Arts and Sciences, Cracow, Poland
Abstract
In this paper, J/ polarization at mid-rapidity in collisions at
= 200 GeV measured in the STAR experiment at RHIC is reported. J/ production is analyzed via the dielectron decay channel. J/ polarization is extracted from the decay angular distribution in the helicity frame. The J/ polarization is measured at transverse momentum range (2 - 6) GeV/ and is found to be consistent with Color Singlet Model ( CSM), Color Octet Model (COM) predictions and with no polarization within current uncertainties.
13.88.+e, 13.20.Gd, 14.40.Lb
1 Introduction
A number of models with different J/ production mechanisms are able to describe the measured J/ production cross section reasonably well. It suggests that other observables are needed to discriminate between different J/ production models. J/ spin alignment, commonly named as J/ polarization, can be used as such an observable since various models have different dependent predictions on the J/ polarization.
The Color Evaporation Model (CEM) describes J/ cross sections measured in many experiments reasonably well but has no prediction power regarding the J/ polarization. The Color Singlet Model (CSM) [1] predicts longitudinal J/ polarization in the helicity frame at low and mid at mid-rapidity. That recent calculations of the CSM for the yield differential in show better agreement with RHIC data at low and mid than earlier CSM calculations and the result for J/ polarization is in good agreement with the PHENIX data. Non-relativistic quantum chromodynamics (NRQCD) effective theory, also known as Color Octet Model (COM) predicts transverse polarization at high J/ , 5 GeV/ which is in disagreement with the polarization measurement from the CDF experiment at FermiLab [2]. On the other hand a tuned NRQCD predicts longitudinal J/ polarization at 1.5 5 GeV/ at mid-rapidity and is able to qualitatively describe the PHENIX J/ polarization measurements as well as the cross section measurements [3].
The measurement of J/ polarization at 5 GeV/ is expected to have discrimination power against different models of J/ production since, e.g., CSM and COM predict different polarization in that J/ region.
1.1 Decay angular distribution
In this study, J/ polarization is analyzed via the angular distribution of the electron decay from charmonium in the helicity frame [4]. The angular distribution is derived from the density matrix elements of the production amplitude using parity conservation rules. Polar angle is the angle between the positron momentum vector in the J/ rest frame and J/ momentum vector in the laboratory frame.
The angular distribution integrated over the azimuthal angle is parametrized:
| (1) |
where is the polarization parameter that contains both the longitudinal and transverse components of the J/ cross section. When = 0 there is no polarization, = -1 means full longitudinal polarization and = 1 corresponds to full transverse polarization.
2 Data analysis
In this analysis, data recorded in 200 GeV collisions in the STAR experiment in year 2009 is used. The analyzed data was sampled from an integrated luminosity of 1.5 and was triggered by the STAR Barrel Electromagnetic Calorimeter (BEMC). The trigger required transverse energy deposited in a single BEMC tower () to be within 2.6 4.3 GeV.
J/ is reconstructed via its dielectron decay channel J/ with branching ratio BR = 5.9%, and is required that at least one of electrons from J/ decay satisfies the trigger conditions. The Time Projection Chamber (TPC), Time Of Flight (TOF) and BEMC detectors are used to reconstruct and identify electrons. The TPC provides information about dE/dx. Information from the TOF is very useful for electron identification and hadron rejection at lower momenta, where electron and hadron dE/dx bands overlap, 0.03 ( = v/) cut was applied at p 1.4 GeV/. In 2009, 72% of the TOF detector was installed. At higher momenta the BEMC can reject hadrons very efficiently. For momenta above 1.4 GeV/ a cut of E/p 0.5 was used, where E is energy deposited in a single BEMC tower (for electrons E/p ratio is expected to be 1).
2.1 J/ signal
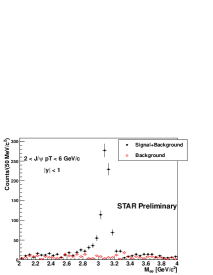
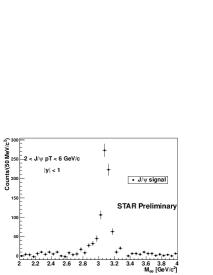
The cuts mentioned above allowed us to obtain a very clear J/ signal with a signal to background ratio of 15 and very high significance of 26. Fig. 1a shows the invariant mass distribution of all combinations of pairs in black (closed circles) and combinatorial background in red (open circles). The combinatorial background is calculated using like-sign technique, from a sum of and pairs. The J/ signal is obtained by subtracting the red histogram (background) from the black histogram (signal+background), see Fig. 1b. The number of J/’s calculated by counting bin entries in the invariant mass range (2.9 - 3.3) GeV/ is 772 29 in the J/ range (2 - 6) GeV/ and 1. The same mass window is used for the polarization analysis for which the signal is split into 3 statistically comparable bins.
3 J/ polarization
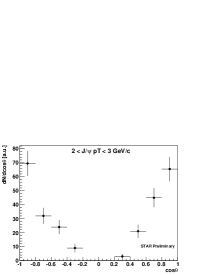
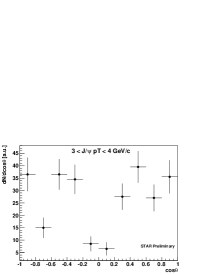
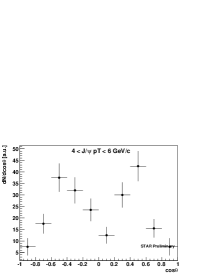
The uncorrected distribution is obtained using the same electron identification cuts as J/ signal, in the J/ range of (2 - 6) GeV/ and 1. The distribution is divided into 3 J/ bins: 2 GeV/, 3 4 GeV/ and 4 6 GeV/. The distributions for the 3 bins, with combinatorial background subtracted are presented in Fig. 2a, 2c, 2e respectively.
3.1 Corrections
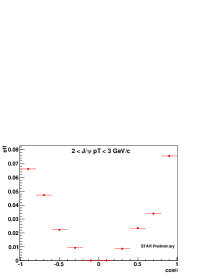
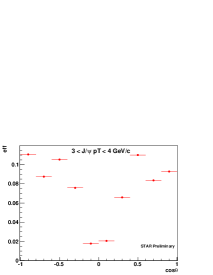
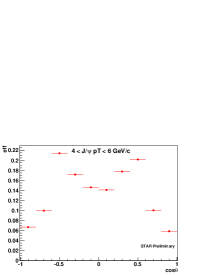
In order to get the corrections, unpolarized Monte Carlo J/’s with uniform and rapidity distributions are embedded into real events and the detector response is simulated. All cuts used in the analysis were applied and the efficiency as a function of J/ transverse momentum was obtained. distributions were also re-weighted according to the real J/ and y shapes. Obtained in that way, corrections were applied to uncorrected distributions from data in 1 GeV/ wide J/ bins. Corrections include acceptance correction, tracking efficiency, electron identification efficiency and trigger efficiency. The total J/ efficiency is shown vs J/ transverse momentum in Fig. 2b, 2d, 2f. The most critical factor is trigger efficiency. At least one of electrons from J/ decay must have above 2.6 GeV/ since is required to satisfy the trigger conditions. It causes significant loss in number of observed J/ at lower J/ and the efficiency decrease with decreasing . It is well visible in Fig. 2b, where we lose all entries at 0. With increasing J/ the trigger efficiency increase but because the trigger has also the upper threshold ( 4.3 GeV) and due to the acceptance effect (single electron 0.4 GeV/ and 1) we see drop of total efficiency at 1 , see Fig. 2f.
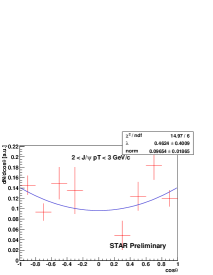
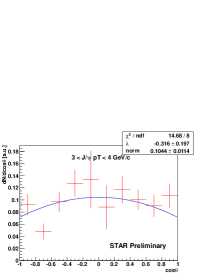
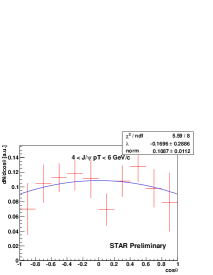
3.2 J/ polarization result
The corrected distributions are fitted with: (see Eq. 1) with no constraints on the fit parameters, see Fig. 3a, 3b, 3c, where is a normalization factor, is the polarization parameter. Lines represent the most likely fits. Obtained results of the polarization parameter are: = 0.46 0.40 (stat.) 0.34 (sys.), = -0.32 0.20 (stat.) 0.16 (sys.), = -0.17 0.29 (stat.) 0.11 (sys.) for J/ ranges: (2 - 3) GeV/, (3 - 4) GeV/c, (4 - 6) GeV/ respectively. Dominant sources of systematic uncertainties are: binning and acceptance, J/ mass range, electron identification cut, trigger efficiency. Detailed work on systematic error estimation is in progress.
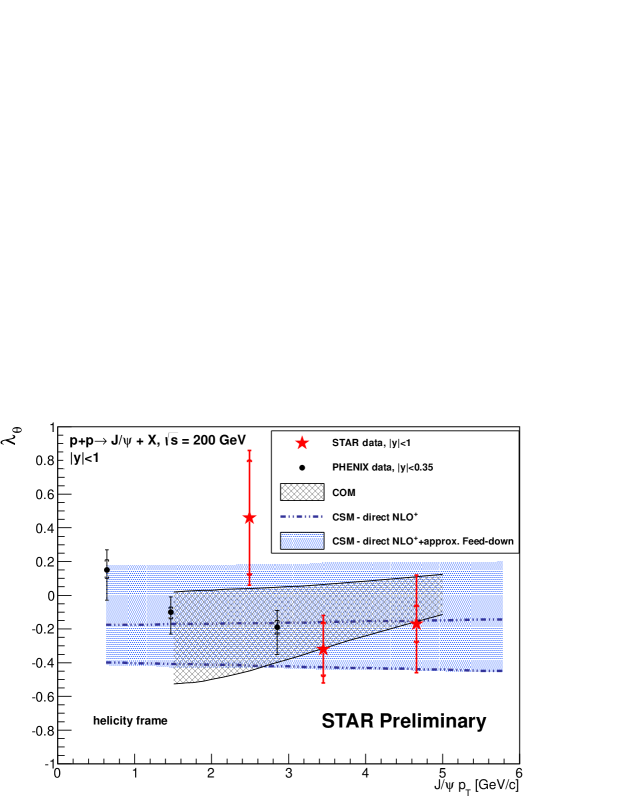
Polarization parameters as a function of J/ are shown in Fig. 4. The STAR result (red star symbols) is compared with [1] (blue shaded area) and [3] (gray hatched area) model predictions and with the PHENIX result for J/ polarization at mid-rapidity (black symbols) [5]. The STAR result is consistent with the COM and CSM predictions within current experimental and theoretical uncertainties. The measurement is also consistent with the PHENIX data and extends the reach to 6 GeV/.
4 Summary
In this report, the J/ polarization measurement from the STAR experiment at mid-rapidity is presented. The polarization parameter is extracted in the helicity frame in 3 J/ bins. Within current uncertainties the obtained transverse momentum dependent parameter is consistent with and model predictions, and with no polarization.
References
- [1] J.P. Lansberg, Phys. Lett. B 695 (2011) 149-156
- [2] A.Abulencia et al. (CDF Collaboration), Phys. Rev. Lett. 99, 132001 (2007)
- [3] H.S. Chung, C. Yu, S. Kim, J. Lee, Phys. Rev. D 81, 014020 (2010)
- [4] C.S. Lam, W.K. Tung, Phys. Rev. D 18, 2447 (1978)
- [5] A. Adare et al. (PHENIX Collaboration), Phys. Rev. D 82, 012001 (2010)