THE GRB 071112C: A CASE STUDY OF DIFFERENT MECHANISMS IN X-RAY AND OPTICAL TEMPORAL EVOLUTION
We present the study on GRB 071112C X-ray and optical light curves. In these two wavelength ranges, we have found different temporal properties. The -band light curve showed an initial rise followed by a single power-law decay, while the X-ray light curve was described by a single power-law decay plus a flare-like feature. Our analysis shows that the observed temporal evolution cannot be described by the external shock model in which the X-ray and optical emission are produced by the same emission mechanism. No significant color changes in multi-band light curves and a reasonable value of the initial Lorentz factor () in a uniform interstellar medium support the afterglow onset scenario as the correct interpretation for the early -band rise. The result suggests that the optical flux is dominated by afterglow. Our further investigations show that the X-ray flux could be created by an additional feature related to energy injection and X-ray afterglow. Different theoretical interpretations indicate the additional feature in X-ray can be explained by either late internal dissipation or local inverse-Compton scattering in the external shock.
1 INTRODUCTION
The Swift Gamma-Ray Explorer, launched in late 2004, has provided accurate positions for many gamma-ray bursts (GRBs), enabling a number of early X-ray and optical observations. The on-board X-Ray Telescope (XRT) data revealed that many GRBs have complicated evolutions (e.g., flare and shallow decay) and that their X-ray temporal evolution could be described by a three-component generic broken power law with an initial steep power-law decay (), followed by a very shallow decay () or a flare, finally changing to a steep decay (; Nousek et al. (2006); Zhang et al. (2006)). These properties could be characterized by prompt emission from GRBs or a mixture of different emission components contributing to the observed X-ray emission (Willingale et al., 2007; Zhang et al., 2007; Liang et al., 2009; Nardini et al., 2010). Early optical afterglow behaviors also show more diverse properties compared to the simpler late time evolutions. Panaitescu & Vestrand (2008) presented early afterglow behaviors of 28 known-redshift GRBs and grouped those GRBs as (1) fast-rising with peaks at about 100 s; (2) slow-rising with peaks after 100 s, (3) fast decay and (4) plateau. They proposed that the angular asymmetry of the GRB ejecta viewed along different lines of sight generates the diversity of early optical afterglow light curves. A similar study with more samples was carried out by Kann et al. (2010) as well. They concluded that about 60% of early optical detections are the forward-shock-dominated afterglows.
Comparisons of X-ray and optical light curve have clearly shown that the evolutions for the two wavelengths are generally different (Panaitescu et al., 2006; Huang et al., 2007a). Significantly, there are GRBs whose decay indices during late-time evolution could not be explained by the external shock model in which X-ray and optical emission must be produced by the same emission mechanism (Urata et al., 2007). These studies suggest that the X-ray and optical emission are generated by different outflows. To explain possible emission mechanisms and provide reasonable interpretations, Ghisellini et al. (2007) proposed a late prompt emission scenario. They suggested that the late internal shocks with lower power could be created and superposed on the real afterglow emission of prompt GRB emission. However, it is still unclear how the early temporal evolution is affected by prompt emission and how long the prompt emission can sustain the overall temporal evolution. More extensive coverage of X-ray and optical observations are essential to solve this problem.
Recently, Liang et al. (2010) analyzed 32 GRBs with early smooth bumps in their early optical or X-ray light curves and investigated a possible relation with the initial Lorentz factor. They found that early bright X-ray emissions are usually dominated by non-forward shock components, but sometimes the forward shock emissions are observable in the X-ray wavelength, and an achromatic feature in X-ray and optical is observed. In the study, they also discovered a good correlation between the initial Lorentz factor and the GRB apparent isotropic energy. Here, we examine our optical measurements of GRB 071112C as well as the corresponding simultaneous X-ray observations to explore their possible emission mechanisms.
On 2007 November 12, the Swift Burst Alert Telescope (BAT) detected GRB 071112C at 18:32:57 UT. This burst showed a single fast rise-exponential decay peak and the measured (- keV) was s. The 80 total fluence in the - keV band was , which corresponded to a lower limit of isotropic energy erg at a redshift (assume , and ). The XRT started to observe this burst from 84 s after the BAT triggered. The XRT observations showed a smooth re-brightening around s after the burst and followed a simple decay (Stratta et al., 2007). Two robotic optical telescopes, the ROTSE-IIIc and the TAOS, responded to this burst at 65 s and 93 s after the burst, respectively (Yuan et al., 2007; Huang et al., 2007b). In addition, the optical afterglow was observed by a number of ground telescopes in , , , , and bands (Uemura et al., 2007a; Wang et al., 2007; Klotz et al., 2007; Burenini et al., 2007; Chen et al., 2007; Nugent et al., 2007; Dintinjana et al., 2007; Ishimura et al., 2007; Greco et al., 2007; Stefano et al., 2007; Yoshida et al., 2007; Uemura et al., 2007b; Minezaki et al., 2007). The spectral measurements of the optical afterglow by the Very Large Telescope and the Gemini North telescope indicated that the redshift of this burst was 0.823 (Jakobsson et al., 2007; Cucchiara et al., 2007).
2 OPTICAL AND X-RAY TEMPORAL ANALYSIS
The ROTSE-IIIc and TAOS optical observations started around s. The ROTSE-IIIc telescope (Akerlof et al., 2003) detected the GRB 071112C optical afterglow with brightness at s. At the same time, the optical afterglow was also detected by TAOS-A and TAOS-B telescopes (Lehner et al., 2009) with sequences of 1 s and 5 s exposures, respectively. Subsequently, a series of optical multi-band follow-up observations were also carried out by Xinglong 0.8 m and 1.0 m telescope in China (Zheng et al., 2008), the Lulin One-meter telescope (LOT) in Taiwan (Huang et al., 2005; Urata et al., 2005), and the 0.5 m MITSuME telescope in Japan (Kotani, 2005). About one year after the burst, the host galaxy of GRB 071112C was clearly detected with the 3.8 m Canda-Feance-Hawaii Telescope (CFHT). The log of our optical observations is summarized in Table 1.
The optical images were processed by a standard procedure including bias and dark subtraction and flat-fielding using IRAF. The DAOPHOT package was used to perform point-spread function (PSF) photometry. Seven bright stars in the images were used to create the PSF model. The absolute photometric calibration for GRB field was determined using Landolt (Landolt et al., 1992) field SA 92, SA 95 and PG 0231+051 with a range of airmass. For calibration, we use 17 reference stars with colors similar to the afterglow () . Both photometric and systematic errors were included in the magnitude error. Besides our own observations, we re-calibrated the reported afterglow measurements by using the reference stars in the GRB 071112C field. Several measurements in GCN reports were calibrated by USNOB stars; the USNOB stars are on average 0.05 brighter than the stars of our calibration. Since the reference stars were provided by Burenini et al. (2007) and Uemura et al. (2007a, b), we measured these stars from our LOT -band and Xinglong -band images and obtained their averaged magnitude and rms errors. The results were then used to re-calibrated the reported afterglow magnitude. The uncertainties with 1 level confidence were adopted in this paper.
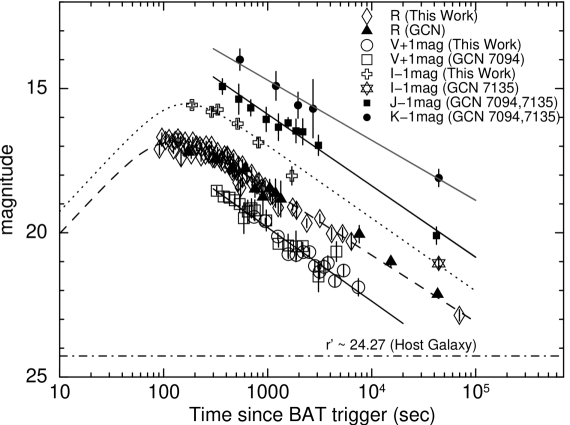
As shown in Figure 1, the -, - and -band light curves of GRB 071112C can be expressed in terms of a power law with . Here, each is the power-law index in each optical band. We find (= 1.51 for ) from -band data, (= 2.16 for ) from -band data, and (= 1.79 for ) from -band data. Besides our optical data, we also analyzed the calibrated NIR measurements by Uemura et al. (2007b) and Minezaki et al. (2007). The - and -band light curves could be expressed by a single power law with a index (= 0.38 for ) and (= 0.18 for ), respectively.
Note that the -band light curve demonstrates a plateau in the early evolution. We next fit the -band measurements with a broken power-law function, , where is the break time in -band light curve, and are the power-law indices before and after the -band break time , and is the flux at . We obtain , , and s (= 1.25 for ). The smaller chi-square value indicates that the broken power-law function is a reasonable fitting function to explain the -band evolution in GRB 071112C and implies a rising behavior in early -band light curve.
Figure 2 shows the -band and XRT light curves of GRB 071112C. The XRT - keV light curve was downloaded from the Swift/XRT GRB light curve repository (Evans et al., 2007). To plot the -band and X-ray light curves on a consistent scale, we converted the afterglow brightness to units of mJy. It is clear that a Gaussian-shaped flare appeared in the XRT light curve around s after the burst. The XRT light curve can be fit with a single power law plus a Gaussian function (), where is a constant value, is the single power-law index, is peak intensity at peak position ,and is the width of the Gaussian feature. The best-fit parameters are , , , s, and s (= 1.27 for ). If we exclude the flare component, the overall XRT light curve could be well fit by a single power law with an index . The afterglow decayed with an index of , consistent with the analysis of Uehara et al. (2010). A flare occurred around s following the burst and approached the original maximum brightness of . After the flare emission became weak, the afterglow emission again dominated the X-ray light curve and continued to decay with the same index () to the end of the XRT observations. The X-ray flare seems like superpose on the X-ray decelerated temporal evolution and did not change the overall X-ray afterglow evolution significantly.
This analysis of X-ray and -band light curve of GRB 071112C shows that the X-ray light curve was composed of a single power-law ( ) decay plus a small flare while the band light curve exhibits a bump followed by a shallower single power-law decay ().
3 DISCUSSION
3.1 Early Bump in Optical Light Curve
In the Swift era, many early optical afterglows show localized peaks, plateaus, or simple power-law decay behavior. A simple power law decay is usually associated with a relativistic blast wave decelerated by its interaction with the ambient medium. Unfortunately, the nature of localized peaks and plateaus are unclear. Panaitescu & Vestrand (2008) proposed that the peak and plateau features could be caused by a structured outflow seen at different directions from the GRB ejecta. The different off-axis viewing angles produce different features in early optical light curves. The afterglows with plateaus have larger viewing angles than those with sharper peaks.
Alternatively, the afterglows with plateaus could be simply produced by long-lived GRBs which display shallow decay in the light curves and continue for up to s after the GRB onset (Panaitescu & Vestrand, 2011; Kann et al., 2010). Besides the interpretations we mentioned above, the optical afterglow peaks could also be produced by the onset of a normal afterglow or the passage of the synchrotron typical peak frequency.
Our analysis shows that the GRB 071112C -band light curve peaked around 99 s after the burst and then decayed with an index of 0.92 until s. The observed temporal evolution is not consistent with observers located off-axis of the GRB jet (Granot et al., 2002) which should peak thousands seconds after the initial occurrence. For the scenario of long-lived GRBs, energy from the GRB ejecta could continue to supply and power the ambient medium surrounding the burst. The afterglow emission from the ambient medium, could continuously be supplied and display plateaus or shallow decays in afterglow light curves. Similar features should be found in both the X-ray and optical light curves. Although the rising part in the -band was not visible in our measurements, the short duration peak in GRB 071112C implies that it is unlikely an example of the long lasting plateau feature of long-lived GRBs (Zhang et al., 2006; Panaitescu & Vestrand, 2008). In addition, in Figure 2, a comparison of X-ray and -band light curves of GRB 071112C, shows very different temporal evolutions for the two wavelengths. This indicates that the mechanism of long-lasting shallow decay produced by long-lived GRB ejecta can not explain the observed X-ray and optical temporal evolution.
For the case of synchrotron frequency passage, the external shock model (Sari et al., 1998) predicts that the optical temporal light curve () will show an initial increase with , until the synchrotron peak () after which a power-law decay will follow . Here is the electron spectral index and the ambient medium is assumed uniform. This model predicts that the passing times at different wavelengths should follow . Chromatic breaks and color change are two significant clues in multi-band light curves to verify the passage of the synchrotron peak frequency.
Our -band light curve is composed of a possible power law rising with index , a peak of brightness at s followed by a decay with index . The -band measurements could not be well fitted with a single power-law decay, which implies it has similar temporal property to that observed in the -band. To model the -band measurements with more complicated formulae, we first fixed the rising power-law index, , to be the same as the -band and then fit -band light curve with a broken power-law formula. We found that the break time in the -band is s after which follows a power-law decay (= 1.04 for ). This fit is better than the single power-law fit. If the -band peak was produced by the passage of the synchrotron peak frequency, the estimated band break time from external model will be at s. The result is consistent with the break time from a broken power-law fit. However, few -band measurements yielded large error of -band break time and given the uncertainties to confirm the synchrotron peak frequency at -band. Fortunately, there is no significant color change between our - and -band measurements. An achromatic NIR evolution was also reported by Uehara et al. (2010) which supports our optical results and indicates achromatic evolution in the - and - band light curves. The peak in the -band is thus unlikely due to the passage of the synchrotron peak.
In the scenario of onset of afterglow, achromatic evolution is predicted in the multi-band light curves. Such GRBs are generated from high relativistic injection fireballs (Meśzaŕos, 2002; Zhang & Meśzaŕos, 2004; Piran, 2004). The fireball maintains constant velocity until it sweeps up a significant amount of ambient medium and then is decelerated by the ambient medium to produce a smooth local peak in the afterglow light curve. During this process, the Lorentz factor, , decreases. The peak time of the bump, from theoretical prediction, demonstrates roughly half of the fireball energy is transferred to the medium and is detectable in the early afterglow light curve. For some bursts, in which the reverse shock component would not show up in the optical band, the smooth local peak signals the deceleration feature of the fireball and can be used to constrain the initial Lorentz factor and the deceleration radius (Sari & Piran, 1999; Zhang et al., 2003; Kobayashi & Zhang, 2007; Liang et al., 2010). In addition, this theory predicts that the peak should be sensitive to the initial Lorentz factor but is insensitive to other parameters.
Molinari et al. (2007) studied the NIR early peaks of GRB 060418 and GRB 060607A and concluded that such features could be explained by the onset of afterglows. Their estimated values of initial Lorentz factor () are consistent with predictions () from the standard fireball model (Piran, 2000; Soderberg & Ramirez-Ruiz, 2002; Meśzaŕos, 2006). With the formula in Molinari et al. (2007), we calculated the expected time that -band light curve reaches its maximal brightness for GRB 071112C. The peak time is s. The initial Lorentz factor is for a constant density medium and for a wind environment. In the wind environment, the interstellar medium (ISM) density distribution around a massive star can be defined as , where is a constant. The estimated initial Lorentz factor is consistent with the theoretical prediction at the lower end. On the other hand, Liang et al. (2010) found that when GRBs show onset feature in their early optical or X-ray light curves, their initial Lorentz factor, , and GRB isotropic energy, , follow an empirical relation . Here is the GRB isotropic energy in unit of erg and a uniform GRB ambient medium is assumed. Our estimation shows the initial Lorentz factor of GRB 071112C is . Figure 3 depicts the empirical correlation between and . With the isotropic energy at , isotropic energy ( erg) of GRB 071112C follows the empirical relation within the 2- range. This analysis thus further supports the conclusion that the bump in GRB 071112C is most likely the onset afterglow at optical wavelengths.
3.2 Different Origin of X-ray and Optical Emission
As we have discussed, optical and X-ray light curves in GRB 071112C have different evolutions and the rising part of the band light curve is likely related to the onset of afterglow. In fact, several observations and studies show that the X-ray and optical light curves are often different and inconsistent with the external shock model in which X-ray and optical emission are produced by the same emission mechanisms (Panaitescu et al., 2006; Urata et al., 2007; Liang et al., 2009). Those GRBs usually have complicated and diverse temporal evolutions.
Urata et al. (2007) investigated the late temporal properties of 14 GRBs and found that a fraction of the events are outliers of the external shock model at normal decay phase in which neither the delayed energy injection nor time dependency of shock microphysics were considered. Uehara et al. (2010) studied the NIR to X-ray spectral energy distribution of GRB 071112C and concluded that the observed NIR to X-ray SEDs is consistent with the expectation from the normal afterglow component and that the cooling break () is between the optical and X-ray bands. In other words, spectral evolution of observed GRB 071112C should be in the region of and follow the relationships predicted by external shock models, for uniform ambient median or for stellar wind with a density variation (Urata et al., 2007). The X-ray temporal power-law decay index, excluding the flare component, is and the optical decay index (after the bump feature) is . The observed difference of power-law indices, for GRB 071112C, is outlier of the external shock model and suggests different origins or radiation processes for X-ray and optical emissions.
Nearly half of all Swift bursts have distinct X-ray flares and they are most likely due to late prompt emission caused by late central engine activity (Zhang et al., 2006; Falcone et al., 2007). Chincarini et al. (2010) and Bernardini et al. (2011) investigated early- and late-time X-ray flares and concluded that the internal shock origin is the most promising explanation for X-ray flares. Those studies give strongly indications that X-ray flares have a common origin with the gamma-ray pulses. Besides, the presence of an underlying continuum with same slope before and after the flaring activity excluded the possibility that flares are related to the afterglow emission by forward external shocks. These investigations implies additional energy is needed to produce the chromatic temporal properties in X-ray and optical wavelengths.
To explain the origin of both X-ray and optical evolutions constantly, Ghisellini et al. (2007) proposed that the observed X-ray and optical fluxes could be modified by two emission components. One is the afterglow emission produced by forward shocks. Another is late prompt emission, which has same origin of prompt emission, but is created at late times with smaller power and smaller . In this interpretation, if the X-ray flux is dominated by late prompt emission and the optical flux is dominated by afterglow emission, the light curves in the two wavelengths will evolve independently and show no simultaneous break. A faint X-ray flare found around 500 s following the GRB 071112C burst could provide a clue that late prompt emission plays a role in the X-ray emission.
To further explore late internal dissipation in X-ray emission, we assume that the observed optical emission in GRB 071112C is the real afterglow predicted by the external shock model. In this model ( ), the optical emission would follow leading to a relation, . With the observed -band power-law index, , we estimate spectral index is for the optical band and calculate the electron spectral index . Next we assume is constant in afterglow phase and calculate the X-ray spectral index produced by the external shock model, . In Figure 2, the dotted line shows the expected X-ray emission from external shock model in the region of ( (). Here we adopt the value Hz from Uehara et al. (2010). In addition, we also plot the maximum value of expected X-ray flux (the dot-dashed line in the Figure 2). It is clear that the observed X-ray flux is brighter than the expected flux from external shock. This supports the conclusion that the observed X-ray and optical emissions from GRB 071112C are caused by different emission mechanisms. The X-ray flux is created by late internal dissipation and X-ray afterglow emission while the optical flux is dominated by afterglow. In addition, the expected X-ray flux in the Figure 2 implies that the late prompt emission could last until 3000 s after the burst or even longer ( s). This is consistent with late flares or shallow decay in some bursts, which are generally believed to be related to the late activity of central engine (Burrows et al., 2005; Nousek et al., 2006; Zhang et al., 2006; Falcone et al., 2006).
Recently, Panaitescu & Vestrand (2011) proposed another interpretation. They proposed that the X-ray and optical evolution could be decoupled by additional energy added to external shock in a wind-like medium. They suggested that the optical emission is from synchrotron and the X-ray emission is from local inverse-Compton scattering. In internalexternal model, the fireball ejecta collides with the ambient ISM and produce synchrotron afterglow emission in X-ray and optical wavelengths. At this moment, if additional energy is supplied into the ejecta, the low energy photons from synchrotron processes will obtain energy from relativistic electrons through inverse-Compton scattering and enhance the X-ray flux. In this scenario, the X-ray flux is predicted to have faster decay than the optical flux and no achromatic breaks will be found in the two wavelengths.
Panaitescu & Vestrand (2011) assumed that an energy injection () and a power-law distribution of electrons with energy for the synchrotron self-Compton model. With the conditions, they derived the predicted optical (from synchrotron) and X-ray (from inverse-Compton) power-law decay indices. For a wind-like medium, the expected synchrotron decay index is at and the inverse-Compton decay index is at . Using our results on GRB 071112C ( and ), we derived a relation between energy injection and electron spectral index . Applying the electron spectral index from optical observation, we obtain = 2.2 for the GRB 071112C. This result is consistent with other afterglows in which their decoupled X-ray and optical light curves can be explained by synchrotron self-Compton model (GRB 080129 with 2.0, GRB 090424 with 1.0, and GRB 090510 with 2.4).
We investigated the X-ray and optical temporal evolution of the GRB 071112C. Our analysis shows that different emission mechanisms produce the decoupled X-ray and optical evolution. The optical flux is dominated by afterglow, which is produced by synchrotron emission. However, the X-ray flux is created by an additional feature related to energy injection and X-ray afterglow emission. Different theoretical interpretations indicate the additional feature in X-ray can be explained by either late internal dissipation or inverse-Compton scattering in external shocks.
4 Conclusion
We analyzed X-ray and optical light curves of GRB 071112C and found that the X-ray light curve was described by a single power-law plus a flare-like feature, while the -band light curve showed an initial rise followed by a power-law decay. No significant color changes and a value of for initial Lorentz factor indicates that the afterglow onset scenario is likely the correct interpretation for the early -band rise. Based on the result, we conclude that the optical flux of the GRB 071112C is dominated by afterglow. Furthermore, compared with X-ray temporal evolution, we found that the observed temporal properties in the two wavelengths cannot be described by the external shock in which the X-ray and optical emission are produced by the same emission mechanism. An additional energy contribution in X-rays is thus necessary. The X-ray flux could be created by a additional feature related to energy injection and X-ray afterglow emission. The faint X-ray flare supports the scenario of energy injection and our analysis indicates either late internal dissipation or inverse-Compton scattering in external shocks is the possible interpretation for the additional feature by energy injection. More such samples with adequately sampled X-ray and optical light curves are important to investigate and understand the detailed emission mechanism for the two wavelengths.
References
- Akerlof et al. (2003) Akerlof, C., Kehoe, R. L., McKay, T. A., 2003, PASP, 115, 132
- Bernardini et al. (2011) Bernardini, M.G., Margutti, R., Chincarini, G., Guidorzi, C., & Mao J. 2011, A&A, 526, 27
- Burenini et al. (2007) Burenini, R., Khamitov, I., Pavlinsky, M., et al. 2007, GCN Circ., 7066, 1
- Burrows et al. (2005) Burrows, D. N., Romano, P.,Falcone, A., et al. 2005, Science, 309, 1833
- Chen et al. (2007) Chen, I. C., Huang, K. Y., & Urata Y. 2007. GCN Circ. 7067
- Chincarini et al. (2010) Chincarini, G., Mao, J., Margutti, R., et al. 2010, MNRAS, 406, 2113
- Cucchiara et al. (2007) Cucchiara, A., Fox, D. B., Berger, E., & Perri, M. 2007, GCN Circ., 7086, 1
- Dintinjana et al. (2007) Dintinjana, B., Maticic, S., Nikuz, H., & Skvarc J. 2007, GCN Circ., 7078, 1
- Evans et al. (2007) Evans, P. A., Beardmore, A. P., Page, K. L., et al. 2007, A&A, 469, 279
- Falcone et al. (2006) Falcone, A. D., Borrows, D. N., Lazzati, D., et al. 2006, ApJ, 641, 1010
- Falcone et al. (2007) Falcone, A. D., Morris, D., Racusin, J. et al. 2007, ApJ, 671, 1921
- Ghisellini et al. (2007) Ghisellini, G., Ghirlanda, G., Navy, L. & Firmani, C. 2007, ApJ, 658, L75
- Granot et al. (2002) Granot, J., Panaitescu, A,, Kumar, P. & Wooseley, S.E. 2002, ApJ, 570, L61
- Greco et al. (2007) Greco, G., Terra, F., Bartolini, C., et al. 2007, GCN Circ., 7089, 1
- Huang et al. (2005) Huang, K. Y., Urata, Y., Filippenko, A. V., et al. 2005, ApJ, 628, L93
- Huang et al. (2007a) Huang, K. Y., Schwamb, M. E., Wang, J. H., & Wen, C. Y. 2007a, GCN Circ., 7334,1 Huang, K. Y. et al. 2007a, ApJ, 654, 25
- Huang et al. (2007b) Huang, K. Y., Urata, Y., Kuo, P. H., et al. 2007b, ApJ, 654, 25
- Ishimura et al. (2007) Ishimura, T., Shimokawabe, T., Mori, Y., et al. 2007, GCN Circ., 7087, 1
- Jakobsson et al. (2007) Jalobsson, P., Fynbo, J. P. U., Vreeswijk, P. M., Malesani, D., & Sollerman J., 2007, GCN Circ., 7076, 1
- Kann et al. (2010) Kann, D. A., Klose, S. Zhang, B., et al. 2010, ApJ, 720, 1513
- Klotz et al. (2007) Klotz, A., Boer, M., & Atteia, J. L. 2007, GCN Circ. 7065
- Kobayashi & Zhang (2007) Kobayashi, S. & Zhang, B. 2007, ApJ, 655, 973
- Kotani (2005) Kotani, T., Kawai, N., Yanagisawa, K., et al. 2005, Nuovo Cimento C, 28, 755
- Landolt et al. (1992) Landolt, A. U. 1992, AJ, 104, 336
- Lehner et al. (2009) Lehner, M., Wen, C.-Y., Wang, J.-H. et al. 2009, PASP, 121, 138
- Liang et al. (2009) Liang, E.-W., Lu, H.-J., Hou, S.-J., Zhang,B.-B. & Zhang, B. 2009, ApJ, 707, 328
- Liang et al. (2010) Liang, E.-W., Yi, S.-X., Zhang, J., et al. 2010, ApJ, 725, 2209
- Meśzaŕos (2002) Meśzaŕos, P. 2002, ARA&A, 40 137
- Meśzaŕos (2006) Meśzaŕos, P. 2006, Rep. Progr. Phys., 69, 2259
- Minezaki et al. (2007) Minezaki, T., Price, P. A., Yoshii, Y., & Cowie, C. C. 2007, GCN Circ., 7135, 1
- Molinari et al. (2007) Molinari, E., Vergani, S. D., Malesani, D., et al. 2007, AA, 469, L13
- Nardini et al. (2010) Nardini, M., Ghisellini, G., Ghirlanda, G. & Celotti, A. 2010, MNRAS, 403, 1131
- Nousek et al. (2006) Nousek, J. A., Kouveliotou, C., Grupe, D., et al. 2006, ApJ, 642, 389
- Nugent et al. (2007) Nugent, P., & Bloom, J. S. 2007, GCN Circ., 7069, 1
- Panaitescu et al. (2006) Panaitescu, A., Meśzaŕos, P., Burrows, J., et al. 2006, MNRAS, 369, 2059
- Panaitescu & Vestrand (2008) Panaitescu, A. & Vestrand, W.T. 2008, MNRAS, 387, 497
- Panaitescu & Vestrand (2011) Panaitescu, A. & Vestrand, W.T. 2011, MNRAS, 414, 353
- Piran (2000) Piran, T. 2000, Phys.Rep., 333, 529
- Piran (2004) Prian, T. 2004, Rev. Mod. Phys., 76, 114
- Sari & Piran (1999) Sari, R. & Prian, T. 1999, ApJ, 520, 641
- Sari et al. (1998) Sari, R., Prian, T & Narayan, R. 1998, ApJ, 497, L17
- Soderberg & Ramirez-Ruiz (2002) Soderberg, A. M. & Ramirez-Ruiz, E. 2002, MNRAS, 330, L24
- Stefano et al. (2007) Stefano, S. 2007, GCN Circ., 7090, 1
- Stratta et al. (2007) Stratta, G., Perri, M., Krimm, H., et al. 2007, GCN Rep., 104.2
- Uehara et al. (2010) Uehara, T., Uemura, M., Kawabata, K. S. et al. 2010, A&A, 519, 56
- Uemura et al. (2007a) Uemura, M., Sasada, M., Arai, A., & Uehara T. 2007a, GCN Circ., 7062, 1
- Uemura et al. (2007b) Uemura, M., Sasada, M., Arai, A., & Uehara T. 2007b, GCN Circ., 7094, 1
- Urata et al. (2005) Urata, Y., Huang, K. Y. & Ip, W. H. et al. 2005, Nuovo Cimento C, 28, 775
- Urata et al. (2007) Urata, Y., Yamazaki, R., Sakamoto, T., et al. 2007, ApJ, 668, L95
- Wang et al. (2007) Wang, X. F., Xin, L. P. & Zhai, M., et al. 2007, GCN Circ., 7063, 1
- Willingale et al. (2007) Willingale, R., O’Brien, P. T., Osborne, J. P., et al. 2007, ApJ, 663, 1093
- Yoshida et al. (2007) Yoshida, M., Yanagisawa, K.,Shimizu, Y., et al. 2007, GCN Circ., 7091, 1
- Yuan et al. (2007) Yuan, F., Rykoff, E. S., Rujopakarn, W., & Swan H. 2007, GCN Circ., 7061, 1
- Zhang et al. (2007) Zhang, B. et al. 2007, Adv. Space Res., 40, 1186
- Zhang et al. (2006) Zhang, B., Fan, Y. Z., Dyks, J., et al. 2006, ApJ, 642, 354
- Zhang et al. (2003) Zha ng, B., Kobayashi, S., & Meśzaŕos, P. 2003, ApJ, 595, 950
- Zhang & Meśzaŕos (2004) Zhang, B. & Meśzaŕos, P. 2004, Int. J. Mod. Phys. A, 19, 2385
- Zheng et al. (2008) Zheng, W., Deng, J.-S., Zhai, M., et al. 2008, Chin. J. Astron. Astrophys., 8, 693


| Filter | Exposure (s) | Mag | Telescope | |
|---|---|---|---|---|
| 738.7 | 300 s 1 | 18.45 0.10 | Xinglong-1m | |
| 948.9 | 300 s 1 | 18.60 0.10 | Xinglong-1m | |
| 1252.8 | 300 s 1 | 19.13 0.12 | Xinglong-1m | |
| 1578.5 | 300 s 1 | 19.74 0.15 | Xinglong-1m | |
| 1887.8 | 300 s 1 | 19.77 0.15 | Xinglong-1m | |
| 2204.9 | 300 s 1 | 19.67 0.15 | Xinglong-1m | |
| 2522.0 | 300 s 1 | 19.67 0.15 | Xinglong-1m | |
| 2839.1 | 300 s 1 | 20.15 0.15 | Xinglong-1m | |
| 3157.1 | 300 s 1 | 20.35 0.25 | Xinglong-1m | |
| 3474.1 | 300 s 1 | 20.18 0.25 | Xinglong-1m | |
| 3791.2 | 300 s 1 | 20.05 0.25 | Xinglong-1m | |
| 4425.4 | 300 s 3 | 20.67 0.20 | Xinglong-1m | |
| 5377.5 | 300 s 3 | 20.31 0.20 | Xinglong-1m | |
| 7454.6 | 600 s 5 | 20.89 0.30 | Xinglong-1m | |
| 90.9 | 5 s 5 | 17.10 0.20 | ROTSE-IIIc | |
| 147.0 | 5 s 5 | 17.40 0.30 | ROTSE-IIIc | |
| 273.3 | 20 s 5 | 17.10 0.10 | ROTSE-IIIc | |
| 96.2 | 5 s 1 | 16.79 0.15 | TAOSB | |
| 104.4 | 5 s 1 | 17.01 0.17 | TAOSB | |
| 112.6 | 5 s 1 | 16.83 0.14 | TAOSB | |
| 120.8 | 5 s 1 | 17.05 0.15 | TAOSB | |
| 129.0 | 5 s 1 | 17.00 0.16 | TAOSB | |
| 137.2 | 5 s 1 | 16.86 0.17 | TAOSB | |
| 145.4 | 5 s 1 | 16.96 0.16 | TAOSB | |
| 157.7 | 5 s 2 | 17.17 0.12 | TAOSB | |
| 174.1 | 5 s 2 | 17.17 0.18 | TAOSB | |
| 190.5 | 5 s 2 | 16.96 0.14 | TAOSB | |
| 206.9 | 5 s 2 | 17.11 0.15 | TAOSB | |
| 223.3 | 5 s 2 | 17.14 0.12 | TAOSB | |
| 231.7 | 5 s 2 | 17.16 0.12 | TAOSB | |
| 256.1 | 5 s 2 | 17.11 0.14 | TAOSB | |
| 272.5 | 5 s 2 | 17.42 0.18 | TAOSB | |
| 288.9 | 5 s 2 | 17.14 0.16 | TAOSB | |
| 309.5 | 5 s 3 | 17.52 0.22 | TAOSB | |
| 330.3 | 5 s 3 | 17.28 0.13 | TAOSB | |
| 359.7 | 5 s 3 | 17.63 0.15 | TAOSB | |
| 384.6 | 5 s 3 | 17.48 0.17 | TAOSB | |
| 409.2 | 5 s 3 | 17.45 0.22 | TAOSB | |
| 437.9 | 5 s 4 | 17.75 0.18 | TAOSB | |
| 470.7 | 5 s 4 | 17.57 0.15 | TAOSB | |
| 520.3 | 5 s 4 | 18.42 0.31 | TAOSB | |
| 573.2 | 5 s 7 | 17.81 0.19 | TAOSB | |
| 630.7 | 5 s 7 | 18.14 0.24 | TAOSB | |
| 701.1 | 5 s 7 | 18.15 0.22 | TAOSB | |
| 824.7 | 5 s 20 | 18.36 0.22 | TAOSB | |
| 1112.4 | 5 s 50 | 19.01 0.29 | TAOSB | |
| 1894.6 | 5 s 140 | 19.23 0.26 | TAOSB | |
| 124.4 | 20 s 1 | 17.13 0.12 | TNT-0.8m | |
| 160.7 | 20 s 1 | 16.82 0.10 | TNT-0.8m | |
| 184.0 | 20 s 1 | 17.30 0.12 | TNT-0.8m | |
| 206.5 | 20 s 1 | 17.04 0.12 | TNT-0.8m | |
| 228.9 | 20 s 1 | 17.37 0.15 | TNT-0.8m | |
| 252.3 | 20 s 1 | 17.31 0.15 | TNT-0.8m | |
| 274.8 | 20 s 1 | 17.26 0.15 | TNT-0.8m | |
| 297.2 | 20 s 1 | 17.43 0.15 | TNT-0.8m | |
| 343.0 | 20 s 1 | 17.42 0.15 | TNT-0.8m | |
| 366.3 | 20 s 1 | 17.48 0.15 | TNT-0.8m | |
| 388.8 | 20 s 1 | 17.62 0.15 | TNT-0.8m | |
| 412.1 | 20 s 1 | 17.35 0.15 | TNT-0.8m | |
| 434.6 | 20 s 1 | 17.68 0.15 | TNT-0.8m | |
| 457.0 | 20 s 1 | 17.87 0.20 | TNT-0.8m | |
| 480.4 | 20 s 1 | 17.80 0.20 | TNT-0.8m | |
| 502.8 | 20 s 1 | 17.87 0.20 | TNT-0.8m | |
| 525.3 | 20 s 1 | 17.66 0.25 | TNT-0.8m | |
| 548.6 | 20 s 1 | 18.44 0.30 | TNT-0.8m | |
| 571.1 | 20 s 1 | 18.12 0.25 | TNT-0.8m | |
| 632.4 | 60 s 1 | 18.00 0.15 | TNT-0.8m | |
| 711.1 | 60 s 1 | 18.28 0.20 | TNT-0.8m | |
| 789.7 | 60 s 1 | 18.34 0.20 | TNT-0.8m | |
| 867.5 | 60 s 1 | 18.46 0.20 | TNT-0.8m | |
| 946.2 | 60 s 1 | 18.40 0.20 | TNT-0.8m | |
| 1063.6 | 60 s 2 | 18.72 0.15 | TNT-0.8m | |
| 1262.3 | 60 s 3 | 19.13 0.20 | TNT-0.8m | |
| 1740.1 | 300 s 2 | 19.11 0.10 | TNT-0.8m | |
| 2376.0 | 300 s 2 | 19.67 0.15 | TNT-0.8m | |
| 3170.0 | 300 s 3 | 19.51 0.15 | TNT-0.8m | |
| 4123.0 | 300 s 3 | 20.03 0.20 | TNT-0.8m | |
| 5243.6 | 300 s 4 | 20.03 0.20 | TNT-0.8m | |
| 186.0 | 60 s 1 | 17.11 0.11 | MITSuMe | |
| 280.5 | 60 s 2 | 17.46 0.11 | MITSuMe | |
| 536.5 | 60 s 5 | 18.03 0.15 | MITSuMe | |
| 911.5 | 60 s 5 | 18.49 0.23 | MITSuMe | |
| 1934.5 | 60 s 19 | 19.21 0.25 | MITSuMe | |
| 6372.0 | 300 s 6 | 20.3 0.3 | LOT | |
| 69620.3 | 300 s 12 | 22.7 0.2 | LOT | |
| 3.3 | 300 s 4 | 24.27 0.19 | CFHT | |
| 187.0 | 60 s 1 | 16.57 0.12 | MITsuMe | |
| 289.0 | 60 s 1 | 16.81 0.15 | MITSuMe | |
| 331.0 | 60 s 1 | 16.73 0.14 | MITSuMe | |
| 514.5 | 60 s 2 | 17.22 0.14 | MITSuMe | |
| 816.0 | 60 s 6 | 17.87 0.17 | MITSuMe | |
| 1707.5 | 60 s 6 | 19.03 0.32 | MITSuMe |