XMM-Newton Finds That SAX J1750.82900 May Harbor the Hottest, Most Luminous Known Neutron Star
Abstract
We have performed the first sensitive X-ray observation of the low-mass X-ray binary (LMXB) SAX J1750.82900 in quiescence with XMM-Newton. The spectrum was fit to both a classical black body model, and a non-magnetized, pure hydrogen neutron star (NS) atmosphere model. A power law component was added to these models, but we found that it was not required by the fits. The distance to SAX J1750.82900 is known to be D = 6.79 kpc from a previous analysis of photospheric radius expansion bursts. This distance implies a bolometric luminosity (as given by the NS atmosphere model) of 1034 (D/6.79 kpc)2 erg s-1, which is the highest known luminosity for a NS LMXB in quiescence. One simple explanation for this surprising result could be that the crust and core of the NS were not in thermal equilibrium during the observation. We argue that this was likely not the case, and that the core temperature of the NS in SAX J1750.82900 is unusually high.
Subject headings:
stars: neutron — X-rays: stars — stars: individual (SAX J1750.82900)1. Introduction
Transiently accreting neutron stars in low-mass X-ray binary systems accrete matter from a donor star for weeks to months before returning to quiescence. During an accretion episode, matter falls onto the surface of the NS and is strongly compressed due to the intense gravity. Pycnonuclear reactions occur in the resulting high-density matter (Haensel & Zdunik, 1990) and proceed to heat the crust out of thermal equilibrium with the core. When the system returns to quiescence, the crust begins to thermally relax by conducting a fraction of the excess heat into the core until equilibrium is reestablished. This fraction depends on the thermal conductivity of the crust (Shternin et al., 2007; Brown & Cumming, 2009), the amount of hydrogen and helium remaining in the NS atmosphere post-outburst (Brown et al., 2002), and the temperature of the core. The remaining energy in the crust is believed to be thermally radiated away.
The X-ray spectrum of this thermal radiation differs significantly from a typical black body spectrum due to the atmosphere of the NS, and to the intense gravity at the NS surface (Zavlin et al., 1996). The surface temperature may be deduced from spectral fits to a physical model which accounts for the previously mentioned effects. In thermal equilibrium, the temperature of the surface will be equal to that of the core. Thus, X-ray observations of quiescent NS LMXB systems for which the crust and core have reached thermal equilibrium yield measurements of the NS core temperature. The temperature of the core does not change appreciably over timescales years and is believed to be set by both the mass accretion history of the system (Brown et al., 1998) and the efficiencies of the neutrino producing mechanisms in the core. The core temperatures and bolometric luminosities for these sources are very interesting parameters as they constrain neutrino emission models and give insight into the neutron degenerate matter equation of state.
Here we present the first X-ray observation of the LMXB NS transient SAX J1750.82900 in quiescence. SAX J1750.82900 (hereafter referred to as J1750) was first detected by the Wide Field Cameras (WFCs) aboard the BeppoSAX satellite in 1997 (Natalucci et al., 1999). The WFCs detected nine separate Type I X-ray bursts from J1750 with intensities ranging from 0.4 to 1.0 Crab. From these bursts, a 3 upper limit of 7 kpc was estimated for the source distance. A separate observation by Kaaret et al. (2002) in 2001 with the Rossi X-ray Timing Explorer’s (RXTE) Proportional Counter Array (PCA) revealed Type I X-ray bursts accompanied by millisecond quasiperiodic oscillations, allowing the authors to estimate the NS spin to be 601 Hz. Two of the four bursts from the 2001 RXTE/PCA observation were found to display evidence of photospheric radius expansion (PRE) (Kaaret et al., 2002; Galloway et al., 2008) thus allowing for an estimation of the distance to the source. Galloway et al. (2008) suggest kpc for H-poor burning, and kpc for H-rich burning. The four observed bursts were found to have decay times of s, which Galloway et al. (2008) suggest is indicative of H-poor burning. Thus, we assume for the remainder of this work that the distance to J1750 is kpc.
Since its discovery, J1750 has been reported to be in outburst four times. The outbursts in 2001 and 2008 (Kaaret et al., 2002; Markwardt & Swank, 2008) were of relatively long duration (4 - 5 months), while the outbursts in 1997 and 2011 (Natalucci et al., 1999; Kuulkers et al., 2011; Natalucci et al., 2011) were relatively short ( 1 month). The RXTE All-Sky Monitor (ASM) light curve shown in the top panel of Figure 1 clearly depicts the outburst from 2008 along with a square denoting the time of our XMM observation of J1750 in 2010. The bottom panel shows the RXTE/PCA light curve over the same time period. As we show in Section 4, the spectrum of J1750 was found to be described purely by a thermal component, which, along with the lack of X-ray activity in the RXTE/ASM and RXTE/PCA lightcurves around April 7, 2010, strongly suggests that J1750 was in quiescence during our observation with XMM.

2. Observations and Analysis
The field containing J1750 was observed on April 7, 2010, from 11:21:08 to 17:37:45 UT using the pn, MOS1, and MOS2 instruments aboard the XMM-Newton telescope (Observation ID 0603850201, Revolution Number 1891) with a medium filter. J1750 was located approximately 7′ off-axis since it was not the primary target of the observation. The total exposure time was 21.8 ks. However, a light-curve of the observation revealed that there was strong background flaring for the final 1.9 ks of the observation, so only the first 19.9 ks were considered in the analysis that follows. The total livetime was 16.0 ks for the pn detector, and 19.6 ks for the MOS1 and MOS2 detectors.
We performed the data analysis with the XMM-Newton Science Analysis System (SAS). The tasks emchain and epchain were used to produce event lists for the pn, MOS1, and MOS2 detectors. A temporal filter was applied to the event lists using the task evselect in order to remove the period that contained the aforementioned flaring.
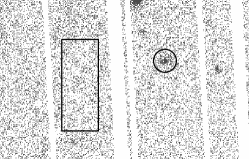
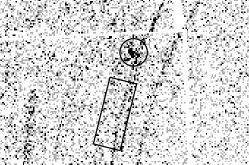
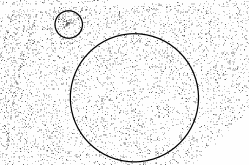
The source spectra were extracted (using the task evselect) from appropriately sized (25′′ radius for pn, 30′′ for MOS1, and 30′′ for MOS2) circular regions centered about the observed position of J1750, which was found to be consistent with the Chandra position given in Chakrabarty et al. (2008). The total number of counts (after background subtraction) was 269 for the pn detector, 153 for the MOS1 detector, and 112 for the MOS2 detector. We applied a KS test to the event lists from the source extraction regions and found no evidence of variability. Our procedure for choosing the background spectral extraction regions was slightly different for each detector due to the proximity of J1750 to straylight artifacts in the data. The straylight contamination appears as circular arcs centered about a point outside of the field of view, and is likely due to a bright source located outside of the field of view. In the pn and especially the MOS1 detectors, the position of J1750 coincided with a straylight arc, and thus the background regions for these detectors were chosen so as to include part of the same streak. For the MOS2 detector, we chose a large, circular, source-free region from which to sample the background, since the position of J1750 was not found to coincide with a streak in the MOS2 data. Figure 2 shows the XMM images of J1750 for all three detectors, along with the extraction regions and the straylight contamination.
We used rmfgen to create response matrices and arfgen to create ancillary response files. The fits were performed on the raw, unbinned spectra using W statistics (Cash, 1979), due to the small number of counts in the spectrum. The spectra were loaded into XSPEC V12 (Arnaud, 1996) and fit simultaneously over the range 0.312.0 keV with all physical parameters tied together. We used the abundances from Wilms et al. (2000) and photoelectric cross-sections from Balucinska-Church & McCammon (1992) and Yan et al. (1998). The models used for the spectral fits were multiplied by an instrumental cross-calibration coefficient which was held fixed at = 1.0 for the pn spectrum, but left free for the MOS1 and MOS2 spectra (). This parameter gave an indication of how well the MOS1 and MOS2 detectors agreed with the pn detector. The best-fit values for this parameter can be found in Table 1.
3. Results
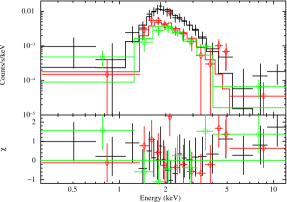
An initial fit to an absorbed power law model yielded a photon index of , a column density of 7.9 1022 cm-2, and a 0.510 keV absorbed flux of (1.2 0.1) erg cm-2 s-1. Note that this high column density is a result of the steep photon index, as the two are necessarily correlated for a simple, absorbed power law model. Nonetheless, the steep photon index given by this fit suggests that the spectrum is best described by a thermal model. Table 1 summarizes the results of our spectral fits for both a simple blackbody model (bbodyrad), and for a non-magnetized, pure hydrogen NS atmosphere model (nsatmos). All physical parameters were left free in the bbodyrad fits. In the nsatmos fits, the free parameters were the absorption due to hydrogen gas and the effective temperature111The effective temperatures for the bbodyrad and nsatmos models were multiplied by the gravitational redshift parameter in order to determine the temperature as measured by an observer at infinity. For a NS mass of 1.4 and a NS radius of 10 km, = 0.77. of the surface . The NS mass and radius were fixed at the commonly used values of 1.4 and 10 km, respectively. The nsatmos model contains a normalization parameter that controls how much of the NS surface is emitting. We kept fixed at 1 under the assumption that the emission was isotropic. The source distance parameter was held fixed at 6.79 kpc (see Section 1). Using this distance, and the fluxes from Table 1, we compute an unabsorbed, 0.510 keV luminosity of 1033 erg s-1 for the bbodyrad model and 1033 erg s-1 for the nsatmos model. A binned spectrum of J1750 and the best fit to the nsatmos model is shown in Figure 3.
Spectra from NS LMXB transients are often found to display a power law component with 1 - 2 (Campana et al., 1998). The reason for this is still not known, but it has been hypothesized that accretion at a low rate (Zampieri et al., 1995) or a pulsar wind mechanism (Illarionov & Sunyaev, 1975; Stella et al., 1986; Campana & Stella, 2000) would produce hard X-rays resulting in a power law component. We searched for such a hard component in the spectrum by supplementing both the bbodyrad and nsatmos models with a power law and holding the photon index fixed at = 1 and = 2. The results of these fits can be seen in the second and third columns of Table 1. In all cases, the best fit was found to have a value of zero for the power law normalization parameter, indicating that a power law was not required. We calculated the maximum contribution of the power law flux to the total flux by fixing the power law normalization to its upper limit (90% c.l.) and then refitting with all of the other parameters left free. The ratio of the power law normalization upper limit to the flux from the resulting fit is quoted as “Power Law Contribution” in Table 1.
| Parameter | No Power Law | = 1 | = 2 |
| nsatmos222For these fits, the NS mass, radius, and distance were fixed at 1.4 , 10 km, and 6.79 kpc respectively. Also, the normalization parameter K was held fixed under the assumption that the emission from the NS was isotropic. | |||
| cm | |||
| (eV) | |||
| Power Law Norm. 333Unabsorbed, 0.5 10 keV power law flux in units of 10-14 erg cm-2 s-1. | - | ||
| C statistic value (dof) | 2047 (3897) | 2047 (3896) | 2047 (3896) |
| (erg cm-2 s444Unabsorbed, bolometric flux (0.01 10 keV) on the pn detector for the best fit model. Note that this may be interpreted as the thermal, bolometric flux, since the best fit value for the power law normalization parameter was zero in all cases. | 10-12 | 10-12 | 10-12 |
| (erg cm-2 s555Unabsorbed, 0.5 10 keV flux on the pn detector after refitting with the power law normalization parameter fixed at its upper limit. | 10-12 | 10-12 | 10-12 |
| Power Law Contribution666Maximum possible contribution to the total 0.5 10 keV flux from the power law component. | - | 0.6% | 1.6% |
| bbodyrad | |||
| cm | |||
| (eV) | |||
| Black Body Norm.777Black body normalization in units of (R/D)2 where R is the source radius in km and D is the distance to the source in units of 10 kpc. | |||
| Power Law Norm. | - | ||
| C statistic value (dof) | 2044 (3896) | 2044 (3895) | 2044 (3895) |
| (erg cm-2 s | 10-13 | 10-13 | 10-13 |
| (erg cm-2 s | 10-13 | 10-13 | 10-13 |
| Power Law Contribution | - | 1.7% | 3.7% |
| All errors are quoted at the 90% confidence interval. | |||
4. Discussion
We have observed the transient NS LMXB J1750 in quiescence and fit its spectrum to both a black body and pure hydrogen NS atmosphere model, with an additional power law component. All of the fits yielded comparable values for the W statistic. The nsatmos model gives a 0.510. keV luminosity of 1033 erg s-1, and a bolometric luminosity of 1034 erg s-1. Our measured value of = 148 4 eV for the NS surface temperature is higher than that seen for the four, quasi-persistent NS LMXB systems where a quiescent base temperature has been identified: 123 eV for XTE J1701462 (Fridriksson et al., 2011), 70 eV for KS 1731260 (Cackett et al., 2010), 54 2 eV for MXB 165929 (Cackett et al., 2008), and 109.4 2.0 eV for EXO 0748676 (Degenaar et al., 2011).
A comparison between J1750 and other quiescent LMXB (qLMXB) systems (see Tomsick et al., 2005; Heinke et al., 2010) suggests that J1750 could be the most luminous known NS LMXB in quiescence. Figure 5 of Tomsick et al. (2005) displays a list of transient X-ray systems, both NSs and black holes (BHs), ordered by their orbital periods with their Eddington-scaled luminosities log10(/) plotted along the horizontal axis. The 0.510 keV luminosity gives log10(/) = 4.3 for J1750, which is higher than any other qLMXB system listed888At first glance, J1750 appears to be less luminous than EXO 0748676. However, the analysis of the quiescent observation (Garcia & Callanan, 1999) of EXO 0748-676 with the Einstein X-ray Observatory, which gave a luminosity of erg s-1, assumed a source distance of 10 kpc, whereas the distance to the source is now estimated to be 7.4 kpc (Galloway et al., 2008). Additionally, a current, detailed study of EXO 0748676 by Degenaar et al. (2011) indicates that the quiescent, bolometric luminosity is actually 1033 erg s-1.. The median, Eddington-scaled luminosities are shown seperately for NS and BH populations, and it is evident that the BH systems are generally less luminous. One explanation for this discrepancy is that a portion of the accretion power is lost when matter crosses the event horizon of a black hole (Narayan et al., 1997). Another explanation put forth by Fender et al. (2003) is that at low mass accretion rates, the power output of black holes may be dominated by outflows of particles in jets rather than radiation. The addition of J1750 to the NS population would raise the median Eddington-scaled luminosity and thus increase this discrepancy.
Figure 8 of Heinke et al. (2010) displays the quiescent, bolometric luminosities for various NS systems as a function of their time-averaged mass transfer rate. The cooling curves of Yakovlev & Pethick (2004) for various cooling scenarios are plotted alongside these sources. In order to estimate the time-averaged mass transfer rate for J1750, we first calculated the time-averaged luminosity by finding the average 1.512 keV count rate during outburst (as given by RXTE/ASM), and converting this to a 0.120 keV flux using PIMMS999The Portable, Interactive, Multi-Mission Simulator (PIMMS) is used to estimate fluxes given the count rate and spectral shape as measured by a particular instrument, or to convert count rates between instruments. We used the web interface for PIMMS located at http://heasarc.nasa.gov/Tools/w3pimms.html., assuming a power law spectral shape with = 2 and 5 1022 cm-2. The time-averaged mass transfer rate is related to the time-averaged luminosity by = /, where is the time-averaged luminosity, is the accretion-luminosity efficiency (Shapiro & Teukolsky (1986) give = 0.1), and is the speed of light. This procedure yields 2 10 for J1750, which, along with a quiescent luminosity of 1034 erg s-1, falls outside of the range predicted by the cooling curves.
It is possible that the exceptionally high luminosity and NS surface temperature that we have observed for J1750 is due to the fact that the crust of the NS was not in thermal equilibrium with the core during our observation, and that the crust has since cooled to a normal level. This might occur if say, our observation took place too soon after an outburst. The last known outburst to occur before our observation was in 2008 (see Figure 1) and persisted for 140 days (Markwardt & Swank, 2008; Linares et al., 2008a). While monitoring J1750 as it decayed back down to quiescence with the Swift X-Ray Telescope (XRT), Linares et al. (2008b) detected a flare 67 days after the main burst event (This flare is denoted by the triangle at MJD 54747 in the bottom panel of Figure 1). Following this flare, RXTE/PCA continued to detect low-level activity until a data gap between MJD 5476954870 prevented further coverage. Once the monitoring was resumed on MJD 54870, RXTE/PCA continued to detect low-level activity for about 10 days, at which point the X-ray count rate had reached the baseline level. Thus, the outburst may have extended out as far as MJD 54880. RXTE/PCA did not detect J1750 between MJD 54880 and the time of the XMM observation (MJD 55293), and we estimate that the upper limit on the RXTE/PCA count rate is 5 counts s-1 PCU-1, which, using PIMMS with a = 2 power law, and with 6.0 1022 cm-2, gave a 210 keV luminosity upper limit of 2.7 1035 erg s-1. This upper limit is low enough that it is very likely that J1750 was in quiescence during this period of time. We summarize by stating that J1750 spent at least 413 days in quiescence between the 2008 outburst and our observation with XMM. We note that two quasi-persistent sources, MXB 165929 and KS 1731260, were monitored repeatedly in X-rays after the cessation of outbursts lasting 2.5 yr and 12.5 yr, respectively (Cackett et al., 2006). An exponential decay to a constant was fit to the cooling curves of these two sources, yielding e-folding times of days for KS 1731260 and days for MXB 165929 (Cackett et al., 2006). Therefore, given that J1750 is a transiently accreting system - i.e. the crust is likely not heated drastically out of equilibrium with the core during accretion episodes - and considering that the e-folding timescales for thermal relaxation in two quasi-persistent systems are comparable to the time spent in quiescence by J1750 before our observation, we suspect that the NS crust of J1750 was indeed close to its equilibrium temperature and luminosity during the observation.
Another possibility is that the quiescent luminosity of J1750 is variable and that we happened to observe it in a particularly luminous state. This type of behavior has been seen in two sources; The quiescent luminosity of Cen X4 was found to vary by a factor of 4.4 over a timescale of 7.5 years (Cackett et al., 2010b), which, as the authors show, requires variability in the thermal component. Rutledge et al. (2002) performed multiple observations of Aql X1 in quiescence for five months following an outburst in 2000. The luminosity was found to decrease by 50% over the first 3 months, increase by 35% over the following month, and then remained constant over the final month. While Rutledge et al. (2002) found that the variability could only be explained by a variable NS surface temperature, a re-analysis by Campana & Stella (2003) showed that the variability could be explained by correlated changes in the power law normalization and column density. Furthermore, Cackett et al. (2011) analyzed 10 more quiescent observations of Aql X1 and could not conclude whether the power law component, the thermal component, or both components were responsible for the variability in quiescent luminosity from epoch to epoch.
It is believed that the variability in quiescent luminosity is likely due to ongoing, low-level and/or episodic accretion during quiescence. Fridriksson et al. (2011) observed flaring behavior from XTE J1701462 in quiescence during which the thermal flux, power law flux, and NS surface temperature were all found to increase significantly, resulting in a total luminosity of which % was due to the power law component. The authors attribute this to accretion episodes which overall are too faint to be detected by all-sky monitors. If a similar event had occured in J1750, one might expect to see a significant power law component in the spectrum. But as reported in Section 3, we did not detect a power law component in the spectrum of J1750.
The absence of a power law component in the spectrum of J1750 conflicts with the results of Jonker et al. (2004), where an anticorrelation was found between the quiescent 0.510 keV luminosity and the power law contribution to the luminosity. The trend appears to reach a minimum at 1 - 2 1033 erg s-1. At luminosities higher than this, the power law fraction appears to be correlated with the luminosity as indicated by the multiple observations of Aql X1 and XTE J1709267 in quiescence. The authors suggest that the power law component is due to residual accretion, an idea that is motivated by the observation that the power law fraction of XTE J1709267 was found to decrease as a function of time after the end of an outburst. For J1750, we have = erg s-1 and a maximum power law fraction of 1.6%, or 3.7% if the black body fits are also considered. This is in contrast to the correlation between power law fraction and luminosity, which would predict a power law fraction of 2550% for the observed luminosity of J1750. While J1750 does not appear to follow the trend of increasing power law fraction at higher quiescent luminosities, this area of parameter space is rather sparse, and J1750 could be one of several unknown sources displaying such behavior.
5. Conclusion
Given the amount of time spent in quiescence before our observation, we conclude that J1750 was likely in an equilibrium state, with a NS surface temperature close to the core temperature. The absence of a power law component leads us to believe that the high luminosity was probably not due to an undetected accretion episode. Follow-up observations of J1750 in quiescence could shed light on this conclusion, either by detecting J1750 at a comparable luminosity and NS surface temperature and confirming it as an abnormal source, or by finding that it has cooled down to a relatively normal level consistent with NS cooling theory.
References
- Arnaud (1996) Arnaud, K. A. 1996, in Astronomical Society of the Pacific Conference Series, Vol. 101, Astronomical Data Analysis Software and Systems V, ed. G. H. Jacoby & J. Barnes, 17
- Balucinska-Church & McCammon (1992) Balucinska-Church, M., & McCammon, D. 1992, ApJ, 400, 699
- Brown et al. (2002) Brown, E. F., Bildsten, L., & Chang, P. 2002, ApJ, 574, 920
- Brown et al. (1998) Brown, E. F., Bildsten, L., & Rutledge, R. E. 1998, ApJ, 504, L95
- Brown & Cumming (2009) Brown, E. F., & Cumming, A. 2009, ApJ, 698, 1020
- Cackett et al. (2010) Cackett, E. M., Brown, E. F., Cumming, A., Degenaar, N., Miller, J. M., & Wijnands, R. 2010, ApJ, 722, L137
- Cackett et al. (2010b) Cackett, E. M., Brown, E. F., Miller, J. M., & Wijnands, R. 2010b, ApJ, 720, 1325
- Cackett et al. (2011) Cackett, E. M., Fridriksson, J. K., Homan, J., Miller, J. M., & Wijnands, R. 2011, MNRAS, 414, 3006
- Cackett et al. (2006) Cackett, E. M., Wijnands, R., Linares, M., Miller, J. M., Homan, J., & Lewin, W. H. G. 2006, MNRAS, 372, 479
- Cackett et al. (2008) Cackett, E. M., Wijnands, R., Miller, J. M., Brown, E. F., & Degenaar, N. 2008, ApJ, 687, L87
- Campana et al. (1998) Campana, S., Colpi, M., Mereghetti, S., Stella, L., & Tavani, M. 1998, A&A Rev., 8, 279
- Campana & Stella (2000) Campana, S., & Stella, L. 2000, ApJ, 541, 849
- Campana & Stella (2003) Campana, S., & Stella, L. 2003, ApJ, 597, 474
- Cash (1979) Cash, W. 1979, ApJ, 228, 939
- Chakrabarty et al. (2008) Chakrabarty, D., Jonker, P. G., & Markwardt, C. B. 2008, The Astronomer’s Telegram, 1490
- Degenaar et al. (2011) Degenaar, N., et al. 2011, MNRAS, 412, 1409
- Fender et al. (2003) Fender, R. P., Gallo, E., & Jonker, P. G. 2003, MNRAS, 343, L99
- Fridriksson et al. (2011) Fridriksson, J. K., et al. 2011, ApJ, 736, 162
- Galloway et al. (2008) Galloway, D. K., Muno, M. P., Hartman, J. M., Psaltis, D., & Chakrabarty, D. 2008, ApJS, 179, 360
- Garcia & Callanan (1999) Garcia, M. R., & Callanan, P. J. 1999, AJ, 118, 1390
- Haensel & Zdunik (1990) Haensel, P., & Zdunik, J. L. 1990, A&A, 227, 431
- Heinke et al. (2010) Heinke, C. O., et al. 2010, ApJ, 714, 894
- Illarionov & Sunyaev (1975) Illarionov, A. F., & Sunyaev, R. A. 1975, A&A, 39, 185
- Jonker et al. (2004) Jonker, P. G., Galloway, D. K., McClintock, J. E., Buxton, M., Garcia, M., & Murray, S. 2004, MNRAS, 354, 666
- Kaaret et al. (2002) Kaaret, P., in ’t Zand, J. J. M., Heise, J., & Tomsick, J. A. 2002, ApJ, 575, 1018
- Kuulkers et al. (2011) Kuulkers, E., et al. 2011, The Astronomer’s Telegram, 3172
- Linares et al. (2008a) Linares, M., Degenaar, N., Altamirano, D., Wijnands, R., van der Klis, M., & Markwardt, C. 2008a, The Astronomer’s Telegram, 1662
- Linares et al. (2008b) Linares, M., Degenaar, N., Wijnands, R., & Altamirano, D. 2008b, The Astronomer’s Telegram, 1777
- Markwardt & Swank (2008) Markwardt, C. B., & Swank, J. H. 2008, The Astronomer’s Telegram, 1425
- Narayan et al. (1997) Narayan, R., Garcia, M. R., & McClintock, J. E. 1997, ApJ, 478, L79
- Natalucci et al. (1999) Natalucci, L., Cornelisse, R., Bazzano, A., Cocchi, M., Ubertini, P., Heise, J., in ’t Zand, J. J. M., & Kuulkers, E. 1999, ApJ, 523, L45
- Natalucci et al. (2011) Natalucci, L., Fiocchi, M., Bazzano, A., Kuulkers, E., & Sanchez, C. 2011, The Astronomer’s Telegram, 3181
- Rutledge et al. (2002) Rutledge, R. E., Bildsten, L., Brown, E. F., Pavlov, G. G., & Zavlin, V. E. 2002, ApJ, 577, 346
- Shapiro & Teukolsky (1986) Shapiro, S. L., & Teukolsky, S. A. 1986, Black Holes, White Dwarfs and Neutron Stars: The Physics of Compact Objects, ed. Shapiro, S. L. & Teukolsky, S. A.
- Shternin et al. (2007) Shternin, P. S., Yakovlev, D. G., Haensel, P., & Potekhin, A. Y. 2007, MNRAS, 382, L43
- Stella et al. (1986) Stella, L., White, N. E., & Rosner, R. 1986, ApJ, 308, 669
- Tomsick et al. (2005) Tomsick, J. A., Gelino, D. M., & Kaaret, P. 2005, ApJ, 635, 1233
- Wilms et al. (2000) Wilms, J., Allen, A., & McCray, R. 2000, ApJ, 542, 914
- Yakovlev & Pethick (2004) Yakovlev, D. G., & Pethick, C. J. 2004, ARA&A, 42, 169
- Yan et al. (1998) Yan, M., Sadeghpour, H. R., & Dalgarno, A. 1998, ApJ, 496, 1044
- Zampieri et al. (1995) Zampieri, L., Turolla, R., Zane, S., & Treves, A. 1995, ApJ, 439, 849
- Zavlin et al. (1996) Zavlin, V. E., Pavlov, G. G., & Shibanov, Y. A. 1996, A&A, 315, 141