Spatially resolved H maps and sizes of 57 strongly star-forming galaxies at from 3D-HST: evidence for rapid inside-out assembly of disk galaxies
Abstract
We investigate the build-up of galaxies at using maps of H and stellar continuum emission for a sample of 57 galaxies with rest-frame H equivalent widths Å in the 3D-HST grism survey. We find that the H emission broadly follows the rest-frame -band light but that it is typically somewhat more extended and clumpy. We quantify the spatial distribution with the half-light radius. The median H effective radius is kpc but the sizes span a large range, from compact objects with kpc to extended disks with kpc. Comparing H sizes to continuum sizes, we find for the full sample. That is, star formation, as traced by H, typically occurs out to larger radii than the rest-frame R-band stellar continuum; galaxies are growing their radii and building up from the inside out. This effect appears to be somewhat more pronounced for the largest galaxies. Using the measured H sizes, we derive star formation rate surface densities, . We find that ranges from M⊙ yr-1 kpc-2 for the largest galaxies to M⊙ yr-1 kpc-2 for the smallest galaxies, implying a large range in physical conditions in rapidly star-forming galaxies. Finally, we infer that all galaxies in the sample have very high gas mass fractions and stellar mass doubling times Myr. Although other explanations are also possible, a straightforward interpretation is that we are simultaneously witnessing the rapid formation of compact bulges and large disks at z.
Subject headings:
galaxies: evolution — galaxies: formation — galaxies: high-redshift.
1. Introduction
Many galaxies in the Universe today are in their twilight years, with low star formation rates compared to the already assembled stellar mass. As an example, the specific star formation rate (SSFR, the star formation rate divided by the stellar mass) of our own Galaxy is Gyr-1, which means that at its present growth rate it would take the Milky Way Gyr to double its stellar mass. By contrast, at global star formation rates were much higher than they are today (e.g., Lilly et al. 1996; Madau et al. 1996; Geach et al. 2008) and it was probably during this epoch that galaxies assembled the bulk of their stellar mass.
Recent studies have shown that the star formation rate of distant galaxies is correlated with their stellar mass, and that the relation of star formation rate with mass evolves with redshift (e.g., Zheng et al. 2007; Damen et al. 2009; Noeske et al. 2007; Elbaz et al. 2007; Daddi et al. 2007; Karim et al. 2011). Using high spatial resolution imaging, it has also been shown that star formation rates correlate with the structural properties of the existing stellar populations: galaxies that are actively forming stars typically have low Sersic index and surface density, whereas quiescent galaxies have high Sersic index and surface density (e.g., Kauffmann et al. 2003; Franx et al. 2008; Wuyts et al. 2011; van Dokkum et al. 2011; Bell et al. 2012).
These global relations tell us which galaxies are growing at a particular cosmic epoch, but not where they are growing, that is, which structural components are being built up. In order to address the where, we need to know the spatial distributions of both the existing stellar population (representing a galaxy’s history) and of the ongoing star formation (representing a galaxy’s future). Star formation can be traced by the H line emission, as it scales with the quantity of ionizing photons produced by hot young stars (Kennicutt 1998). The stellar mass of a galaxy can be traced using the rest-frame optical or near-IR stellar continuum emission.
Obtaining H and stellar continuum maps of distant galaxies with kpc resolution is challenging, and has so far only been possible with integral field units (IFUs) on 8–10m class telescopes (e.g., Genzel et al. 2008; Law et al. 2009; Wright et al. 2009; Wisnioski et al. 2011; Stark et al. 2008; Jones et al. 2010; Yuan et al. 2011; Kriek et al. 2009). These studies have shown that many star forming galaxies at are clumpy and irregular in their emission. This is also seen in the rest-frame UV (e.g., Lotz et al. 2006; Ravindranath et al. 2006). For a small sample of galaxies observed with the NICMOS camera on the Hubble Space Telescope (HST), Förster Schreiber et al. (2011a, 2011b) showed that the spatial extent of their stars and star formation was very similar, even though individual clumps of star formation do not necessarily coincide with clumps of already-existing stars.
Here we build on these studies by analyzing a sample of 57 galaxies with high resolution H and stellar continuum maps at , a time during which galaxies probably transitioned from the clumpy, irregular morphologies commonly seen at to the regular morphologies of normal galaxies at . This study has become possible owing to the near-IR imaging and slitless spectroscopic capabilities provided by the new WFC3 camera on HST. As shown in this Letter, WFC3 can provide maps of emission lines and continuum emission at spatial resolution. These data are complementary to ground-based IFU studies, as they provide continuum and line maps with a stable, high Strehl ratio PSF at the expense of having very low spectral resolution. We use these data, taken as part of the 3D-HST survey, to determine where and with what intensity galaxies at are building up their stellar mass. We assume H km s-1Mpc-1, , and .
2. Data
2.1. Sample
H maps are created from the spatially resolved spectra of 3D-HST, a 248-orbit Treasury program on the Hubble Space Telescope (Brammer et al. 2012, van Dokkum et al. 2011). Together with data taken in a previous program, 3D-HST will cover the five well-studied extra-galactic fields that are also covered by the CANDELS imaging program (Grogin et al. 2011; Koekemoer et al. 2011): AEGIS, COSMOS, GOODS-North 111Data taken in program GO-11600 (PI: B. Weiner)., GOODS-South, and UDS. The data presented in this paper are based on the pointings, roughly half of the full data set, that were obtained prior to June 2011 (see van Dokkum et al. 2011, Brammer et al. 2012).
The WFC3 G141 grism provides spatially resolved spectra of all sources in the field. The wavelength range of the G141 grism, m, covers the H emission line for galaxies in the redshift range . The survey also provides broad-band near-infrared imaging in the F140W filter, which samples the rest-frame band for . High spatial resolution maps of and continuum emission taken with the same camera under the same conditions is a key strength of this program as it allows a direct comparison of the structural features present in the distribution of the light of stars and of star formation. The spatial resolution is , sampled with pixels, corresponding to 0.5 kpc at .
The data reduction uses the aXe code (Kümmel et al. 2009) with modifications, and is described in Brammer et al. (2012). Redshifts and equivalent widths (EWs) were determined from summed, one-dimensional spectra, as described in detail in Brammer et al. (2012). Along with these measurements, the software provides drizzled two-dimensional images of the galaxies in the F140W band and drizzled two-dimensional spectra.
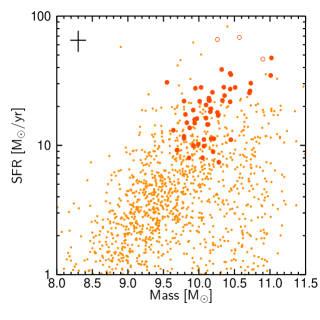
Targets were selected to have redshifts , total F140W magnitude and rest-frame Å; we thus focus here on the objects that are among the galaxies most actively forming stars relative to their existing stellar mass, during a transitional epoch in which galaxies were assembling the structure we see today. This is illustrated in Fig. 1, which shows the distribution of the selected galaxies in the SFR–mass diagram (see e.g., Wuyts et al. 2011). Stellar masses were derived using the FAST code (Kriek et al. 2009a) (see Brammer et al. 2012) and star formation rates were determined from the H luminosities using the Kennicutt (1998) relation. These criteria further ensure reliable and high S/N measurements of the line emission. Due to the nature of slitless grism spectroscopy, a spectrum can be contaminated by flux from overlapping spectra from the object’s neighbors. As a final criterion we limited the sample to objects for which the estimated contamination is less than 5 % of the measured flux.
The final sample comprises 57 galaxies. We note that no selection on environment was made. Three of the galaxies in this sample have X-ray fluxes erg/s which means that they almost certainly host AGN. We did not remove these galaxies from plots but marked them by open symbols. As we show later in Fig. 3, these objects have unique morphological signatures in the 2D spectra as their H line widths exceed the pixel size of km/s.
2.2. Maps of H and Continuum Emission
The combination of the WFC3 camera’s high native spatial resolution and the grism’s point source spectral resolution yields a spectrum that is best envisaged as images of a galaxy taken at Å increments (23 Å after drizzling) and placed next to each other on the detector. Thus, an emission feature in a high spatial resolution slitless spectrum is essentially an image of a galaxy at that wavelength. To create an emission line map of a galaxy, we masked the emission line and fit a polynomial to the continuum of its collapsed, one-dimensional spectrum. This model fit was then scaled and subtracted row-by-row from the two-dimensional spectrum; the residual is a map of the galaxy in the light of the line.
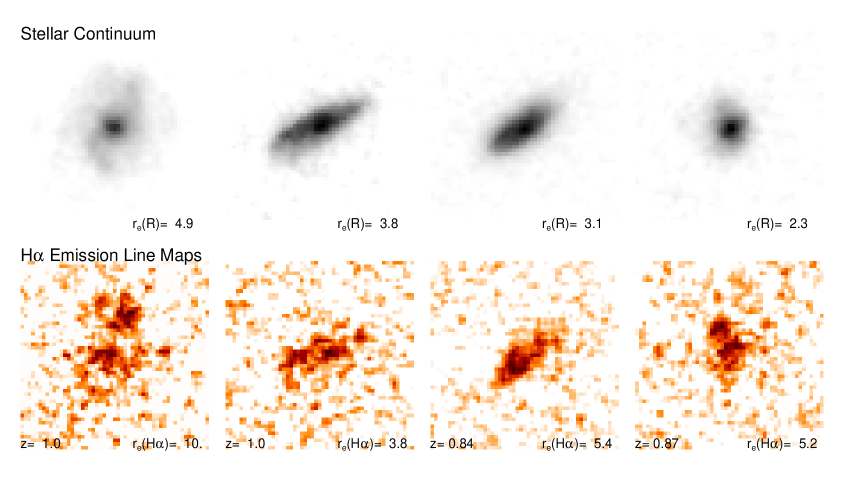
Fig. 2 shows emission line maps and their corresponding F140W (rest-frame optical) images for eight representative galaxies which illustrate trends seen in the full sample. Inspecting the H maps and the continuum maps, we find that the spatial distribution of H broadly follows the spatial distribution of stellar light. However, as has been seen previously at higher redshift, H often appears to be clumpier and more asymmetric than its stellar counterpart (Genzel et al. 2008; Law et al. 2009, 2011; Förster Schreiber et al. 2011a, 2011b). In the next section we quantify the spatial extent of the and stellar continuum emission by measuring their sizes.
Several uncertainties in the interpretation of the line maps should be emphasized here. First, H and [N ii] are not resolved with the G141 grism, and H and [S ii] are barely resolved. The unknown ratios of these lines lead to uncertainties in , but also in the H morphologies, as the line ratios almost certainly vary with position (Genzel et al. 2008; Cresci et al. 2010; Yuan et al. 2011; Queyrel et al. 2011). A second systematic uncertainty is dust attenuation. Differential extinction could affect the spatial distribution in the maps and the resulting size measurements. Third, the position of the H emission relative to the continuum emission in the wavelength (“”) direction is degenerate with the redshift of the object. 222Note that this does not affect our size measurements in §3. Finally, the F140W filter contains the H line, introducing a built-in correlation between the emission line maps and the continuum maps. This effect is small, as for galaxies in our sample the line typically contributes only to the F140W flux.
3. H and continuum Sizes
A first order parameterization of the H distribution is its effective radius (or half-light radius). The standard method for determining sizes of distant galaxies is to fit two-dimensional Sersic (1968) models, convolved with the point spread function (e.g., Peng et al. 2010). However, such parametric methods do not provide meaningful results for the H images, as they are typically clumpy and often have asymmetrical or centrally-depressed light profiles (Shapley 2011). Instead, we measured effective radii (half-light radii) for both the H images and the rest-frame optical continuum images as follows. We first deconvolved the images, using empirical PSFs and a variation of the CLEAN algorithm. We verified that the key results do not depend on the deconvolution algorithm. Next, growth curves were calculated using circular apertures centered on the luminosity-weighted mean and positions. The H center was not forced to coincide with the F140W center. The effective radii were defined as the radii containing 50 % of the maximum growth curve value. From varying the deconvolution algorithm and the sky determination we estimate typical errors of dex.
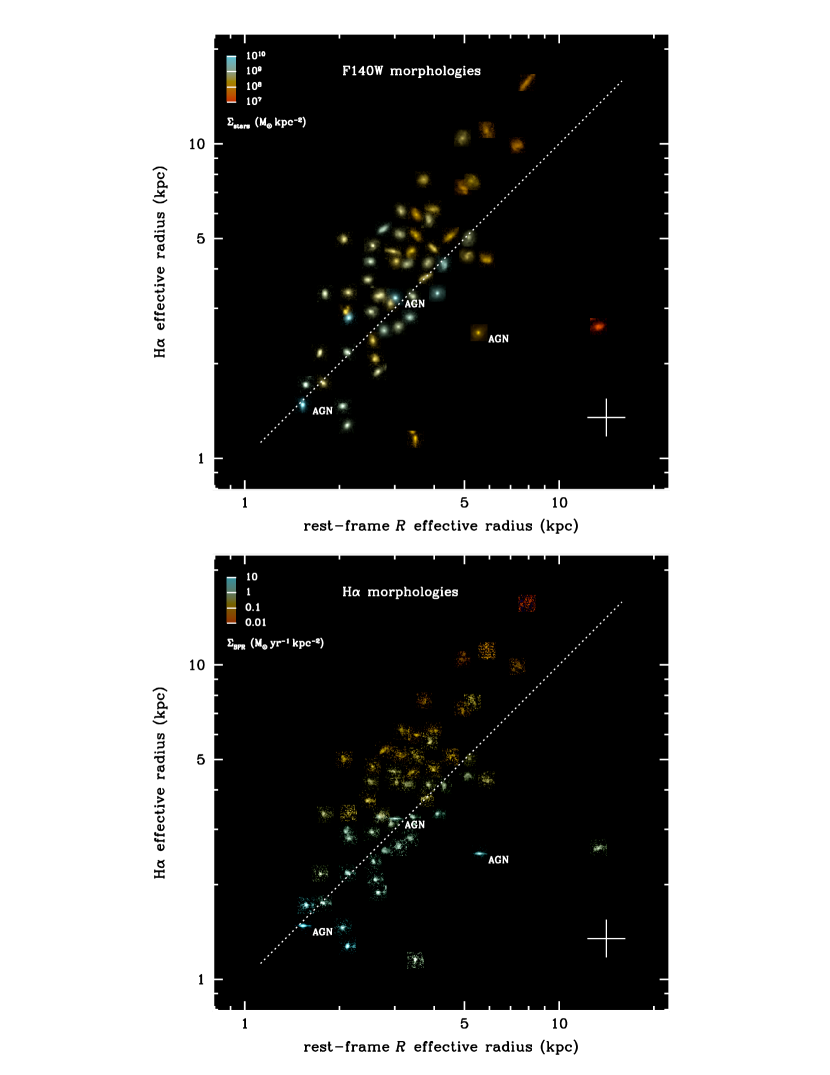
We find that the H sizes span a very large range, from 1 kpc to 15 kpc. The immediate implication is that star formation in strongly star-forming galaxies at occurs on a large range of physical scales, from the sizes of compact objects (such as bulges) to those of large disks. In Fig. 3 we compare the H sizes to the rest-frame optical sizes of the galaxies. This comparison provides information on where galaxies are growing: galaxies for which the effective radius of star formation is equal to their stellar continuum radius should experience little structural change, as their current growth follows their past growth. Galaxies for which have star formation which is more extended than their assembled stellar mass, implying that their growth began with a smaller central region and has proceeded outward: inside-out growth. This might be expected if gas is accreted onto a galaxy and then cools onto the galaxy’s disk (e.g., Brooks et al. 2009). Galaxies that have have star formation which is more concentrated than their stars, which might happen after a gas-rich merger producing a central star burst. Thus, the location of a galaxy on a H size vs. rest-frame optical size diagram provides information about where it’s growing.
As is clear from Fig. 3 the sizes generally track the F140W (rest-frame band) sizes but are typically somewhat larger. Excluding the three AGN, the median ratio of star formation size to rest-frame optical size for our sample is , where the error was derived from bootstrap resampling. The ratio has an rms scatter of dex, which implies that there is a considerable range in the spatial properties of growth for the galaxies in this sample.
This scatter reflects partly the fact that for a given stellar continuum size there is a range in H sizes. It also reflects the fact that the relation between H size and rest-frame band size appears slightly steeper than linear. Dividing the galaxies into two subsamples based on their H sizes shows that the smallest 50 % of galaxies have median , while the largest 50 % have median . That is, galaxies with extended emission in an absolute sense also tend to have which is more extended relative to their already-constructed stellar component. The range of values of the H to stellar continuum radius suggest that we may be observing the construction of different structural components in different galaxies: from a central concentration to an extended disk around a previously formed central concentration.
4. Star Formation Surface Densities
The star formation surface density, i.e., the star formation rate per unit area, is thought to be a key parameter in probing the physics driving the conversion of gas to stars (Genzel et al. 2010; Daddi et al. 2010; Wuyts et al. 2011; Rodighiero et al. 2011). Star formation surface densities are generally determined from stellar continuum sizes, under the assumption that star formation occurs over the same area as the emitted stellar continuum light. Here, however, we have measured (H ), the radius over which star formation is occurring, and we can directly determine
i.e., the star formation rate divided by the area covered by the line-emitting gas. The scatter in Fig. 3 implies that star formation surface densities determined from continuum radii (as done in e.g., Wuyts et al. 2011) have typical errors of dex.
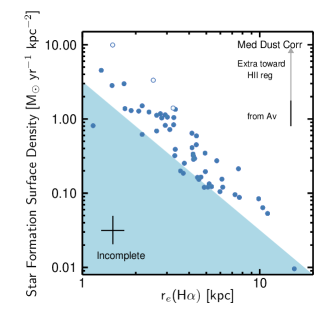
In Fig. 4 we show (SFR) as a function of H size. It is clear that there is a very large range. Small galaxies have much higher star formation densities than large galaxies but that is mostly driven by our sample selection. The compact objects have M⊙ yr-1 kpc-2 and the most extended objects have M⊙ yr-1 kpc-2, implying the simultaneous build-up of both extended and compact features with high and low star formation surface densities.
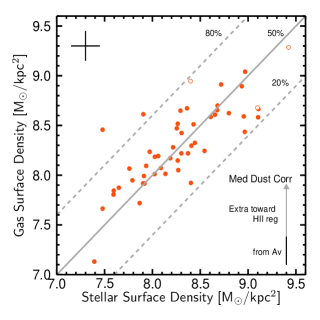
The star formation surface densities (see Fig. 4) of these galaxies can be used to infer gas surface densities using the Kennicutt (1998) relation. Comparing their inferred gas surface densities to their stellar surface densities (Fig. 5) suggests that most galaxies in this sample have high gas mass fractions , even without dust correction. The median dust correction as derived from SED fitting is shown in black and the additional attenuation estimated to exist toward HII regions is shown in gray (Calzetti et al. 2000). Given the uncertainty introduced by the magnitude of this possible dust correction, it will be interesting to measure these gas densities directly (e.g., Tacconi et al. 2010; Daddi et al. 2010). The high gas fractions imply the presence of large masses of gas to convert to stars. This conversion is occurring rapidly; the stellar masses and star formation rates of the galaxies imply typical doubling times of Myr assuming no dust correction, or Myr using the maximum dust correction.
5. Discussion
Using new data from the 3D-HST survey, we have constructed high-resolution maps of stellar continuum and H emission to uncover where galaxies are growing and at what intensities. We find that the H emission generally tracks optical light but is slightly more extended. The immediate implication is that the galaxies have gradients in their stellar population properties, e.g., in , metallicity, or age. We cannot reliably determine the cause of the gradient without additional data, particularly on the dust distributions. However, the most straightforward interpretation is that the youngest stars have a more extended distribution than older stars, and that the galaxies grow inside-out. This result was expected from the observed size evolution of star forming galaxies (e.g., Williams et al. 2010) and consistent with theoretical expectations (Sales et al. 2009; Dutton & van den Bosch 2011). Interestingly, this size difference has not been seen in IFU observations of galaxies (Förster Schreiber et al. 2011a). More compact galaxies, on the other hand, do not appear to be in the process of growing their radii with a median of one.
The star formation surface densities of the galaxies, representing the intensity of star formation, show a range of two orders of magnitude. All galaxies have very high gas fractions, . Thus, we see the build-up of very compact and very extended components with high gas fractions, implying that these components are in the early phases of assembly. It is tempting to suggest that the galaxies with extended, low surface density star formation are in the process of building their disks while galaxies with compact, high surface density star formation are building bulges or compact early-type galaxies.
It is not clear how the compact galaxies and the large galaxies are related. A possible interpretation for the large range in properties is that we are looking at an evolutionary sequence in which the compact, rapidly star-forming galaxies are the young stages of the extended galaxies. For instance, galaxies could rapidly build up their bulges through compact star formation and then subsequently more slowly grow their extended disks by continuous gas accretion. However, the reverse may also be possible (e.g. Dekel et al. 2009, Hopkinset al. 2011). It may also be that some of the compact, high-intensity star-forming galaxies will evolve into compact quiescent galaxies similar to those seen frequently at higher redshifts (e.g., van Dokkum et al. 2008). In this context it is interesting to note that the total baryonic surface densities of the densest objects () approach the densities of early-type galaxies at (Franx et al. 2008).
This study can be expanded upon in many ways. The galaxies selected for this paper represent the most actively star-forming galaxies at the peak epoch of global star formation. In future papers we intend to include more typical star-forming galaxies at this epoch. It will also be interesting to extend this study to both higher and lower redshifts: it may be that the properties of galaxies are very similar at fixed , independent of redshift. As noted in §2, both dust extinction and the contribution of [N ii] and [S ii] to the H line emission are fundamental uncertainties in both the quantities measured and spatial distribution of H flux. Assessing the contribution of [NII] requires mapping on a spectrograph with higher spectral resolution such that H and [NII] are distinguishable. Differential dust extinction could conceivably be corrected using spatially-resolved maps of Balmer decrements.
References
- (1)
- (2) Bell, E. F., van der Wel, A., Papovich, C., Kocevski, D., Lotz, J., McIntosh, D. H., Kartaltepe, J., Faber, S. M., et al. 2012, ApJ, submitted (arXiv:1110.3786)
- (3)
- (4) Brammer, G. B., van Dokkum, P. G., Franx, M., Fumagalli, M., Patel, S., Rix, H.-W., Skelton, R. E., Kriek, M., et al. 2012, ApJS, submitted
- (5)
- (6) Brooks, A. M., Governato, F., Quinn, T., Brook, C. B., & Wadsley, J. 2009, The Astrophysical Journal, 694, 396
- (7)
- (8) Calzetti, D., Armus, L., Bohlin, R. C., Kinney, A. L., Koornneef, J., & Storchi-Bergmann, T. 2000, ApJ, 533, 682
- (9)
- (10) Cresci, G., Mannucci, F., Maiolino, R., Marconi, A., Gnerucci, A., & Magrini, L. 2010, Nature, 467, 811
- (11)
- (12) Daddi, E., Dickinson, M., Morrison, G., Chary, R., Cimatti, A., Elbaz, D., Frayer, D., Renzini, A., et al. 2007, ApJ, 670, 156
- (13)
- (14) Daddi, E., Elbaz, D., Walter, F., Bournaud, F., Salmi, F., Carilli, C., Dannerbauer, H., Dickinson, M., et al. 2010, ApJ, 714, L118
- (15)
- (16) Damen, M., Labbé, I., Franx, M., van Dokkum, P. G., Taylor, E. N., & Gawiser, E. J. 2009, ApJ, 690, 937
- (17)
- (18) Dekel, A. & Ceverino, D. 2009, ApJ, 703, 785
- (19)
- (20) Dutton, A. A. & van den Bosch, F. C. 2011, ArXiv e-prints
- (21)
- (22) Elbaz, D., Daddi, E., Le Borgne, D., Dickinson, M., Alexander, D. M., Chary, R.-R., Starck, J.-L., Brandt, W. N., et al. 2007, A&A, 468, 33
- (23)
- (24) Förster Schreiber, N. M., Shapley, A. E., Erb, D. K., Genzel, R., Steidel, C. C., Bouché, N., Cresci, G., & Davies, R. 2011a, ApJ, 731, 65
- (25)
- (26) Förster Schreiber, N. M., Shapley, A. E., Genzel, R., Bouché, N., Cresci, G., Davies, R., Erb, D. K., Genel, S., et al. 2011b, ApJ, 739, 45
- (27)
- (28) Franx, M., van Dokkum, P. G., Schreiber, N. M. F., Wuyts, S., Labbé, I., & Toft, S. 2008, ApJ, 688, 770
- (29)
- (30) Geach, J. E., Smail, I., Best, P. N., Kurk, J., Casali, M., Ivison, R. J., & Coppin, K. 2008, MNRAS, 388, 1473
- (31)
- (32) Genzel, R., Burkert, A., Bouché, N., Cresci, G., Förster Schreiber, N. M., Shapley, A., Shapiro, K., Tacconi, L. J., et al. 2008, ApJ, 687, 59
- (33)
- (34) Genzel, R., Tacconi, L. J., Gracia-Carpio, J., Sternberg, A., Cooper, M. C., Shapiro, K., Bolatto, A., Bouché, N., et al. 2010, MNRAS, 407, 2091
- (35)
- (36) Grogin, N. A., Kocevski, D. D., Faber, S. M., Ferguson, H. C., Koekemoer, A. M., Riess, A. G., Acquaviva, V., Alexander, D. M., et al. 2011, ArXiv e-prints
- (37)
- (38) Hopkins, P. F., Keres, D., Murray, N., Quataert, E., & Hernquist, L. 2011, ArXiv e-prints, 1111.6591
- (39)
- (40) Jones, T. A., Swinbank, A. M., Ellis, R. S., Richard, J., & Stark, D. P. 2010, Monthly Notices of the Royal Astronomical Society
- (41)
- (42) Karim, A., Schinnerer, E., Martínez-Sansigre, A., Sargent, M. T., van der Wel, A., Rix, H. W., Ilbert, O., Smolčić, V., et al. 2011, The Astrophysical Journal, 730, 61
- (43)
- (44) Kauffmann, G., Heckman, T. M., White, S. D. M., Charlot, S., Tremonti, C., Peng, E. W., Seibert, M., Brinkmann, J., et al. 2003, MNRAS, 341, 54
- (45)
- (46) Kennicutt, Jr., R. C. 1998, ApJ, 498, 541
- (47)
- (48) Koekemoer, A. M., Faber, S. M., Ferguson, H. C., Grogin, N. A., Kocevski, D. D., Koo, D. C., Lai, K., Lotz, J. M., et al. 2011, ArXiv e-prints
- (49)
- (50) Kriek, M., van Dokkum, P. G., Labbé, I., Franx, M., Illingworth, G. D., Marchesini, D., & Quadri, R. F. 2009a, ApJ, 700, 221
- (51)
- (52) Kriek, M., van Dokkum, P. G., Franx, M., Illingworth, G. D., & Magee, D. K. 2009b, ApJ, 705, L71
- (53)
- (54) Kümmel, M., Walsh, J. R., Pirzkal, N., Kuntschner, H., & Pasquali, A. 2009, PASP, 121, 59
- (55)
- (56) Law, D. R., Steidel, C. C., Erb, D. K., Larkin, J. E., Pettini, M., Shapley, A. E., & Wright, S. A. 2009, ApJ, 697, 2057
- (57)
- (58) Law, D. R., Steidel, C. C., Shapley, A. E., Nagy, S. R., Reddy, N. A., & Erb, D. K. 2011, ArXiv e-prints
- (59)
- (60) Lilly, S. J., Le Fèvre, O., Hammer, F., & Crampton, D. 1996, The Astrophysical Journal, 460
- (61)
- (62) Lotz, J. M., Madau, P., Giavalisco, M., Primack, J., & Ferguson, H. C. 2006, The Astrophysical Journal, 636, 592
- (63)
- (64) Madau, P., Ferguson, H. C., Dickinson, M. E., Giavalisco, M., Steidel, C. C., & Fruchter, A. 1996, Monthly Notices of the Royal Astronomical Society, 283, 1388
- (65)
- (66) Noeske, K. G., Weiner, B. J., Faber, S. M., Papovich, C., Koo, D. C., Somerville, R. S., Bundy, K., Conselice, C. J., et al. 2007, ApJ, 660, L43
- (67)
- (68) Peng, C. Y., Ho, L. C., Impey, C. D., & Rix, H.-W. 2010, The Astronomical Journal, 139, 2097
- (69)
- (70) Queyrel, J., Contini, T., Kissler-Patig, M., Epinat, B., Amram, P., Garilli, B., Le Fevre, O., Moultaka, J., et al. 2011, ArXiv e-prints
- (71)
- (72) Ravindranath, S., Giavalisco, M., Ferguson, H. C., Conselice, C., Katz, N., Weinberg, M., Lotz, J., Dickinson, M., et al. 2006, The Astrophysical Journal, 652, 963
- (73)
- (74) Rodighiero, G., Daddi, E., Baronchelli, I., Cimatti, A., Renzini, A., Aussel, H., Popesso, P., Lutz, D., et al. 2011, ApJ, 739, L40
- (75)
- (76) Sales, L. V., Navarro, J. F., Schaye, J., Dalla Vecchia, C., Springel, V., Haas, M. R., & Helmi, A. 2009, MNRAS, 399, L64
- (77)
- (78) Sersic, J. L. 1968, Atlas de galaxias australes, ed. Sersic, J. L.
- (79)
- (80) Shapley, A. E. 2011, Annual Review of Astronomy and Astrophysics, 49, 525
- (81)
- (82) Stark, D. P., Swinbank, A. M., Ellis, R. S., Dye, S., Smail, I. R., & Richard, J. 2008, Nature, 455, 775
- (83)
- (84) Tacconi, L. J., Genzel, R., Neri, R., Cox, P., Cooper, M. C., Shapiro, K., Bolatto, A., Bouché, N., et al. 2010, Nature, 463, 781
- (85)
- (86) van Dokkum, P. G., Brammer, G., Fumagalli, M., Nelson, E., Franx, M., Rix, H.-W., Kriek, M., Skelton, R. E., et al. 2011, ArXiv e-prints
- (87)
- (88) van Dokkum, P. G., Franx, M., Kriek, M., Holden, B., Illingworth, G. D., Magee, D., Bouwens, R., Marchesini, D., et al. 2008, ApJ, 677, L5
- (89)
- (90) Williams, R. J., Quadri, R. F., Franx, M., van Dokkum, P., Toft, S., Kriek, M., & Labbé, I. 2010, ApJ, 713, 738
- (91)
- (92) Wisnioski, E., Glazebrook, K., Blake, C., Wyder, T., Martin, C., Poole, G. B., Sharp, R., Couch, W., et al. 2011, Monthly Notices of the Royal Astronomical Society, 417, 2601
- (93)
- (94) Wright, S. A., Larkin, J. E., Law, D. R., Steidel, C. C., Shapley, A. E., & Erb, D. K. 2009, The Astrophysical Journal, 699, 421
- (95)
- (96) Wuyts, S., Förster Schreiber, N. M., van der Wel, A., Magnelli, B., Guo, Y., Genzel, R., Lutz, D., Aussel, H., et al. 2011, ApJ, 742, 96
- (97)
- (98) Yuan, T.-T., Kewley, L. J., Swinbank, A. M., Richard, J., & Livermore, R. C. 2011, ApJ, 732, L14
- (99)
- (100) Zheng, X. Z., Bell, E. F., Papovich, C., Wolf, C., Meisenheimer, K., Rix, H.-W., Rieke, G. H., & Somerville, R. 2007, ApJ, 661, L41
- (101)