QPO in RE J1034+396: model constraints from observed trends
Abstract
We analyze the time variability of the X-ray emission of RE J1034+396, an active galactic nucleus with the first firm detection of a quasi-periodic oscillations (QPO). Based on the results of a wavelet analysis, we find a drift in the QPO central frequency. The change in the QPO frequency correlates with the change in the X-ray flux with a short time delay. Linear structures such as shocks, spiral waves, or very distant flares seem to be a favored explanation for this particular QPO event.
1 Introduction
The QPO appearance has been reported to occur in a bright Seyfert 1 galaxy, RE J1034+396 (Gierlinski et al. 2008) and BL Lacertae object PKS 2155-304 (Lachowicz et al. 2009). So far the QPO origin has not been well understood. The wavelet analysis can be particularly useful in the exploration of the QPO properties. Similar to Fourier spectra methods, the wavelet analysis provides fast linear operations on data vectors. Unlike the Fourier transform, the base functions of wavelets are localized, and this brings new opportunities to the data analysis. Based on the wavelet results we discuss possible constraints on the physical origin of the QPO in RE J1034+396.
2 Wavelet analysis of RE J1034+396 light curve
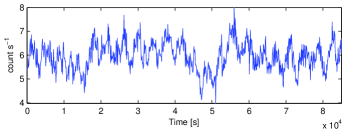
The source RE J1034+396 was observed by XMM-Newton satellite on 2007 May 31, and the resulting X-ray light curve analysis was reported in G08. Using the same procedure, we extract the source light curve in the 0.3-10 keV energy band, which covers s of continuous observations sampled evenly every s (see Figure 2). We use the wavelet analysis codes of Torrence & Compo (1998) to analyse the source behaviour.
The wavelet transform can be compared with the Fourier transform, which is used routinely to represent a measured light curve as a superposition of sine and cosine components. Both transforms can be classified into discrete versus continuous forms. In certain situations, wavelets can provide a more suitable representation of the signal by allowing a balanced resolution between time and frequency domains. Furthermore, the discrete wavelet transform can be less computationally expensive, as it requires time steps compared to steps for the corresponding resolution in fast Fourier transform.
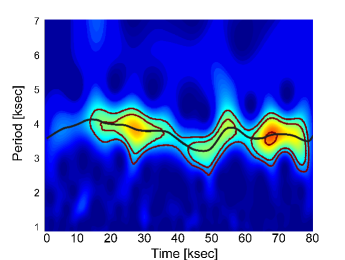
The wavelet map confirms the presence of the QPO in the source at the period s through a range of peaks. In order to assign the confidence levels to those peaks we have performed Monte Carlo simulations (Czerny et al. 2010). We created 7500 simulated lightcurves and the corresponding wavelet maps. Then we built the statistics for each of the scales in the discussed range. This allowed us to assign significance levels for each wavelet scale independently, which is important in the lightcurves with underlying red noise background. The average wavelet values rise toward longer periods, as does the power density spectrum, and this drift causes the observed misalignment between the colors on the map (referring to absolute values) and confidence levels in Figure 2. In order to find whether any additional periodicity is present in the system, we analyzed a temporal variability of the QPO period. The periodogram analysis indicates a time-scale of ks but the formal significance of the periodicity is low because of the high red-noise level.
3 Flux versus QPO period trend
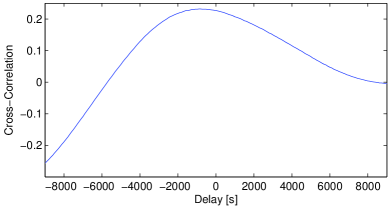
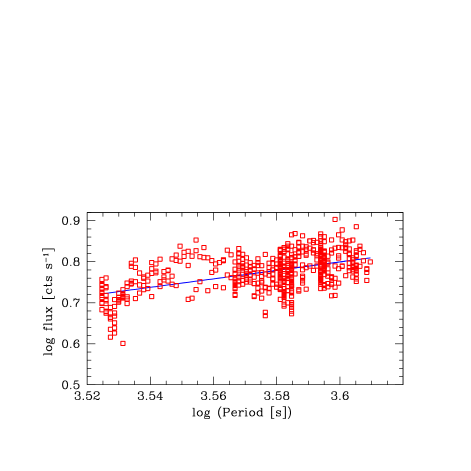
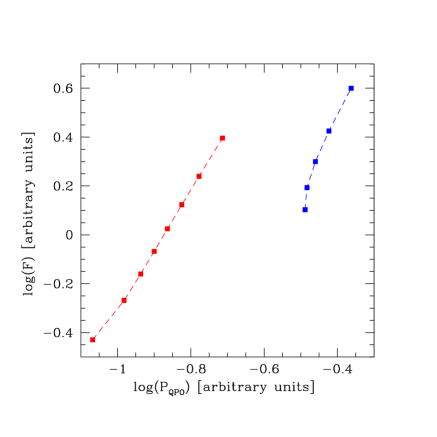
The wavelet map shows a strong decrease in the marked QPO period at the time about s, which is accompanied by a decrease in the X-ray flux. This motivated us to check for the overall correlation between the flux and the QPO period in the data. The correlation is present, and the time delay between the curves is 900 s, with the flux lagging behind the frequency change. The delay is by a factor 4.1 shorter than the QPO period itself. If only the second part of the data is investigated (Segment 2 in notation of G08), the measured delay is somewhat longer, 1400 s. The cross-correlation function between the X-ray luminosity and the QPO period for Segment 2 is shown in Figure 4, and the corresponding Flux-Period relation is given in Figure 4. It suggests that some underlying mechanism must be responsible for observed modulation of the QPO amplitude, the frequency and the flux.
Since the QPO of a 3733 s period smears the correlation at the longer time-scales, we extract the short-time trend from the light curve by applying the moving average approach, with a 5000 s window function. In consequence, we obtain a smoothed curve, free from temporal high-frequency flux variability. The scatter is the lower, as expected, but the overall trend is the same (see Czerny et al. 2010). Because the amplitude of the wavelet map also varies considerably, we tested for other possible correlations as well. The weak correlation between the wavelet amplitude and the QPO period was present but it was less significant than the correlation of X-ray flux vs. QPO period.
4 Shock oscillation scenario
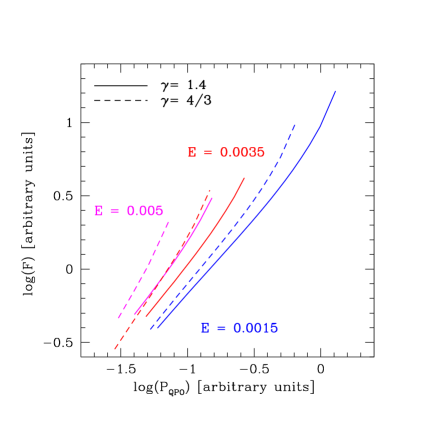
We now study in detail one specific scenario of the QPO formation. In this model, QPO oscillations are due to the oscillations of the shock formed in the low angular momentum hot accretion flow, and the variation of the shock location corresponds to the observed changes in the QPO period and the X-ray flux. We calculate the shock location as a function of parameters for a stationary flow in the Kerr black hole metric. We calculate the QPO frequency from the Keplerian frequency at the shock location and the compression term, since the oscillations are not strictly dynamical, as shown by Molteni (1996). The X-ray flux attributed to the shock is estimated from the thermal energy flux across the shock. Next, we consider the variations of the flow parameters in quasi-stationary approach and study the relation between the flux and the period when either angular momentum of the matter or the Bernoulli constant vary. The examples of the Flux-Period coupling are shown in Figures 6 and 6.
We obtain that a change in the shock location caused by perturbation of the flow angular momentum is compatible with the trends observed in RE J1034+396, whereas the perturbation of the specific flow energy results in too strong flux response to the change of the oscillation period. Finally, we examined whether the results depend significantly on the spin of the black hole. However, since the shock forms not very close to the black hole, the effect is not strong. The slope of the Flux-Period relation is practically unchanged, the shock frequency itself varies with the Kerr parameter but this information cannot be used to determine the spin unless the black hole mass is known.
5 Discussion and Conclusions
Our analysis of the X-ray light curve of RE J1034+396 through the wavelet technique suggests the dependence of the QPO peak position in a single event on time, and the change of the QPO period correlates with the X-ray flux. This correlation implies a common source of perturbation. If the result indicating the proportionality between the flux and the QPO period is a more general property, then it implies strong constraints on the QPO mechanism. In particular, it appears to contradict the explanation in terms of an orbiting hot spot model and it supports the linear structures with intrinsic timescales like shocks, or spiral waves.
In Galactic sources, single QPO high-frequency events are currently unresolved, therefore this newly found correlation cannot be tested. However, future X-ray observations should bring more light curves of AGN with a quality good enough to perform a similar analysis, even if the QPO duty cycle is relatively low (Middleton et al. 2011).
There are also other approaches than the wavelet analysis which allow for a deeper insight into the QPO phenomenon. Zoghbi & Fabian (2011) examined time-lags of the signal arriving at different X-ray energy bands. In this way they reveal different reverberation properties of the source during the period when the QPO appeared and when it was not present. Middleton et al. (2011) studied the covariance spectra and identified the soft component accompanying the QPO hotter than the soft X-ray excess seen in the average spectra. Both results imply that QPO signal is modulated at a distance of a few to few tenth of gravitational radii from the black hole.
This work has been supported in part by NN203 380136 grant in Poland, the XIth plan at HRI in India, and PECS 98040 in Czech Republic.
References
- [1] Czerny B., Lachowicz P., Dovčiak M., Karas V., Pecháček T., Das Tapas K. 2010, A&A, 524, A26
- [2] Das Tapas K., Czerny B. 2011, MNRAS, 414, 627
- [3] Gierlinski M., Middleton M., Ward M., Done C. 2008, Nature, 455, 369
- [4] Lachowicz P., Gupta A. C., Gaur H., Wiita P. J.2009, A&A, 506, L17
- [5] Middleton, M., Uttley, P., Done, C., 2011, MNRAS, 417, 250
- [6] Molteni D., Sponholz, H., Chakrabarti, S.K., 1996, ApJ, 457, 805
- [7] Torrence C., Compo G. P. 1998, Bulletin of the American Meteorological Society, 79, 61
- [8] Zoghbi A., Fabian A.C. 2011, MNRAS, 418, 2642