Neurogenesis Drives Stimulus Decorrelation in a Model of the Olfactory Bulb
Siu-Fai Chow1, Stuart D. Wick3, Hermann Riecke1,2,∗
1 Engineering Sciences and Applied Mathematics, Northwestern University, Evanston, IL 60208, USA
2 Northwestern Institute on Complex Systems, Northwestern University, Evanston, IL 60208, USA
3 Department of Physics, North Central College, Naperville, IL 60540, USA
E-mail: Corresponding h-riecke@northwestern.edu
Abstract
The reshaping and decorrelation of similar activity patterns by neuronal networks can enhance their discriminability, storage, and retrieval. How can such networks learn to decorrelate new complex patterns, as they arise in the olfactory system? Using a computational network model for the dominant neural populations of the olfactory bulb we show that fundamental aspects of the adult neurogenesis observed in the olfactory bulb – the persistent addition of new inhibitory granule cells to the network, their activity-dependent survival, and the reciprocal character of their synapses with the principal mitral cells – are sufficient to restructure the network and to alter its encoding of odor stimuli adaptively so as to reduce the correlations between the bulbar representations of similar stimuli. The decorrelation is quite robust with respect to various types of perturbations of the reciprocity. The model parsimoniously captures the experimentally observed role of neurogenesis in perceptual learning and the enhanced response of young granule cells to novel stimuli. Moreover, it makes specific predictions for the type of odor enrichment that should be effective in enhancing the ability of animals to discriminate similar odor mixtures.
Author Summary
The olfactory bulb is one of only two brain regions in which new neurons are added persistently in substantial numbers even in adult animals. This leads to an ongoing turnover of interneurons, in particular of the inhibitory granule cells, which constitute the largest cell population of the olfactory bulb. The function of this adult neurogenesis in olfactory processing is only poorly understood. Experiments show that it contributes to perceptual learning. We present a basic computational model that is built on fundamental aspects of the granule cells and their connections with the excitatory mitral cells, which convey the olfactory information to higher brain areas. We show that neurogenesis can reshape the network connectivity in response to olfactory input so as to reduce the correlations between the bulbar representations of even highly similar stimuli. The neurogenetic adaptation of the stimulus representations provides a natural explanation of the perceptual learning and the different response of young and old granule cells to novel odors that have been observed in experiments. The model makes experimentally testable predictions for training protocols that enhance the discriminability of odor mixtures.
Introduction
Contrast enhancement and decorrelation are common steps in information processing. They can reshape neuronal activity patterns so as to enhance down-stream processing like pattern discrimination, storage, and retrieval. The activity patterns can be complex and new patterns may become relevant due to changes in the environment or in the life circumstances of the animal. How can networks adapt to such demands, as they arise, for instance, in the olfactory system? What are neural substrates that would allow the necessary network restructuring?
In the olfactory system initial sensory processing is performed in the olfactory bulb. Its inputs consist of activation patterns of its 100-1,000 glomeruli, each of which can be considered as an individual input channel representing a specific olfactory receptive field. The bulbar network reshapes the patterns representing odor stimuli and typically reduces the correlation between output patterns representing similar odors as compared to the respective input patterns [1, 2, 3]. It does so despite the fact that even simple odors evoke complex activation patterns due to the fractured representation of the high-dimensional odor space on the two-dimensional glomerular surface [4]. Unlike spatial contrast enhancement in the retina [5], this decorrelation can therefore not arise from local lateral inhibition that is confined to neighboring glomeruli [6, 3]. What types of network connectivities can then underlie the enhancement of small, but significant differences in the representation of similar odors?
Previously, a number of different decorrelation mechanisms have been proposed, each of which exploiting a different aspect of the nonlinear dynamics of the bulbar network. The network connectivities were taken to be fixed, either without any lateral inhibition [4], with all-to-all inhibition [7], or with sparse random connections across large portions of the bulb [3]. These networks were shown to reduce quite effectively the correlation between the representations of moderately similar stimuli.
A different perspective is suggested by two distinctive features of the olfactory system: i) many odors do not have an intrinsic meaning to the animal and their significance is likely to be learned by experience [8, 9, 10]; ii) the bulbar network structure is not static but undergoes persistent turn-over due to neurogenesis and apoptosis even in adult animals [11, 12].
So far, the specific role of adult neurogenesis for olfactory processing is only poorly understood [13, 14]. It is known that environmental changes like sensory deprivation [15, 16, 17, 18] and odor enrichment [19, 20, 21], associative learning [22, 23, 24, 25], and life circumstances like mating [26] and pregnancy [27] affect anatomical and functional aspects of the olfactory bulb. Moreover, genetic [28, 29], pharmacological [30, 31, 32], and radiational manipulations [33, 34] have identified the significance of neurogenesis in these modifications.
Here we ask whether the neuronal turnover associated with adult neurogenesis can provide a neural substrate for the adaptation of the network to the decorrelation of different relevant stimuli that may be highly similar. Such a contribution of neurogenesis to pattern separation has been proposed for the olfactory bulb as well as the dentate gyrus [35]. We use a minimal computational network model of neurogenesis in the olfactory bulb that incorporates the persistent addition of new inhibitory interneurons (granule cells) into the olfactory bulb [36], their connection with the principal mitral cells via reciprocal synapses through which the mitral cells excite the granule cells and the granule cells inhibit the mitral cells [37], and the activity-dependent apoptosis of the granule cells [15, 38, 39, 40, 32, 41]. Using stimulus ensembles based on glomerular excitation patterns observed in rat [42] we find that the networks learn to decorrelate even very similar stimuli. This results largely from the surviving granule cells detecting strongly co-active mitral cells and providing lateral inhibition between them. Our modeling gives a natural interpretation of recent experiments on the role of neurogenesis in the perceptual learning of a non-associative odor discrimination task [40] and the detection of novel odors [20]. Our computational model predicts that learning to decorrelate highly similar mixtures comprised of dissimilar components requires the exposure to a mixture of the components rather than the individual components themselves. This can be tested in behavioral experiments using suitable enrichment protocols [43, 44, 45, 40].
Results
Activity-Dependence of Survival Drives Decorrelation
In our computational model we consider the recurrent network formed by principal mitral cells and inhibitory granule cells. We focus on the adaptive restructuring of the network connectivity in response to a stimulus ensemble and model the individual neurons in a minimal fashion using linear firing-rate dynamics (cf. METHODS, Discrete Adaptive Network Model). Focusing on the evolution of the network structure we ignore transients in the evolution of the neuronal activities and consider only their steady states in response to any given odor stimulus. The network is persistently rewired by adding in each time step of the network evolution randomly connected new granule cells and removing granule cells that are not sufficiently active during the steady state reached in response to odor stimulation (Fig.1). Specifically, the survival probability of a granule cell depends in a sigmoidal fashion on its ‘resilience’ , which we introduce as its thresholded activity summed over the stimulus ensemble.
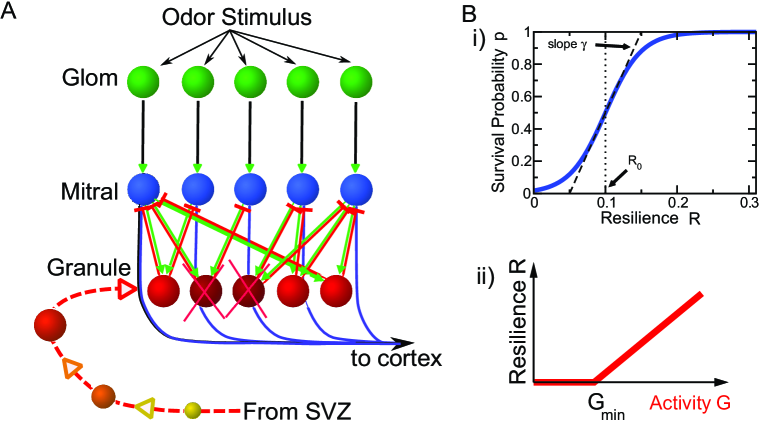
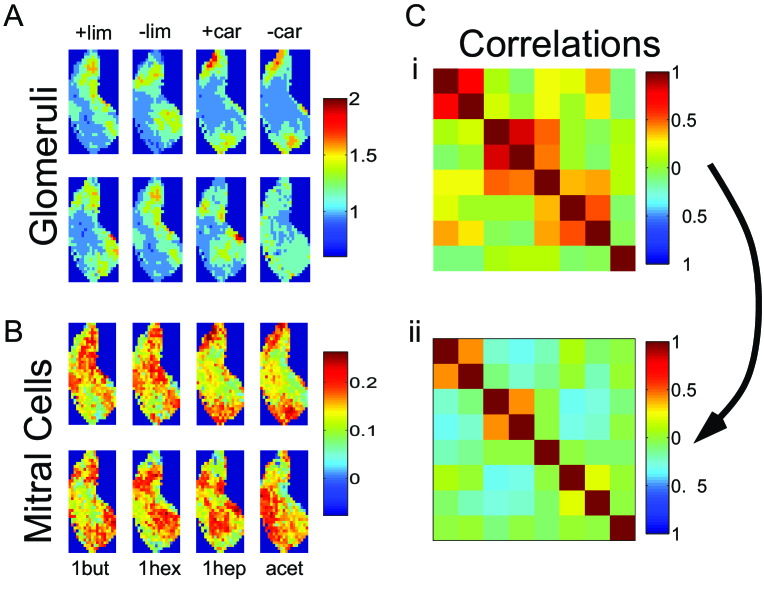
In most of the computations we use input patterns that are based on a set of experimentally obtained glomerular activity patterns in rat [42] corresponding to the odorants -limonene, -carvone, 1-butanol, 1-hexanol, 1-heptanol, and acetic acid (Fig.2A). They drive 424 mitral cells, which in turn excite about 10,000 granule cells. Due to the reciprocal character of these synapses each granule cell provides self-inhibition to each of the eight mitral cells that drive it as well as lateral inhibition between them (Fig.1A). All synaptic strengths are taken to be fixed. Unless noted otherwise, all excitatory and all inhibitory synapses have equal strengths, respectively.
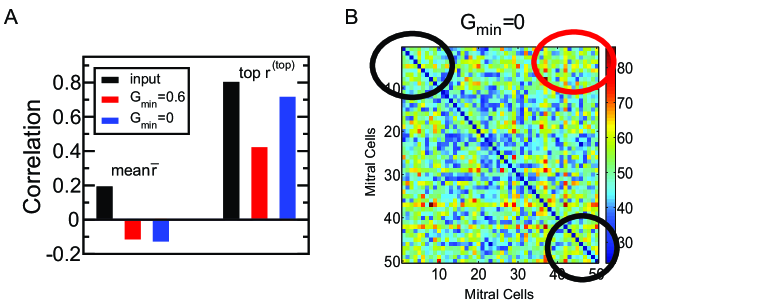
The network that eventually emerges as a statistically steady state from the persistent rewiring substantially reshapes the representation of the stimuli (Fig.2B). In particular, the mitral cell activation patterns, which represent the output of the olfactory bulb, differ from each other significantly more than the glomerular input patterns. To quantify this reduction in similarity we use the Pearson correlation of the patterns associated with stimuli and (cf. Eq.(10)), as has been done in previous, experimental studies [1, 2, 3]. Thus, the network achieves a substantial decorrelation of the stimulus representations (Fig.2Ci,ii). This is the case for the highly similar -limonene- and -carvone-pairs as well as the less correlated, remaining stimuli of the odor ensemble. Moreover, through the enhanced inhibition of mitral cells that are strongly driven in this stimulus ensemble and the spontaneous activity of mitral cells that receive very little or no input [46, 3] the network reshapes the quite focal input patterns into output patterns in which the activity is more broadly distributed over the whole network (Fig.2B). Such a reduction of the focality of the output patterns has been observed for mitral cell activity in zebrafish [3]. Particularly for stimuli that predominantly overlap in these focal areas such a reshaping of the pattern can reduce the correlation significantly.
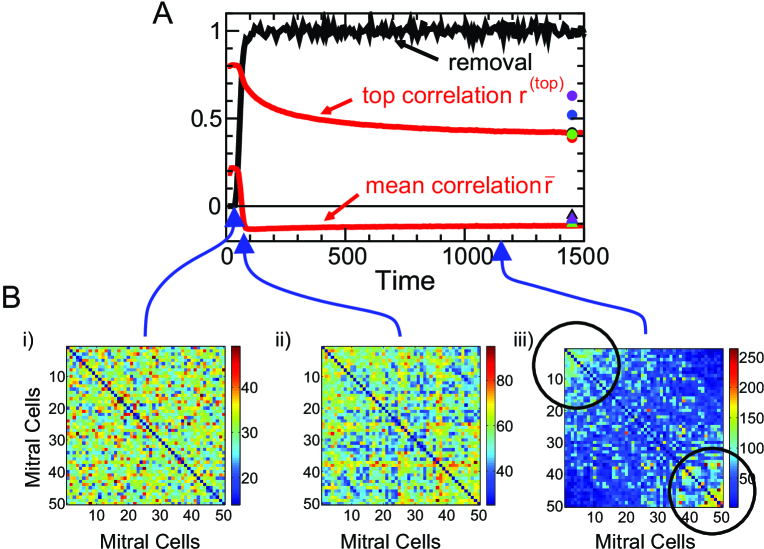
Insight into the mechanisms underlying the decorrelation by the network is gained by following the evolution of the connectivity and the associated decorrelation performance as the network builds up from a network without any granule cells (Fig.3). The early stages of this evolution are not meant to mimic the peri-natal development of the bulb, which is controlled by mechanisms other than those included in this model. To visualize the network connectivities the stimuli are down-sampled to 50 channels (cf. METHODS, Natural Stimuli) and the two-dimensional activation patterns are re-arranged into one-dimensional vectors in which the mitral cells that are strongly activated during the -limonene presentation are located at the beginning of the vector and those that dominate during the -carvone presentation at the end. Because the overlap between the activation patterns of these two pairs of enantiomers is small there are only few mitral cells that receive significant input for both types of stimuli. They end up towards the middle of the activity vector. For visual clarity the diagonal elements of the connectivity matrices are divided by 10.
During the initial phase the granule cell population is small and provides only little inhibition to the mitral cells. Their activities and with them the activities of the granule cells are therefore high and none of the granule cells are removed (Fig.3A). Since the granule cells establish random connections with the mitral cells the resulting effective connectivity between the mitral cells is essentially random (Fig.3Bi) and the activity patterns are only reduced in amplitude without any qualitative changes; the correlations remain high. As the mitral cell activities decrease, some granule cells fall in their activity and resilience below the soft survival threshold (cf. Fig.1Bi) and their survival probability drops drastically (. This apoptosis is selective, resulting in a structured connectivity, in which more highly active mitral cells receive stronger inhibition (Fig.3Bii), and a reduction of the mean pattern correlation. The correlation between the highly similar stimuli is, however, still high. In the third phase of the network evolution the size of the granule cell population remains constant, but the connectivity evolves slowly towards establishing strong effective mutual inhibition between mitral cells that are highly co-active during -limonene or -carvone presentations (marked by circles in Fig.3Biii). In parallel, the correlation of these highly similar enantiomers is strongly reduced.
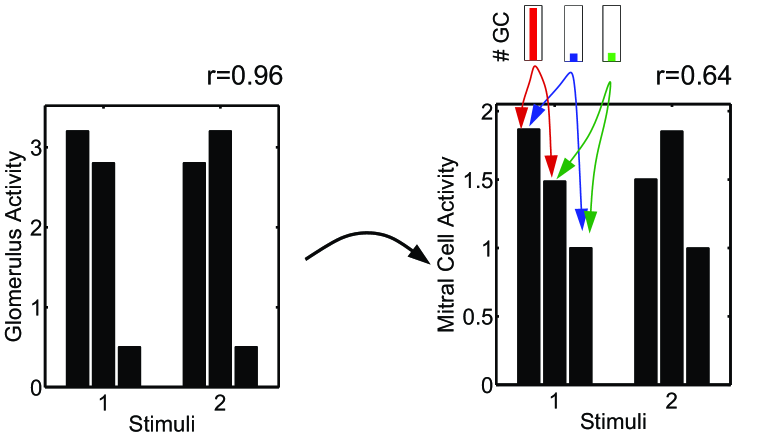
The effectiveness of the inhibition of highly co-active mitral cells in decorrelating activity patterns is illustrated using a very simple example with stimuli exciting only three mitral cells (the relevant two stimuli are shown in Fig.4). Like the highly similar olfactory stimuli in Fig.2, these stimuli overlap in strongly co-active glomeruli. This allows the population of granule cells that connect to the mitral cells driven by these glomeruli to be much larger than the other two populations. The reciprocity of the synapses implies that these mitral cells receive substantially stronger inhibition than the other mitral cell. The resulting reduction in amplitude reduces also the correlation between the two mitral cell activity patterns. In Fig.3Biii the corresponding enhanced connectivity between mitral cells that are highly co-active during -limonene (or -carvone) stimulation is marked by black circles.
Threshold Promotes Lateral Inhibition Based on Co-Activity
What determines the performance of the networks arising from the persistent turn-over? The granule-cell survival is controlled by two thresholds: i) for each stimulus for which the granule cell activity surpasses the resilience threshold its resilience increases (cf. Eq.(8)) and ii) the resilience accumulated across all stimuli of the ensemble has to be above the soft survival threshold in order for the granule cell to have a significant survival probability (cf. Eq.(9)). The survival threshold controls in particular the total number of granule cells and with it the overall level of inhibition. In general, the overall correlation of the outputs decreases with increasing inhibition (data not shown) at the expense of the output amplitudes. In our comparisons we adjust therefore to keep the mean output amplitudes fixed.
A more subtle and interesting role is played by the resilience threshold . For the network achieves an overall decorrelation that is quite comparable to that of the network of Fig.2 with ; the highly similar stimuli -limonene and -carvone, however, are only very poorly decorrelated (Fig.5A). The origin of this poor performance is apparent in the effective connectivity obtained with (Fig.5B). A comparison with the connectivity arising for (Fig.3) reveals that the connections among the mitral cells that are co-active in response to -limonene (or -carvone) stimulation (black circles) are not stronger than among mitral cells that are not co-active (red circle). As had been observed in Fig.3, it is the connections among co-active mitral cells, however, that are essential for decorrelating these stimulus representations.
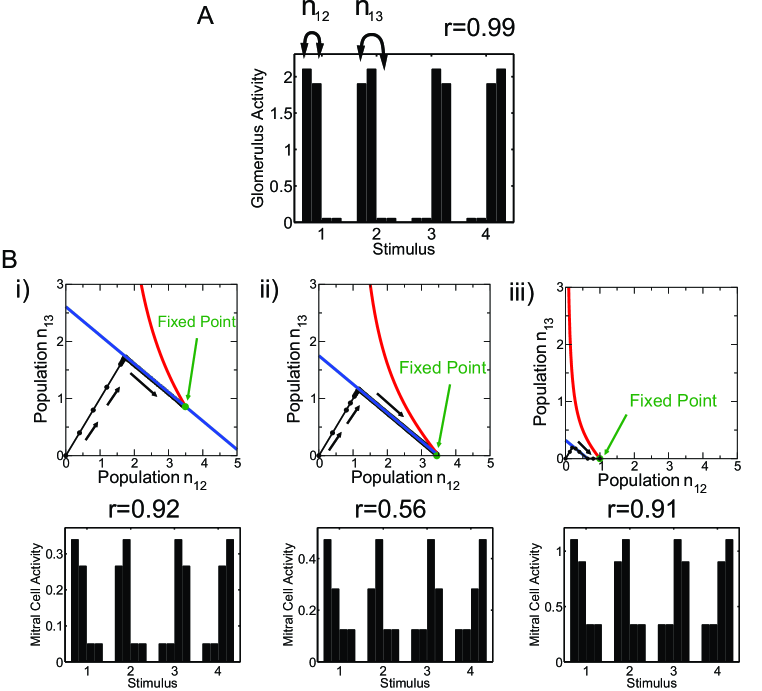
How does the threshold provide a co-activity detector? Why do the connections among mitral cells that are not co-active interfere with the decorrelation? The function of the threshold can be illustrated with a minimal set of two pairs of strongly correlated stimuli activating four glomeruli, and with (Fig.6A). Stimuli and may be viewed as caricatures of the limonene and carvone enantiomers, respectively. The granule cells in population inhibit the mitral cells that are co-active in stimuli (cf. Fig.6A) and are therefore needed for decorrelation. The granule cells in population , however, are connected to mitral cells that are not co-active in any of the stimuli; they may interfere with the performance of the network. The resilience of the granule cells in population is comprised of two large contributions due to the strong inputs in stimuli and and two small contributions from stimuli and , while the resilience of the cells in population is determined by 4 intermediate contributions. In our model (3,4) for the neuronal dynamics the granule cell activities are linear in the mitral cell activities. For the activity of the interfering population is almost the same for all four stimuli and is close to the average of the activity across the four stimuli. As a result, the rectifier, which makes the resilience function (8) concave, renders the granule cells that establish interfering connections less resilient than the granule cells connecting co-active mitral cells, . This suppresses the interfering population relative to , as is apparent in a comparison of Fig.3Biii and Fig.5B.
Within the framework of the population formulation eqs.(15,16,17) the simplicity of the minimal stimulus set of Fig.6A allows a detailed analysis of the role of the threshold in the balance between the suppression of interfering connections and a reduction of the beneficial inhibition of co-active mitral cells. Due to the symmetry of the stimulus ensemble only two granule-cell populations have to be analyzed, and . Their dynamics can be understood using a phase-plane analysis. For steep survival curves the nullclines of , which are defined by , are very well approximated by (cf. Fig.1Bi). Starting from , both population sizes increase linearly in time until they reach one of the two nullclines. Then the system follows slowly that nullcline until a fixed point is reached. This can be the intersection of the two nullclines (Fig.6Bi). In addition, since cannot become negative, an intersection of the nullcline with the axis also represents a fixed point if at that point (Fig.6Biii) and similarly with the roles of and interchanged.
A straightforward expansion shows that for highly similar stimuli, , the correlation between the two output patterns is given by
| (1) |
Thus, as expected, the correlation decreases with increasing reciprocal inhibition of co-active mitral cells and increases with increasing strength of the interfering connections . As discussed above, the relation between these two populations can be controlled using the threshold . For fixed resilience threshold the correlation is minimized for (cf. Eqs.(23,22))
| (2) |
This is the smallest value of for which the interfering connections vanish, . Thus, it maximizes the inhibition between co-active mitral cells without inducing interference. This leads to optimal decorrelation, as is also apparent in the output activity patterns in the bottom panels of Fig.6B.
Thus, the threshold in the resilience suppresses interfering connections between mitral cells that are not co-active and promotes a connectivity that is based on co-activity. To provide a context of the performance of this co-activity based connectivity we compare the decorrelation achieved by the resulting networks with that obtained by a number of other types of adaptive networks. In some of them the inhibition is also based on co-activity, in others on distance, correlation, or covariance (see Text S1 with Figs.S1,S2,S3 therein). We find that the networks whose adaptation mechanism is based on some form of co-activity of mitral cells or glomeruli are able to decorrelate representations of highly similar stimuli and achieve a reduction of the overall correlations without and with significant spontaneous mitral cell activity. Among these networks are networks motivated by an earlier model for neurogenesis [47] as well as networks that aim to orthogonalize the stimulus representations by orthogonalizing (and normalizing) the activity vectors of pairs of mitral cells [48]. Alternatively, the connectivities can also be based on the correlations or covariances of the inputs. For instance, a correlation-based connectivity was found to capture the outputs of the bee antennal lobe, which is the insect homolog of the olfactory bulb, better than random or local connectivities [49]. We find that correlation- and covariance-based recurrent networks do not decorrelate stimulus representations very well. In various situations they even tend to increase rather than decrease the correlations. This reflects, in part, the fact that they are not sensitive to the spontaneous activity of the mitral cells.
Imperfect Reciprocity of Synapses is Sufficient
Anatomically, the dendrodendritic synapses between mitral cells and granule cells are found to be predominantly reciprocal, i.e. each granule cell has inhibitory connections only to those mitral cells from which it receives excitatory connections [37]. In combination with the threshold this establishes effectively inhibitory lateral connections selectively between highly co-active mitral cells and allows the networks to decorrelate their highly correlated inputs.
As implemented in our model so far, the reciprocal synapses not only provide an anatomical connection between co-active mitral cells but due to the homogeneity of the inhibitory synaptic weights they also induce a symmetric connectivity matrix and the amount of self-inhibition that a given mitral cell experiences is directly related to the amount of lateral inhibition it provides to other mitral cells. What roles do these different aspects play in the decorrelation?
To test the importance of the correct anatomical connections we redirect a fraction of the inhibitory connections of each granule cell to randomly chosen mitral cells instead of the mitral cells that drive that granule cell. As expected, as the fraction of such non-reciprocal synapses increases the correlations increase as well. Without any reciprocal synapses the network does not decorrelate the stimuli at all (Fig.7). The network performance is, however, quite robust: the overall decorrelation deteriorates noticeably only when more than 50% of the connections have been rewired. The highly correlated stimuli are, however, more sensitive to the rewiring with increasing from to when 50% of the connections are rewired, while changes only from to .
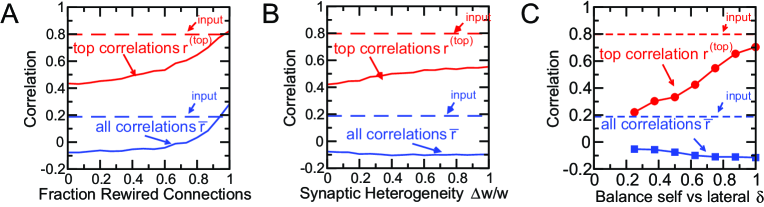
The granule cells deliver their inhibitory inputs onto the secondary dendrites of the mitral cells at highly variable distances from the mitral cell somata. Their effect on the mitral cell firing will therefore vary over quite some range; in fact, some synaptic contacts will be too far away from the mitral cell soma to have any noticeably effect on that mitral cell’s firing. To assess the impact of such heterogeneities we modify the inhibitory synaptic weights, which so far had the same value for all synapses, by picking them with equal probability from the two values . This breaks the symmetry of the inhibition and for half of the inhibitory connections are completely ineffective. The overall decorrelation is, however, not affected by this heterogeneity and even the decorrelation of the highly similar stimuli deteriorates only slightly over the whole possible range (Fig.7B). Essentially the same result is obtained if the synaptic strengths are distributed uniformly in the interval . While for very large granule cell populations the heterogeneities of different granule cells are expected to average out each other, for the parameters used in our study the effective connectivity matrix is still noticeably asymmetric: its anti-symmetric component amounts to about 20% of the symmetric one.
Through the reciprocal character of the dendrodendritic synapse a granule cell mediates lateral inhibition between the mitral cells that drive it as well as self-inhibition of each of them. Due to the complex dendritic dynamics of granule cells [50, 51] these two types of inhibition can be of different strength. In fact, recent observations suggest that self-inhibition is significantly weaker than lateral inhibition [52]. While our minimal model does not capture any explicit dendritic processing, the strength of self-inhibition and lateral inhibition that a mitral cell receives is given by the diagonal and off-diagonal coefficients of the effective connectivity matrix , respectively. We can therefore change the balance between self-inhibition and lateral inhibition phenomenologically by rescaling the diagonal terms, with , at the expense of the off-diagonal terms, for , while keeping the row-sum of the matrix fixed through the normalizing factor . Reducing self-inhibition in this fashion () enhances the decorrelation of the representations of the natural stimuli significantly (Fig.7C), because it further enhances the competition between dominant, co-active mitral cells. Conversely, increasing the self-inhibition () reduces the competition. In the complete absence of lateral inhibition () granule cells are effectively coupled only to a single mitral cell. This provides still good overall decorrelation, but the representations of the highly similar odors are only poorly decorrelated. Thus, the experimentally observed reduction of self-inhibition may contribute to an improved decorrelation performance of the bulbar network.
These comparisons show that for effective decorrelation the most important aspect of the reciprocity of the dendrodendritic synapse is that it provides mutual anatomical connections between the relevant mitral cells, i.e. between those that are co-active for some stimuli. The effective synaptic strengths can be quite heterogeneous without compromising the performance of the network. In fact, reduced self-inhibition can enhance the decorrelation substantially.
Young Granule Cells Respond to Novel Odors
One possible role of neurogenesis is to provide a persistent supply of new neurons, which may play a different role than old, mature neurons. An aspect of this type has been identified in experiments focusing on the responsiveness of young and old adult-born granule cells [20, 53]. In the experiments, adult-born precursor cells, which develop into granule cells, were marked in the subventricular zone. After they have migrated to the olfactory bulb and have integrated into the bulbar network their response to odor stimulation was measured using the expression levels of various immediate early genes. It was found that the fraction of adult-born granule cells that respond to novel odors is significantly higher shortly after their arrival in the olfactory bulb than a few weeks later. It has been argued therefore that one important function of the young granule cells may be to serve as novelty detectors [20].
In our computational model a differential response of young and older adult-born granule cells to novel odors arises quite naturally. After establishing a network by exposing the system to the stimulus ensemble , , we mark granule cells as they are integrated into the network and measure their response to various stimuli as a function of their age. Assuming that the granule cell activity has to surpass a minimal value to activate the expression of the immediate early genes, we consider granule cells as responding if they reach an activity above a threshold . As the network evolves the less active granule cells die and are removed from the network (Fig.8Ai). As in the experiments, we find that the fraction of young adult-born granule cells that respond to a novel stimulus, i.e. a stimulus that is quite different from the stimuli in the background ensemble, decreases as the granule cells become older (Fig.8Aii). This decrease results from the reduced survival probability of these cells, which is due to the weak drive they receive by the stimuli in the stimulus ensemble that determines granule-cell survival. In contrast, the fraction of granule cells that respond to a familiar stimulus, i.e. a stimulus in the background ensemble, decays very little or even increases over the same time frame, reflecting their higher survival rate.
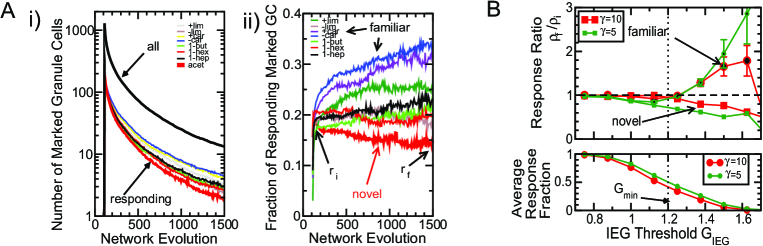
For what range of the threshold does our model yield results that agree qualitatively with the experiments in [20]? When the threshold is increased beyond the resilience threshold ever fewer marked granule cells respond and the fraction of marked granule cells that respond to the stimuli - averaged over all stimuli - drops from 1 to 0 (Fig.8B bottom panel). Thus, the experimentally obtained response fractions of 10-20% [20] set an upper limit for relative to . At the same time, decreasing reduces the difference between the temporal evolution of the response to novel and to familiar stimuli. We characterize the evolution by the ratio between the fraction of granule cells responding to the stimulus at the final time of the simulation and the fraction immediately after the end of the marking period. On average this ratio increases with increasing for the familiar stimuli, but it decreases for the novel stimulus (Fig.8B top panel). For the response to novel odors to differ significantly from that to familiar odors cannot be much smaller than . It is worth noting that varying the steepness of the survival curve does not affect the decorrelation of the odor stimuli substantially (symbols at in the top panel of Fig.3), but the difference in the response to novel compared to familiar odors is significant only if the survival curve is not too steep (Fig.8B top panel).
Thus, the activity-dependent survival of the granule cells combined with their random connections to the mitral cells is sufficient to capture the experimentally observed enhanced response of young adult-born cells to novel stimuli if the threshold for the activation of the immediate early genes is close to the resilience threshold , which is an essential determinant of the survival of the granule cells.
Neurogenesis Contributes to Perceptual Learning
In a wide range of experiments possible connections between adult neurogenesis and animal performance have been investigated employing various tests of odor detection, odor discrimination, short-term and long-term memory, and fear conditioning [19, 29, 30, 31, 32, 33, 34, 43, 44, 45, 40]. No simple picture regarding the role of neurogenesis in odor discrimination and odor memory has, however, emerged so far. This may in part be due to the fact that higher brain areas are likely involved in many of the behavioral tasks; they may well compensate for some changes occurring in the olfactory bulb and therefore possibly mask certain effects of the neurogenesis.
A behavioral task that may reflect bulbar odor representations relatively directly is the spontaneous, non-associative odor discrimination based on habituation, which has been shown to result predominantly from bulbar processes [54, 55, 56]. These experiments exploit the decreasing interest an animal typically displays to repetitions of the same stimulus: the animal’s response to a second stimulus after if has habituated to a first stimulus is a measure of the degree to which the animal discriminates the two stimuli [55]. Exposing animals to extended periods during which their environment is enriched with additional odors enhances their spontaneous odor discrimination [43, 44, 45, 40]. This is indicative of perceptual learning. The dominance of bulbar processing in this task [54, 55, 56] suggests that the enrichment induces changes in the bulbar odor representations [56]. Since the enhancement is significantly suppressed if neurogenesis is halted pharmacologically [40], it is likely that the changes in the odor representations reflect a restructuring of the bulbar network. Importantly, for the enrichment to improve the performance the odors employed have to be related to the odors that are to be discriminated [43].
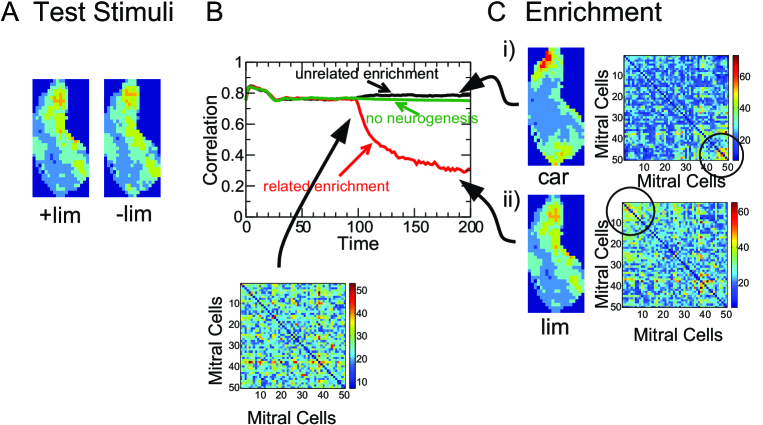
The perceptual learning observed in the experiments is captured in our minimal computational model. We use an ensemble of background stimuli, which establishes a default network connectivity, and test the performance of the network with two test stimuli (-limonene and -limonene). They are not included in the stimulus ensemble that drives the network evolution. For the default network the correlation between the representations of the test stimuli is high, consistent with the fact that naive animals do not discriminate these odors spontaneously. Then the stimulus ensemble is enriched with additional odors (). As the network adapts and evolves to a new steady state characterized by different effective connectivity matrices (Fig.9C, right panels), the correlation between the two test stimuli evolves as well. If the odors used for the enrichment have sufficient overlap with the test odors the correlation between the test odors decreases substantially (red line in Fig.9B). However, if the enrichment odors are only weakly related to the test odors the correlation of the test odors does not decrease (black line in Fig.9B). In fact, in some cases the correlation between the test odors can even increase. As expected, if the influx of new granule cells is stopped with the onset of the enrichment the odor representations and their correlations are unaffected by the enrichment, even if the enrichment odor is close to the test odor (green line).
Effective Enrichment: Overall Overlap is Not Sufficient
In experiments, odor enrichment enhances the ability of the animals to discriminate similar odors only if there is sufficient overlap between the activation patterns of the stimuli used in the enrichment and those of the stimuli to be discriminated [43]. Our network model allows more specific predictions for the type of enrichment protocols that should be effective in enhancing the ability of the animals to discriminate a given set of test odors.
We consider the decorrelation of very similar mixtures comprised of dissimilar components. Specifically, we use as components limonene (50% –limonene and 50% –limonene) and carvone (also both enantiomers in equal proportions), whose activation patterns have very little overlap (Fig.2A). We employ two different enrichment protocols. In the first one pure limonene and pure carvone are added to a background of alcohols and acetic acid in an alternating fashion (Fig.10B, top panel). Experimentally, this would correspond to presenting limonene and carvone separately at different times. In the second protocol an equal mixture of limonene and carvone is added to the background ensemble (Fig.10B, bottom panel). In both protocols the activity-dependent removal of interneurons occurs only after the complete set of background and enrichment stimuli has been presented. To implement the mixtures in the model we assume that the glomerular activation patterns for mixtures are approximated sufficiently well by a linear combination of the patterns for the individual components.
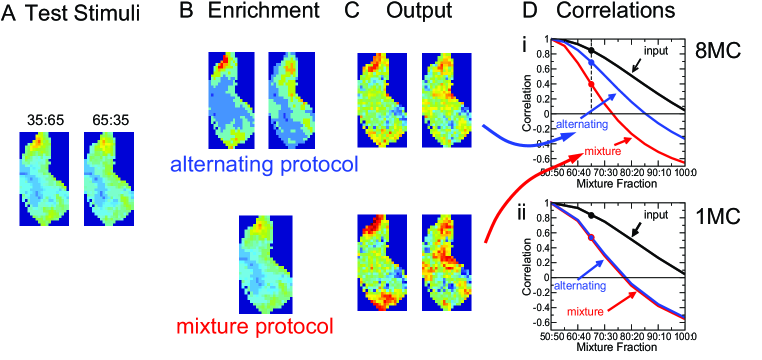
While using the pure components in the enrichment decreases the correlation between the representations of the mixtures at all mixture ratios (‘alternating’ in Fig.10Di) it does so substantially less than the network enriched with the 50:50 mixture (‘mixture’ in Fig.10Di). The stronger decorrelation obtained with the mixture protocol compared to the alternating protocol can also be recognized directly in the output patterns (Fig.10C, bottom vs. top panel). This substantial difference arises because the decorrelation of the mixtures is strongly enhanced by mutual inhibition between mitral cells that are driven by limonene as well as carvone. This inhibition is provided by ‘mixed’ granule cells. By contrast, ‘pure’ granule cells are connected to mitral cells that are activated (almost) exclusively by limonene or carvone. As discussed in Sec. Threshold Promotes Lateral Inhibition Based on Co-Activity, in the context of interference, in the alternating protocol the mixed granule cells have a lower survival probability than the pure granule cells. In the mixture protocol, however, both types of granule cells have very similar survival probabilities. To assess the inhibition provided by these populations we consider the sum of the synaptic weights in the four quadrants of the effective connectivity matrix (cf. Fig.3Biii). We find that the inhibition provided by the mixed granule cells in the mixture protocol is stronger than in the alternating protocol (see (27)). Insight into what controls these populations can be gained by considering again the simple caricature of Fig.6A. Within that framework the mixture protocol can be viewed as a stimulus set in which all four glomeruli receive essentially equal input. Both types of granule cells have then equal survival rates. Within that model it is easily seen that the size of their populations falls between that of the mixed granule cells and the pure granule cells in the alternating protocol because the total resilience of the mixed granule cells has to be the same in both protocols (see Sec. METHODS, Alternating vs Mixture Protocol). Thus, compared to the alternating protocol the mixture procotol enhances the relevant inhibition and improves the decorrelation of the limonene-carvone mixtures.
If neurogenesis were to affect only interneurons that provide non-topographic inhibition and no lateral inhibition [4] both enrichment protocols would be expected to lead to the same level of decorrelation. Specifically, if in the model each granule cell makes only connections with a single mitral cell the alternating protocol leads to the same decorrelation of the limonene-carvone mixtures as the mixture protocol (Fig.10Dii). Comparing the influence of the two enrichment protocols on the animals’ ability to discriminate such mixtures may therefore give insight into the type of neurogenesis-dependent connectivity that dominates the decorrelation mechanism.
Thus, even though in both protocols the enrichment odors - taken together - have the same overlap with the test odors the model predicts that enrichment with the mixture protocol achieves substantially better decorrelation of the test stimuli than the alternating protocol.
Discussion
To investigate the functional implications of the experimentally observed persistent turnover of inhibitory interneurons on sensory processing by the olfactory bulb we have used a minimal computational network model. The experimental observations forming the basis of our model are the reciprocity of the synapses between the interneurons (granule cells) and the principal neurons (mitral cells) [37] and the activity-dependent survival of adult-born granule cells [41]. In the model we have focused on the input from the mitral cells via the dendro-dendritic synapses as the dominant input controlling the activity and survival of the granule cells. Assuming in addition that the new cells connect to an essentially random set of mitral cells allows the model to capture parsimoniously various experimental observations and to make specific predictions.
Novelty Detection. It has been observed that young granule cells are more likely than mature ones to respond to odors that are novel for the animal [20, 53]. This has been interpreted as a mechanism for novelty detection. Our model captures the enhanced response of young cells in a natural way. Since granule cells that respond to novel odors but not to the odors in the ongoing environment receive only little ongoing input, they do not survive for a long time and the fraction of granule cells responding to the novel odor decreases with their age. Thus, the observation of an enhanced response of young granule cells to novel odors suggests that new granule cells do not have a strong bias towards connecting to highly active mitral cells but connect also to mitral cells that have only been weakly active in the past. Such a strategy enables the network to learn to process novel odors.
Experimentally, the response of the granule cells was measured in terms of the expression of various immediate early genes (c-fos, c-jun, EGR-1/zif-268). The fraction of granule cells responding to the novel odors was found to be 10-25% for young cells and lower for older cells [20, 53]. Such an intermediate response fraction is obtained in our model if the threshold for the expression of the immediate early genes is close to that for the survival of the granule cells. This is suggestive of a common step in the pathways controlling IEG-expression and cell survival.
Threshold Enhances Inhibition between Co-active Mitral Cells and Reduces Interference. The decorrelation of highly similar stimuli like the two pairs of enantiomers used in our computation hinges upon the presence of an activity threshold that the granule cells have to surpass to increase their survival probability. It enhances the connections between mitral cells that are highly active simultaneously and suppresses those between mitral cells that are strongly active albeit only in response to different stimuli.
Biophysically, a threshold for the survival of the granule cells may arise from the need to drive L-type Ca channels, which activate the MAPK pathway that leads to the stimulation of genes that are essential for neuronal survival [57, 58].
With the strengthening of inhibition between co-active mitral cells the mechanism underlying the adaptation in our model is somewhat related to that underlying other adaptive networks that have been studied previously. In an early neurogenesis model for the olfactory bulb the evolution of the effective pairwise inhibition between mitral cells was based directly on the scalar product of the mitral cell activities [47]. Adaptive networks that aim to orthogonalize the stimulus representations can do so via a connectivity that is based on the pairwise scalar products of input activities [48]. A somewhat different adaptive connectivity has been suggested in a modeling study of the bee antennal lobe. There it was found that a connectivity in which the inhibition is proportional to the correlations between the glomerular activities was able to match the observed output patterns better than random or local center-surround connectivities [49]. We have compared a few types of networks that exploit different adaptation algorithms and find that connectivities that are based on the co-activity of mitral cells or glomeruli achieve significantly better decorrelation than networks based on the correlations or covariances of the inputs. A particular problem of the latter algorithms is that they are not sensitive to mean activities of the cells and do not take the spontaneous activity of the mitral cells adequately into account.
Reciprocity of Connections. An anatomically characteristic feature of the olfactory bulb is the reciprocal nature of the dendrodendritic synapses between mitral and granule cells. The purpose of this reciprocity is not well understood. Our computational modeling shows that it can play an essential role in exploiting the activity-dependent survival of the granule cells to establish a connectivity whose lateral inhibition reflects the co-activity of the mitral cells. This provides a mechanism for the network to learn to decorrelate even highly similar stimuli.
Biologically, the reciprocity may be imperfect in a number of ways. In principle, an inhibitory synapse could connect the granule cell to a mitral cell that is not the origin of the associated excitatory synapse. Modeling such a situation by a random rewiring of a fraction of inhibitory connections we find that the network performance is reasonably robust to such perturbations. However, when more than 50% of the synapses are rewired the performance deteriorates significantly and without any reciprocity the stimulus representations are not decorrelated at all.
A second type of imperfection of the reciprocity is likely to arise if the dendrodendritic synapse is located far from the soma of the mitral cell. In such a case the inhibition exerted by the granule cell may not have much effect on the mitral cell firing, although the granule cell is driven strongly by that mitral cell. This asymmetry can arise because excitation is driven by action potentials, which can travel long distances along the dendrite, whereas the shunting provided by the inhibition is confined to a distance comparable to the electrotonic length of the dendrite [59]. Thus, the effective inhibitory strength may vary substantially between synapses depending on their location relative to the soma. Mimicking such a heterogeneity by random variations in the synaptic strength we find that the network performance is only moderately affected by such effects. Since mitral cells are connected to many granule cells the heterogeneity of the combined synaptic strengths is likely to be reduced compared to the heterogeneities within individual granule cells. Such an averaging may be reduced if correlations between the strengths of different synapses, which may arise due to correlations in the physical distances between the cells, should be significant.
The reciprocity may also be perturbed because the strength of the self-inhibition that a mitral cell experiences on account of a given granule cell may differ from that of the lateral inhibition that said granule cell provides to other mitral cells. In fact, recent experiments suggest that self-inhibition is significantly weaker than lateral inhibition [52]. One cause for this difference may be the complex physiology of granule cells, which includes local dendritic calcium signaling, dendritic calcium spikes, and action potentials driven by sodium conductances [51]. Our minimal single-compartment model for the granule cell does not allow to capture these rich dynamics. However, on a phenomenological level the balance between self-inhibition and lateral inhibition can be modified by rescaling the diagonal and off-diagonal terms in the effective connectivity matrix. Our model shows that reducing the self-inhibition while strengthening the lateral inhibition can substantially enhance the ability of the network to decorrelate the representations of highly similar stimuli.
Perceptual Learning. The decorrelation of similar stimulus representations that is obtained in our model provides a natural interpretation of recent experiments on spontaneous odor discrimination via habituation [40]. Only with neurogenesis intact does enriching an animal’s odor environment enhance its ability to discriminate similar odors. Since the habituation used in these discrimination experiments reflects predominantly changes in the olfactory bulb rather than higher brain areas [54, 55, 56], the improvement in odor discrimination resulting from odor enrichment likely reflects modifications in the encoding of the test stimuli in the olfactory bulb. Our modeling shows that fundamental features underlying the neuronal turn-over in the bulb – activity-dependent survival and reciprocal synapses – suffice to allow perceptual learning by changing the odor encoding so as to decrease their similarity and enhance their discriminability.
Repertoire of Potentially Relevant Odors. In laboratory experiments that allow many repetitions animals can learn to discriminate highly similar odor stimuli [31], which may have highly correlated representations in the olfactory bulb. Outside the laboratory the animals are likely to face the challenge to form associations with stimuli given only a few trials. This task may be very difficult if not even impossible if the relevant odors are represented in the bulb in a highly correlated fashion.
In line with experiments on odor enrichment [40], our computational model shows that neurogenesis may facilitate this task by reducing the correlation of odors in an ensemble to which the animal is exposed. These odors could represent a repertoire of potentially relevant odor types that the animal can easily discriminate, should the need arise. In our model the survival of the granule cells depends on the inputs they receive from mitral cells via their dendro-dendritic synapses. Their relevance could be determined by the context in which the animal is exposed to the odor. Such contexts are likely to affect modulatory inputs to the olfactory bulb, which can modify the excitability of granule cells [60, 61, 62] and mitral cells [60, 62] as well as mitral cell inhibition [63], all of which will affect granule cell survival [64]. Contexts could also induce specific, direct inputs from cortical areas like piriform cortex to granule cells at proximal or basal synapses, both of which are functional in young granule cells with the proximal synapses developing even before the basal and dendro-dendritic ones [65, 66].
Predictions for Effective Learning Protocols. Enrichment enhances odor discrimination only if the enrichment odors overlap in their glomerular excitation patterns with those of the test stimuli [43]. Our modeling confirms this. Moreover, it makes specific predictions with regard to the decorrelation of similar mixtures comprised of dissimilar components. If neurogenesis affects predominantly granule cells that provide lateral inhibition, our model predicts that animals will learn to discriminate such mixtures more easily if the enrichment is performed using the odor mixture rather than alternating its individual components. This difference is predicted even though both enrichment ensembles have the same overall overlap with the test stimuli. If non-topographical self-inhibition [4] should dominate neurogenetic restructuring, no difference between the protocols is expected.
The change of odor representations that our neurogenesis model predicts to arise from odor enrichment might also be testable in reward-associated discrimination tasks by focusing on the initial learning stages. Suitable enrichment protocols are expected to enhance the differences in the encoding of the test odors. Applied before the animals learn the odors that are to be discriminated, such enrichment should lead to a shortening of the initial learning phase if the odors are very similar. Moreover, it has been found that animals tend to follow different strategies during the early stages of a 2-alternative choice odor discrimination task depending on the degree of similarity of the two odors [67]. In fact, for very similar stimuli their early strategy suggests that they actually can not yet tell the test odors apart. In that case suitable prior enrichment may even allow the animals to employ their coarse-discrimination strategy for odor pairs for which without enrichment they would use the fine-discrimination strategy.
Decorrelation by Individual and Joint Normalization. Divisive response normalization has been discussed extensively in sensory processing, in particular in the visual system [68]. In this type of normalization the response of each cell, which corresponds to a channel with given response characteristics like preferred orientation or spatial frequency of visual grid patterns, is divided by the sum of the activities of cells covering a wider range of response characteristics. The gain control implemented by this process is consistent with various experimentally observed neural responses (e.g. contrast independence and contrast adaption) [68]. In olfaction it has been proposed that such a normalization may arise from the lateral inhibition provided by the network of peri-glomerular cells, short-axon cells, and external tufted cells in the glomerular layer of the olfactory bulb [69]. Divisive normalization has been observed in the antennal lobe, which is the insect analogue of the olfactory bulb [70]. Implemented in simulations by global lateral inhibition, it was found to reduce the correlation between the different channels (activities of the principal neurons) across a large set of odors [70, 71].
Further analysis of our neurogenetic model suggests that the olfactory bulb performs a complementary type of divisive normalization (unpublished data). Rather than reshaping the mitral cell activities such that their pattern average is the essentially the same for all stimuli, the activity-dependent survival of the granule cells tends to equalize (normalize) the activity of all mitral cells when averaged across the stimulus set. Correspondingly, it foremost contributes to a reduction of the correlations between pairs of activity patterns rather than between pairs of mitral cells (channels). For stimuli whose similarity is dominated by highly co-active mitral cells the normalization of the activity of individual mitral cells achieves, however, only quite limited decorrelation. The joint normalization of the activities of multiple mitral cells, which results from the lateral inhibition of granule cells connected to multiple mitral cells, can preserve some differences in the mitral cell activities and, as a consequence, can achieve considerably better pattern decorrelation.
Limitations of the Model. In our minimal model we have focused on the impact of the structural plasticity afforded by the turn-over of the granule cells. We have therefore treated the individual mitral and granule cells in a minimalistic fashion. In particular, we have described them in terms of linear rate dynamics without any threshold. Previous studies have shown that nonlinearities can induce stimulus decorrelation even in non-adaptive networks [4, 7, 3]. An interesting question is therefore whether neuronal nonlinearities could further enhance the decorrelation achieved by the adaptive networks studied here.
Moreover, we have modeled each neuron as a single compartment. Both, mitral and granule cells, have, however, elaborate dendrites, which most likely increase the complexity of their interaction. Thus, while action potentials can propagate with little attenuation along the mitral cell dendrite and can excite granule cells even at large distances, the inhibition that a granule cell imparts to a mitral cell is expected to depend strongly on the distance of the GABAergic synapse from the mitral cell soma. The mutual inhibition that a granule cell mediates between mitral cells will then not be symmetric. We have mimicked such an asymmetry by modifying the effective connectivity matrix and found that the network performance is quite robust with respect to such perturbations.
The dendritic computations in the granule cells are tied in with their complex multi-level calcium dynamics [50, 51]. Even quite small depolarizations of a granule cell spine can induce local GABA release, which results in graded self-inhibition of the driving mitral cell. Stronger inputs can induce low-threshold calcium spikes that can spread within the dendritic tree. Finally, suitable inputs can trigger somatically evoked conventional sodium-driven action potentials that invade the whole dendrite. This complexity may endow the granule cell with additional computational power like a dynamically regulated range of inhibition. Since the ability to generate sodium spikes develops last in adult-born granule cells [13], the balance between local signaling, calcium spikes, and sodium spikes may change with the age of the cell. While our phenomenological modeling does not capture this biophysical complexity, it shows that a reduction of the self-inhibition and a concomitant enhancement of lateral inhibition can substantially improve the decorrelation of stimulus representations.
The mechanisms controling the survival and apoptosis of granule cells are not understood in detail. It is known that larger fractions of granule cells survive if the animal is kept in odor-enriched enviroments [19] or if the excitability of the granule cells is genetically enhanced [41]. In our minimal model we therefore assumed that the survival of the granule cells increases with their activity. It has been found, however, that certain associative odor discrimination tasks can not only enhance but also reduce the survival of the adult-borne granule cells, depending on their age [23]. Recent experiments have also indicated that apoptosis of specific neurons can be elevated when associative memories are erased [72]. It would be interesting to extend our minimal model, which aims to capture the impact of neurogenesis on non-associative odor discrimination tasks [44, 45, 40], to such more complex situations.
In conclusion, using a minimal computational model we have shown that adult neurogenesis with activity-dependent apoptosis of inhibitory interneurons that are reciprocally connected with the principal neurons is sufficient to restructure a network like that of the olfactory bulb such that it learns to decorrelate representations of very similar stimuli. The network performance is quite robust with respect to various types of deviations from reciprocity that are likely to be present in the olfactory bulb. The model makes predictions regarding the impact of different enrichment protocols on the performance of animals in spontaneous and award-related odor discrimination tasks. Their outcome is expected to give insight into the type of network connectivity that is associated with the interneuronal turn-over.
Methods
Discrete Adaptive Network Model
We consider a minimal computational network model that focuses on the turn-over of inhibitory interneurons caused by neurogenesis and activity-dependent apoptosis and study the networks’ ability to learn to decorrelate similar stimulus representations. The recurrent network comprises two types of neurons, principal neurons (mitral cells) and inhibitory interneurons (granule cells), which are coupled through reciprocal synapses (Fig.1). Within the framework of threshold-linear rate equations the activity of mitral cell in response to stimulus with afferent activity pattern , , and the corresponding activity of granule cell , , satisfy
| (3) | |||||
| (4) |
with the rectifier defined as
| (5) |
Here denotes the spontaneous activity of the mitral cells [46, 73] in the absence of any odor stimulus and without any inhibitory inputs from granule cells. The stimuli are taken from a stimulus ensemble . Throughout this paper we consider only the steady states that the mitral and granule cell activities reach in response to long stimulus presentations. The temporal evolution that we discuss is that of the network connectivity, which has a time scale that is much slower than that of the neuronal activities.
For strong inhibition and in particular for asymmetric connectivity matrices (cf. RESULTS, Imperfect Reciprocity of Synapses is Sufficient) the steady states of (3,4) may become unstable. While we did find complex eigenvalues in the spectrum of the linear operator of (3,4), which correspond to oscillatory modes, in none of the cases we considered did any of the eigenvalues have positive real parts. Thus, the steady output patterns remained stable for all parameters values we considered.
For sufficiently large spontaneous activity essentially all mitral cell activities – and with them the granule cell activities – are positive and the results are changed only slightly if the rectified coupling Eq.(5) is replaced by a linear coupling. We therefore use in the following only the linear coupling, which reduces the computational effort substantially.
The restructuring of the network due to neurogenesis is implemented by adding granule cells to the network at a steady rate and removing them with an activity-dependent probability. No detailed information is available to what extent the formation of synapses between granule and mitral cells depends on their activity or the previous presence of synapses at that location. Since the secondary dendrites of the mitral cells, onto which the granule cells synapse, extend over large portions of the olfactory bulb we assume in this minimal model that each granule cell has the potential to establish a connection with any of the mitral cells. Thus, we assume that each of the new granule cells connects to randomly chosen mitral cells. Consistent with observations [74] we assume that no granule cell connects to any mitral cell twice.
A characteristic feature of the dendro-dendritic synapses connecting mitral and granule cells is the prevalent juxtaposition of a glutamatergic synapse onto the granule cell and a GABAergic synapse onto the mitral cell [37]. There are indications that the glutamatergic and the GABAergic component form at very similar times [65], with possibly the glutamatergic component formed somehwat earlier [75]. Anatomically, the connections between these two cell types are therefore predominantly reciprocal. This reciprocity is important for the ability of the resulting network to decorrelate stimulus representations. It implies
| (6) |
with if granule cell is receiving input from mitral cell and otherwise. Due to the linearity of the neuronal dynamics the effective connectivity matrix is given by
| (7) |
Focusing on the structural plasticity provided by the persistent turn-over of granule cells rather than any plasticity of the synapses [76, 77], we assume in most of this work that all inhibitory synapses have fixed equal strength and all excitatory synapses have strength 1. To probe the role of reciprocity we consider in Sec. RESULTS; Imperfect Reciprocity of Synapses is Sufficient also connectivities violating (6) and heterogeneities in the synaptic strength .
We model activity-dependent apoptosis of the granule cells [41] by discrete events [78] during which the survival of any given granule cell is assessed based on the history of its activity. The duration of the time interval over which the activity influences cell survival is currently not known. We assume that it is long enough for the animal to be exposed to a number of relevant odors defining a stimulus ensemble S. Thus, at each of these events, which we assume for simplicity to occur regularly in time defining a time step of length , granule cells are removed probabilistically. Their survival probability is taken to depend in a sigmoidal fashion on their cumulative, thresholded activity across the stimulus ensemble . Introducing the resilience of granule cell via
| (8) |
with a resilience threshold , we take
| (9) |
with a soft survival threshold . Since little is known about the specifics of the survival probability we take here and . In this model a granule cell has to reach an activity beyond at least for some of the stimuli in the ensemble in order to trigger the signaling pathway that controls its survival [57, 58, 41].
The probabilistic network evolution eventually leads to a statistically steady state as characterized by the output patterns and their correlations fluctuating around constant values. The magnitude of the fluctuations decreases with an increase in the overall number of granule cells in the system, which can be achieved by a suitable decrease in the synaptic weight . Fig.9B shows the typical size of fluctuations in the correlation for the parameters used in our study.
The network evolution is self-regulated by the balance between proliferation and apoptosis: with increasing granule-cell population the overall inhibition of the mitral cells increases, leading to a reduction in granule cell activity. This lowers the survival probability of the granule cells and provides the saturation of the network size. As observed experimentally, reduced odor stimulation leads to a reduction in the size of the granule cell population [15].
We quantify the reshaping of the stimulus representations by the resulting network using the Pearson correlation of patterns
| (10) |
where . The average correlation is given by
| (11) |
Population Description
To capture certain aspects of the network evolution analytically we also consider the weak-coupling limit, . The number of granule cells is then large and the network restructuring can be described in terms of differential equations for the mean size of the various populations of granule cells that have established the same connections with mitral cells. For simplicity we give here only the equations for two-connection networks in which each granule cell makes connections with two mitral cells. The probability for the population of granule cells connecting mitral cells and to have size evolves during a small time step according to
| (12) | |||||
where is the fixed influx of new granule cells and is the removal rate. With giving the probability for a granule cell to survive for the duration , the removal rate is given by
| (13) |
Here we have used that different cells are removed independently of each other. The resilience is given in terms of the activity of the granule cells analogous to Eq.(8). For large mean population size the probability distribution ,t) will be sufficiently sharply peaked to allow to approximate the evolution equation for ,
| (14) |
by
| (15) |
Here and in the following we drop the brackets indicating the mean value.
The steady-state neuronal activities are given by
| (16) | |||||
| (17) |
Note that for networks with a realistic number of mitral cells the number of possible different granule cell populations is extremely large, much larger than the total number of granule cells in the olfactory bulb. Thus, the size of most populations will be small and fluctuations in the number of granule cells, which have been neglected in the population description eqs.(15,16,17), may become relevant. The main purpose of the population formulation is to allow analytical approaches for simple cases, which can provide insight that may be hard to extract from numerical simulations of the discrete model. When interpreting the analytical results the limitations of the formulation need to be kept in mind.
For analytical calculations considering a steep sigmoid, , for the survival probability in Eq.(15) is particularly attractive. The steady state of the population description eqs.(15,16,17) can then be analyzed quite easily because the nullcline for the population , which is defined by , is then very well approximated by since switches quickly from to as passes through .
Interference and Optimal Resilience Threshold
To obtain analytical results for the threshold that minimizes interfering connections between mitral cells that are strongly active but only during the presentation of different stimuli we consider a set of four stimuli activating four glomeruli,
| (18) | |||||
| (19) |
The symmetry of this stimulus ensemble has been chosen such that for networks in which each granule cell connects to two mitral cells only two granule-cell populations have to be analyzed, and . Independent of the values of the thresholds the remaining populations are given by
For these stimulus pairs are highly correlated. We consider their reshaping by networks that are trained using the slightly simplified ensemble with . The approximate nullclines and for the evolution of the two populations and are then given by (cf. Eq.(8))
| (20) | ||||
| (21) |
Without loss of generality we have absorbed into the definition of . Depending on the system has two fixed points. For one has
| (22) |
where is given by
| (23) |
For the fixed point is given by
| (24) |
Thus, the interference induced by population vanishes for , while the inhibition of the co-active cells starts to decrease at Since the correlation decreases with decreasing but increases with decreasing it is minimal for .
Two comments regarding the solution (24) with are in order. The nullclines are given by (20,21) only in the limit For finite values of corrections arise that render non-zero (cf. (15)). Moreover, the description of the granule cell populations solely in terms of their mean values requires that the means are sufficiently large. In particular, since the population is always non-negative its mean cannot strictly vanish. Nevertheless, for small influx and large the population will become very small as is increased beyond .
Alternating vs Mixture Protocol
A simple model with four stimuli and four glomeruli can also be used to obtain insight into the difference between the alternating stimulus protocol and the mixture protocol of Sec. RESULTS; Effective Enrichment: Overall Overlap is Not Sufficient. To mimic the alternating protocol we use stimuli (18,19) with and for the training with the mixture protocol we use . For this protocol all granule cell populations are equal, which we denote by .
The nullcline determining is given by
| (25) |
For comparison with in the alternating protocol (21) gives , implying
| (26) |
where and are the granule cell populations given by (22). Thus, within this simple model the mixture protocol induces stronger inhibition than the alternating protocol between the first and second pair of mitral cells, . This inhibition enhances the decorrelation of stimuli like and , which mimic the test stimuli of Sec. RESULT; Effective Enrichment: Overall Overlap is Not Sufficient. This relationship among the populations is also found in the simulations of the full discrete model of Fig.10. Excluding the terms on the diagonal, which provide self-inhibition, the sums of the synaptic weights in the four quadrants of the effective connectivity matrix are found to be
| (27) |
The terms above the braces indicate which population is considered to correspond to which block. Note that each quadrant contains many connections that are not specific to limonene or carvone (cf. Fig.9); neither will they be affected much by the difference in the protocol nor will they contribute substantially to the discrimination of the test stimuli.
Natural Stimuli
To test the ability of the model network to decorrelate stimulus representations we use an ensemble of stimuli modeled after the activation patterns in the glomerular layer of rat that have been obtained experimentally via -deoxyglucose uptake in response to odor exposure (published in the Glomerular Activity Response Archive http://gara.bio.uci.edu/, cf. [42]). In these data the individual glomeruli have not been identified. Clearly, not each of the pixels corresponds to a glomerulus. We have down-sampled the experimentally determined pixel patterns to 424 input channels (or 50 channels in cases in which we illustrate the connectivity), and take each channel as a proxy for a glomerulus. In the down-sampling we avoid excessive smoothing of the resulting patterns by retaining in each set of adjacent pixels the highest value rather than their average (Fig.2A). The stimulus set includes 2 pairs of enantiomers, -limonene and -carvone, which are difficult to discriminate. Specifically, without training mice do not discriminate between the two enantiomers of limonene [40]. When addressing the ability of the model network to learn to decorrelate highly similar stimuli we focus on these 4 stimuli. In addition, to mimic a background odor environment we include four additional stimuli, 1-butanol, 1-hexanol, 1-heptanol, and acetic acid.
Acknowledgments
We thank W.L. Kath and R.W. Friedrich for feed-back on the manuscript.
References
- 1. Friedrich RW, Laurent G (2001) Dynamic optimization of odor representations by slow temporal patterning of mitral cell activity. Science 291: 889.
- 2. Friedrich RW, Habermann CJ, Laurent G (2004) Multiplexing using synchrony in the zebrafish olfactory bulb. Nature Neurosci 7: 862.
- 3. Wiechert MT, Judkewitz B, Riecke H, Friedrich RW (2010) Mechanisms of pattern decorrelation by recurrent neuronal circuits. Nat Neurosci 13: 1003–1010.
- 4. Cleland TA, Sethupathy P (2006) Non-topographical contrast enhancement in the olfactory bulb. BMC Neurosci 7: 7.
- 5. Kuffler SW (1953) Discharge patterns and functional organization of mammalian retina. J Neurophysiol 16: 37–68.
- 6. Fantana A, Soucy E, Meister M (2008) Rat olfactory bulb mitral cells receive sparse glomerular inputs. Neuron 59: 802–814.
- 7. Arevian A, Kapoor V, Urban NN (2008) Activity-dependent gating of lateral inhibition in the mouse olfactory bulb. Nat Neurosci 11: 80–87.
- 8. Wilson DA, Stevenson RJ (2006) Learning to smell: olfactory perception from neurobiology to behavior. The Johns Hopkins University Press.
- 9. Brennan PA, Kendrick KM (2006) Mammalian social odours: attraction and individual recognition. Philos Trans R Soc Lond B Biol Sci 361: 2061–2078.
- 10. Mak GK, Weiss S (2010) Paternal recognition of adult offspring mediated by newly generated CNS neurons. Nat Neurosci 13: 753.
- 11. Whitman MC, Greer CA (2009) Adult neurogenesis and the olfactory system. Prog Neurobiol 89: 162–175.
- 12. Ortega-Perez I, Murray K, Lledo P (2007) The how and why of adult neurogenesis. J Mol Histol : 1295–1295.
- 13. Lledo PM, Alonso M, Grubb MS (2006) Adult neurogenesis and functional plasticity in neuronal circuits. Nature Rev Neurosc 7: 179-193.
- 14. Lazarini F, Lledo PM (2011) Is adult neurogenesis essential for olfaction? Trends Neurosci 34: 20–30.
- 15. Petreanu L, Alvarez-Buylla A (2002) Maturation and death of adult-born olfactory bulb granule neurons: Role of olfaction. J Neurosci 22: 6106-6113.
- 16. Mandairon N, Jourdan F, Didier A (2003) Deprivation of sensory inputs to the olfactory bulb upregulates cell death and proliferation in the subventricular zone of adult mice. Neuroscience 119: 507-516.
- 17. Yamaguchi M, Mori K (2005) Critical period for sensory experience-dependent survival of newly generated granule cells in the adult mouse olfactory bulb. Proc Natl Acad Sci U S A 102: 9697–9702.
- 18. Mandairon N, Sacquet J, Jourdan F, Didier A (2006) Long-term fate and distribution of newborn cells in the adult mouse olfactory bulb: Influences of olfactory deprivation. Neuroscience 141: 443-451.
- 19. Rochefort C, Gheusi G, Vincent JD, Lledo PM (2002) Enriched odor exposure increases the number of newborn neurons in the adult olfactory bulb and improves odor memory. J Neurosci 22: 2679-2689.
- 20. Magavi SS, Mitchell BD, Szentirmai O, Carter BS, Macklis JD (2005) Adult-born and preexisting olfactory granule neurons undergo distinct experience-dependent modifications of their olfactory responses in vivo. J Neurosci 25: 10729-10739.
- 21. Alonso M, Ortega-Perez I, Grubb M, Bourgeois J, Charneau P, et al. (2008) Turning astrocytes from the rostral migratory stream into neurons: a role for the olfactory sensory organ. J Neurosci 28: 11089–11102.
- 22. Döbrössy MD, Drapeau E, Aurousseau C, Le Moal M, Piazza PV, et al. (2003) Differential effects of learning on neurogenesis: learning increases or decreases the number of newly born cells depending on their birth date. Mol Psychiatry 8: 974–982.
- 23. Mouret A, Gheusi G, Gabellec M, de Chaumont F, Olivo-Marin J, et al. (2008) Learning and survival of newly generated neurons: when time matters. J Neurosci 28: 11511–11516.
- 24. Kermen F, Sultan S, Sacquet J, Mandairon N, Didier A (2010) Consolidation of an olfactory memory trace in the olfactory bulb is required for learning-induced survival of adult-born neurons and long-term memory. PLoS One 5: e12118.
- 25. Sultan S, Lefort JM, Sacquet J, Mandairon N, Didier A (2011) Acquisition of an olfactory associative task triggers a regionalized down-regulation of adult born neuron cell death. Front Neurosci 5: 52.
- 26. Mak GK, Enwere EK, Gregg C, Pakarainen T, Poutanen M, et al. (2007) Male pheromone-stimulated neurogenesis in the adult female brain: possible role in mating behavior. Nat Neurosci 10: 1003–1011.
- 27. Shingo T, Gregg C, Enwere E, Fujikawa H, Hassam R, et al. (2003) Pregnancy-stimulated neurogenesis in the adult female forebrain mediated by prolactin. Science 299: 117-120.
- 28. Kim W, Kim Y, Eun B, Park O, Kim H, et al. (2007) Impaired migration in the rostral migratory stream but spared olfactory function after the elimination of programmed cell death in bax knock-out mice. J Neurosci 27: 14392–14403.
- 29. Imayoshi I, Sakamoto M, Ohtsuka T, Takao K, Miyakawa T, et al. (2008) Roles of continuous neurogenesis in the structural and functional integrity of the adult forebrain. Nat Neurosci 11: 1153.
- 30. Breton-Provencher V, Lemasson M, Peralta MR, Saghatelyan A (2009) Interneurons produced in adulthood are required for the normal functioning of the olfactory bulb network and for the execution of selected olfactory behaviors. J Neurosci 29: 15245–15257.
- 31. Mouret A, Lepousez G, Gras J, Gabellec MM, Lledo PM (2009) Turnover of newborn olfactory bulb neurons optimizes olfaction. J Neurosci 29: 12302–12314.
- 32. Sultan S, Mandairon N, Kermen F, Garcia S, Sacquet J, et al. (2010) Learning-dependent neurogenesis in the olfactory bulb determines long-term olfactory memory. Faseb J 24: 2355-2363.
- 33. Lazarini F, Mouthon M, Gheusi G, de Chaumont F, Olivo-Marin JC, et al. (2009) Cellular and behavioral effects of cranial irradiation of the subventricular zone in adult mice. PLoS One 4: e7017.
- 34. Valley M, Mullen TR, Schultz L, Sagdullaev BT, Firestein S (2009) Ablation of mouse adult neurogenesis alters olfactory bulb structure and olfactory fear conditioning. Frontiers in Neurogenesis 3: 51.
- 35. Sahay A, Wilson DA, Hen R (2011) Pattern separation: a common function for new neurons in hippocampus and olfactory bulb. Neuron 70: 582–588.
- 36. Ninkovic J, Mori T, Götz M (2007) Distinct modes of neuron addition in adult mouse neurogenesis. J Neurosci 27: 10906–10911.
- 37. Shepherd GM (2004) Olfactory bulb. In: Shepherd G, editor, The Synaptic Organization of the Brain, Oxford University Press, chapter 5. p. 165.
- 38. Winner B, Cooper-Kuhn CM, Aigner R, Winkler J, Kuhn HG (2002) Long-term survival and cell death of newly generated neurons in the adult rat olfactory bulb. Eur J Neurosci 16: 1681-1689.
- 39. Mandairon N, Didier A, Linster C (2008) Odor enrichment increases interneurons responsiveness in spatially defined regions of the olfactory bulb correlated with perception. Neurobiol Learn Mem 90: 178.
- 40. Moreno MM, Linster C, Escanilla O, Sacquet J, Didier A, et al. (2009) Olfactory perceptual learning requires adult neurogenesis. Proc Natl Acad Sci U S A 106: 17980.
- 41. Lin CW, Sim S, Ainsworth A, Okada M, Kelsch W, et al. (2010) Genetically increased cell-intrinsic excitability enhances neuronal integration into adult brain circuits. Neuron 65: 32-9.
- 42. Johnson B, Leon M (2007) Chemotopic odorant coding in a mammalian olfactory system. J Comp Neurol 503: 1–34.
- 43. Mandairon N, Stack C, Kiselycznyk C, Linster C (2006) Broad activation of the olfactory bulb produces long-lasting changes in odor perception. Proc N Acad USA 103: 13543-13548.
- 44. Mandairon N, Stack C, Linster C (2006) Olfactory enrichment improves the recognition of individual components in mixtures. Physiol Behav 89: 379-384.
- 45. Mandairon N, Stack C, Kiselycznyk C, Linster C (2006) Enrichment to odors improves olfactory discrimination in adult rats. Behav Neurosci 120: 173–179.
- 46. Rinberg D, Koulakov A, Gelperin A (2006) Sparse odor coding in awake behaving mice. J Neurosci 26: 8857–8865.
- 47. Cecchi GA, Petreanu LT, Alvarez-Buylla A, Magnasco MO (2001) Unsupervised learning and adaptation in a model of adult neurogenesis. J Comput Neurosci 11: 175-182.
- 48. Wick S, Wiechert M, Friedrich R, Riecke H (2010) Pattern orthogonalization via channel decorrelation by adaptive networks. J Comput Neurosci 28: 29–45.
- 49. Linster C, Sachse S, Galizia CG (2005) Computational modeling suggests that response properties rather than spatial position determine connectivity between olfactory glomeruli. J Neurophysiol 93: 3410-3417.
- 50. Egger V, Urban NN (2006) Dynamic connectivity in the mitral cell-granule cell microcircuit. Sem Cell Devel Biol 17: 424–432.
- 51. Egger V (2008) Synaptic sodium spikes trigger long-lasting depolarizations and slow calcium entry in rat olfactory bulb granule cells. Eur J Neurosci 27: 2066–2075.
- 52. Davie JT, Schaefer AT (2011) Functional connectivity and integration in the mitral cell - granule cell network of the olfactory bulb. In: Annual Meeting of the Society for Neuroscience. p. abstract 475.13.
- 53. Belnoue L, Grosjean N, Abrous DN, Koehl M (2011) A critical time window for the recruitment of bulbar newborn neurons by olfactory discrimination learning. J Neurosci 31: 1010-1016.
- 54. McNamara AM, Magidson PD, Linster C, Wilson DA, Cleland TA (2008) Distinct neural mechanisms mediate olfactory memory formation at different timescales. Learning & Memory 15: 117-125.
- 55. Wilson D, Linster C (2008) Neurobiology of a simple memory. J Neurophysiol 100: 2–7.
- 56. Chaudhury D, Manella L, Arellanos A, Escanilla O, Cleland TA, et al. (2010) Olfactory bulb habituation to odor stimuli. Behav Neurosci 124: 490–499.
- 57. Dolmetsch RE, Pajvani U, Fife K, Spotts JM, Greenberg ME (2001) Signaling to the nucleus by an L-type calcium channel-calmodulin complex through the MAP kinase pathway. Science 294: 333–339.
- 58. Miwa N, Storm DR (2005) Odorant-induced activation of extracellular signal-regulated kinase/mitogen-activated protein kinase in the olfactory bulb promotes survival of newly formed granule cells. J Neurosci 25: 5404.
- 59. David F, Linster C, Cleland TA (2008) Lateral dendritic shunt inhibition can regularize mitral cell spike patterning. J Comput Neurosci 25: 25-38.
- 60. Castillo PE, Carleton A, Vincent JD, Lledo PM (1999) Multiple and opposing roles of cholinergic transmission in the main olfactory bulb. J Neurosci 19: 9180-9191.
- 61. Pressler R, Inoue T, Strowbridge B (2007) Muscarinic receptor activation modulates granule cell excitability and potentiates inhibition onto mitral cells in the rat olfactory bulb. J Neurosci 27: 10969–10981.
- 62. Escanilla O, Arrellanos A, Karnow A, Ennis M, Linster C (2010) Noradrenergic modulation of behavioral odor detection and discrimination thresholds in the olfactory bulb. Eur J Neurosci 32: 458–468.
- 63. Nai Q, Dong H, Hayar A, Linster C, Ennis M (2009) Noradrenergic regulation of gabaergic inhibition of main olfactory bulb mitral cells varies as a function of concentration and receptor subtype. J Neurophysiol 101: 2472–2484.
- 64. Kaneko N, Okano H, Sawamoto K (2006) Role of the cholinergic system in regulating survival of newborn neurons in the adult mouse dentate gyrus and olfactory bulb. Genes Cells 11: 1145–1159.
- 65. Whitman M, Greer C (2007) Synaptic integration of adult-generated olfactory bulb granule cells: basal axodendritic centrifugal input precedes apical dendrodendritic local circuits. J Neurosci 27: 9951–9961.
- 66. Kelsch W, Lin C, Lois C (2008) Sequential development of synapses in dendritic domains during adult neurogenesis. Proc Natl Acad Sci U S A 105: 16803–16808.
- 67. Kay LM, Beshel J (2010) A beta oscillation network in the rat olfactory system during a 2-alternative choice odor discrimination task. J Neurophysiol 104: 829–839.
- 68. Heeger DJ (1992) Normalization of cell responses in cat striate cortex. Vis Neurosci 9: 181–197.
- 69. Cleland TA, Johnson B, Leon M, Linster C (2007) Relational representation in the olfactory system. Proc Natl Acad Sci U S A 104: 1953–1958.
- 70. Olsen SR, Bhandawat V, Wilson RI (2010) Divisive normalization in olfactory population codes. Neuron 66: 287–299.
- 71. Luo SX, Axel R, Abbott LF (2010) Generating sparse and selective third-order responses in the olfactory system of the fly. Proc Natl Acad Sci U S A 107: 10713–10718.
- 72. Sultan S, Rey N, Sacquet J, Mandairon N, Didier A (2011) Newborn neurons in the olfactory bulb selected for long-term survival through olfactory learning are prematurely suppressed when the olfactory memory is erased. J Neurosci 31: 14893–14898.
- 73. Yaksi E, Judkewitz B, Friedrich RW (2007) Topological reorganization of odor representations in the olfactory bulb. PLoS Biology 5: 1453–1473.
- 74. Woolf TB, Shepherd GM, Greer CA (1991) Serial reconstructions of granule cell spines in the mammalian olfactory-bulb. Synapse 7: 181-192.
- 75. Panzanelli P, Bardy C, Nissant A, Pallotto M, Sassoè-Pognetto M, et al. (2009) Early synapse formation in developing interneurons of the adult olfactory bulb. J Neurosci 29: 15039–15052.
- 76. Satou M, Hoshikawa R, Sato Y, Okawa K (2006) An in vitro study of long-term potentiation in the carp (cyprinus carpio l.) olfactory bulb. J Compar Physiol A 192: 135-150.
- 77. Gao Y, Strowbridge BW (2009) Long-term plasticity of excitatory inputs to granule cells in the rat olfactory bulb. Nat Neurosci 12: 731–733.
- 78. Yokoyama TK, Mochimaru D, Murata K, Manabe H, Kobayakawa K, et al. (2011) Elimination of adult-born neurons in the olfactory bulb is promoted during the postprandial period. Neuron 71: 883–897.
Supplementary Information: Comparison of Different Types of Adaptive Networks
Various types of adaptive networks have been discussed in the context of stimulus discrimination by the olfactory bulb. In an early model for the restructuring of the inhibitory bulbar network by neurogenesis granule cells were not treated explicitly. Instead, inhibition was assumed to be pairwise and symmetric between mitral cells with a strength that was taken as a proxy for the number of granule cells connecting the two mitral cells [47]. The mitral cells were described with a linear firing-rate model. The inhibitory weight of the connection between two mitral cells was increased proportional to the pairwise scalar product of the activity of these two mitral cells across a stimulus ensemble. Since the activities represented deviations from the mean they could also be negative in this model.
From a more general perspective it has been shown that a network can make stimulus representations orthogonal if it normalizes the activity of each output channel (i.e. the activity of each mitral cell) across the stimulus ensemble and orthogonalizes the output activities [48]. In a recurrent inhibitory network with symmetric connectivity this is achieved if the inhibition between the channels is essentially given by the square-root of the matrix of pairwise scalar products of the input activities.
For the honey bee olfactory system experimental data are available for the inputs as well as the outputs of the antennal lobe. These were employed in a computational model of the antennal lobe to show that the pattern transformation performed by the antennal lobe is better captured by models in which the connectivity of the inhibitory network is based on the correlations between the glomerular inputs than by models with random or spatially local connectivity [49].
Motivated by these different types of adaptive networks we compare the ability of a number of different adaptive recurrent networks to decorrelate the natural stimuli of Fig.2. In all cases only the principal neurons are retained and their dynamics are given by the linear rate model
| (28) |
with an effective inhibitory connectivity matrix . We use to denote the ensemble of stimuli in terms of a matrix in which the columns consist of the stimulus activities. In our neurogenetic model the spontaneous mitral cell activity modifies the connectivity. In the other connectivities we incorporate by using an effective stimulus ensemble , where is a matrix in which all entries are equal to . The connectivity matrices are then given by
| (29) | |||||
| (30) | |||||
| (31) | |||||
| (32) | |||||
| (33) | |||||
| (34) |
In each of these connectivities the inhibition between pairs of mitral cells is related to a broadly defined similarity of their responses to the stimuli in the ensemble. The similarity is, however, assessed in different ways in each case. Connectivity is obtained from our neurogenesis model (eqs. (3,4,9) in the main manuscript) with 50 mitral cells. In this model the similarity is measured in terms of an additive co-activity. In connectivities and the similarity is measured in terms of a multiplicative co-activity. The connectivity stems from the orthogonalizing networks [48], with the parameter determining the -norm of the outputs with fixed. Without any attempt to optimize the performance we choose here . Connectivity is motivated by the algorithm used in [47]. Connectivity is motivated by the modeling of the antennal lobe network [49]; here denotes the Pearson correlation between the stimulus activities of glomerulus and glomerulus given the stimulus ensemble . Analogously, in connectivity denotes the corresponding covariance. Writing instead of in , , and emphasizes the fact that these connectivities are not sensitive to . The connectivity matrices , , and are not guaranteed to have only positive entries. We therefore set any negative entries to 0.
To compare the different connectivities we use two different approaches. Since the decorrelation performance often improves with increasing inhibition and decreasing output amplitude, we choose the overall inhibitory weight for each connectivity such that it generates the same mean output amplitude as the neurogenesis model. Some connectivities perform, however, optimally at an intermediate inhibitory strength. Therefore we also consider the dependence of the performance on the inhibitory strength.
We characterize the different networks in two ways. We determine the similarity of the connectivities directly using a scaled distance between them, which we define as
| (35) |
Then we assess the performance of the networks in terms of the correlations of their outputs given the stimulus ensemble .
The distance measure reveals that the co-activity based connectivities , , and are quite similar to each other for both values of (Fig.S11). The relationship among the other connectivities is not as clear. For it appears as if and also formed a cluster. However, it does not persist for (Fig.S11B) and other values of the mean output amplitude (not shown). Similarly, for some output amplitudes and are much closer to each other than for the output amplitudes used in Fig.S11.
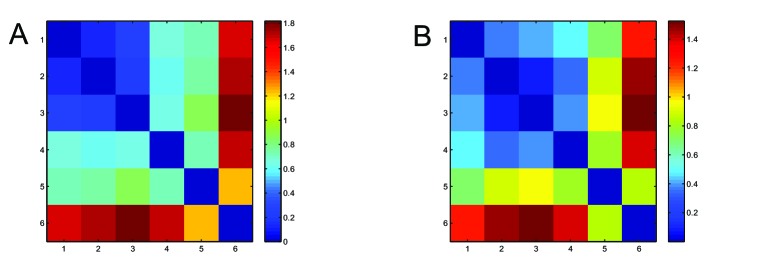
To assess the decorrelation performance of the networks directly we determine the correlations in the outputs for the stimuli to which they are adapted. Without the spontaneous activity of the mitral cells, , each of the connectivities (29-34) is able to reduce the correlation of the representations of the highly similar stimuli (black bars in Fig.S12A), albeit to very different degrees. This is not the case for the less correlated stimuli. Consistent with the similarity of the co-activity based connectivities seen in Fig.S11, , , and perform similarly and quite well for all stimuli. The connectivities , , and , however, only decorrelate the representations of the highly similar stimuli; for the less related inputs their performance is very poor; in fact, on average the outputs of and are more correlated than their inputs (Fig.S12B).

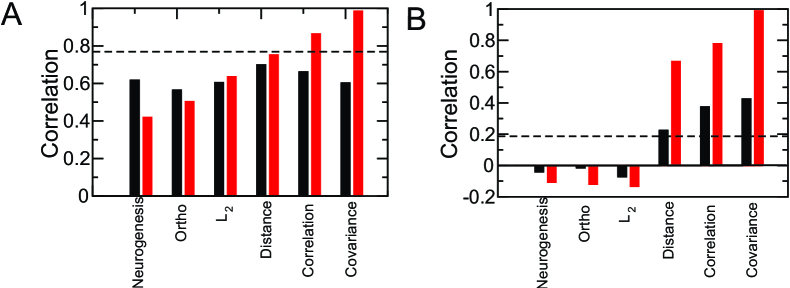
For non-zero spontaneous activity, , most connectivities perform worse, in particular for the highly similar stimuli. Nevertheless, the co-activity based connectivities perform still quite well overall. The performance of , , and , however, is poor. Even the representations of the highly similar stimuli are not decorrelated any more. This reflects, in part, the fact that these adaptation schemes do not account for the spontaneous mitral cell activity, which effectively corresponds to a significant mean value in the input activities.
The strikingly poor decorrelation by the correlation-based and the covariance-based network for the inhibition level used in Fig.S12 raises the question whether their performance could be improved by optimizing the overall inhibition. We therefore vary for each network the overall inhibition level while keeping the network structures fixed as defined by (29-34). For adaptive networks the inhibition level affects, in principle, also the training of the network; the network structure is therefore not really independent of . However, none of the comparison networks (30-34) are defined via a training algorithm; for them is a free parameter. Varying over a range that induces comparable changes in the output amplitude we find that the performance of the co-activity based connectivities improves monotonically with decreasing amplitude. In Fig.S13 this is shown for the top correlation for (black) and (red). It also holds for the overall correlation (not shown). The connectivities and exhibit different behavior. For they both decorrelate the representations of the highly similar stimuli for weak inhibition, but as the inhibition is increased the output correlation starts to rise again. With non-zero spontaneous mitral cell activity the output correlation increases monotonically already starting from . We find that the overall correlation increases monotonically even for (not shown). The distance-based connectivity reduces monotonically for . For , however, the correlation increases to a maximum before it starts to decrease. Similarly, the overall correlation increases initially with increasing inhibition.
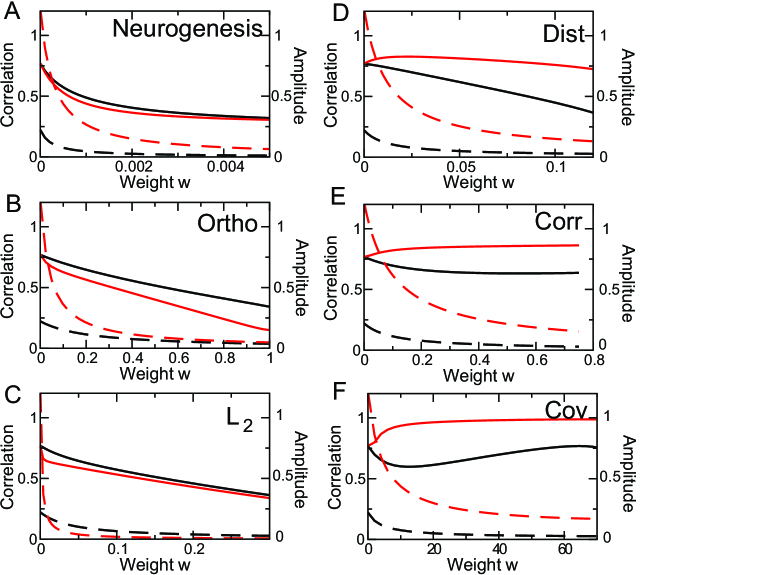
The network is designed to orthogonalize the representation of the stimulus ensemble. Nevertheless, in the situations shown in Fig.S12A and Fig.S13A it does not achieve this goal for the highly similar stimuli. This is a result of the requirement that the network be purely inhibitory, i.e. . Depending on the stimulus ensemble and the desired output amplitudes this restriction limits its performance to a variable degree. In other situations essentially perfect decorrelation is obtained [48].
Our investigation of connectivities and is motivated by previous work on neurogenesis [47] and odor processing in the antennal lobe [49]. It should be noted, however, that these connectivities do not in detail represent the networks investigated in [47, 49]. In [47] the effective weights are updated according to the scalar product of the mitral cell activities and additional self-inhibition as well as a total synaptic weight normalization is introduced. In [49] the inhibition is feedforward rather than recurrent, i.e. it is driven directly by the inputs.
This survey does not aim to represent an exhaustive analysis of the various decorrelation mechanisms. It suggests, however, that co-activity based connectivities like , , and are much more capable to decorrelate stimulus representations under various conditions than correlation- or covariance-based networks.