Pressure-induced and Composition-induced Structural Quantum Phase Transition in the Cubic Superconductor (Sr/Ca)3Ir4Sn13
Abstract
We show that the quasi-skutterudite superconductor Sr3Ir4Sn13 undergoes a structural transition from a simple cubic parent structure, the -phase, to a superlattice variant, the -phase, which has a lattice parameter twice that of the high temperature phase. We argue that the superlattice distortion is associated with a charge density wave transition of the conduction electron system and demonstrate that the superlattice transition temperature can be suppressed to zero by combining chemical and physical pressure. This enables the first comprehensive investigation of a superlattice quantum phase transition and its interplay with superconductivity in a cubic charge density wave system.
pacs:
74.25.-q, 62.50.-p, 74.40.KbStructural self-organisation is a central theme in condensed matter physics. Often, the symmetry of a given parent structure is lowered by subtle structural variations which decrease the electronic degeneracy and thereby the total energy. Examples include Jahn-Teller Bersuker06 and Peierls distortions Anderson73 and, more generally, modulated lattice distortions, or superlattices. A very diverse family of materials can be explored within the general R3T4X13 stoichiometry, where R is an earth alkaline or rare-earth element, T is a transition metal and X is a group-IV element. Among these are the superconducting and magnetic stannides remeika80 ; espinosa80 , Ce-based Kondo lattice systems sato93 , and thermoelectrics strydom07 . Many members of this family adopt a variant structure, the -phase, derived from the simple cubic parent structure (-phase, ). Empirically, compounds with divalent or tetravalent cations R occur in the -phase, whereas compounds with trivalent cations form in the -phase. Detailed diffraction studies hodeau82 ; miraglia86 ; bordet91 disagree about the precise -phase structure, but consistently interpret it as a deformation of the X12 cages, which can be viewed as a superlattice distortion of the -phase with twice the original lattice constant.
A recent reexamination yang10 of Ca3Ir4Sn13, which superconducts below , revealed distinct anomalies in the electrical resistivity and magnetic susceptibility at . In the isoelectronic sister-compound Sr3Ir4Sn13, the equivalent anomaly occurs at and superconductivity sets in at . Intermediate compositions (CaxSr1-x)3Ir4Sn13 form readily. This invites studies which exploit the negative chemical pressure from partial substitution of Ca by Sr, together with positive physical pressure from a hydrostatic pressure cell. In this Letter, we report a detailed investigation of the nature of the transition at by x-ray diffraction (XRD), and we examine the dependence of and of the superconducting and normal state properties on physical and chemical pressure. We find that (i) the anomaly is produced by a second order superlattice transition into the -phase, (ii) is suppressed with increasing pressure and extrapolates to zero temperature at in Ca3Ir4Sn13, and (iii) peaks near , and the electrical resistivity adopts a linear temperature dependence over a wide range of temperature and magnetic field close to this critical pressure.
The (CaxSr1-x)3Ir4Sn13 single crystals were grown by a flux method espinosa80 . Four-wire AC resistivity measurements were performed in a piston-cylinder cell, using a Physical Property Measurement System (Quantum Design) to control temperature, . Two Moissanite anvil cells were prepared for AC susceptibility measurements with a conventional mutual inductance method, in which a 10-turn microcoil Goh08 ; Alireza03 ; Klintberg10 is placed inside the gasket hole (thickness: 150 m, diameter: 400 m) as the pickup coil. Glycerin was used as the pressure medium for the piston-cylinder cell and for one of the anvil cells, and 4:1 methanol-ethanol mixture was used for the other anvil cell. Ruby fluorescence spectroscopy and the of lead were used to determine the pressure in the anvil and piston-cylinder cell respectively. Single crystal XRD measurements were performed using an Oxford Diffraction Gemini E Ultra utilising MoK radiation at 100 to 295 K. The structures were solved using direct methods and refined using Shelx-97 Sheldrick via the WinGX interface Farrugia . The electronic structure was calculated using the Local Density Approximation (LDA) and the Generalized Gradient Approximation (GGA) Perdew96 with Wien2k Wien . and 40,000 -points were used in a non-spin polarized calculation. The position of the 24 Sn site (0, y, z), the only free internal coordinate, was optimised numerically, resulting in (0, , ) and (0, , ) for Ca- and Sr3Ir4Sn13 respectively.
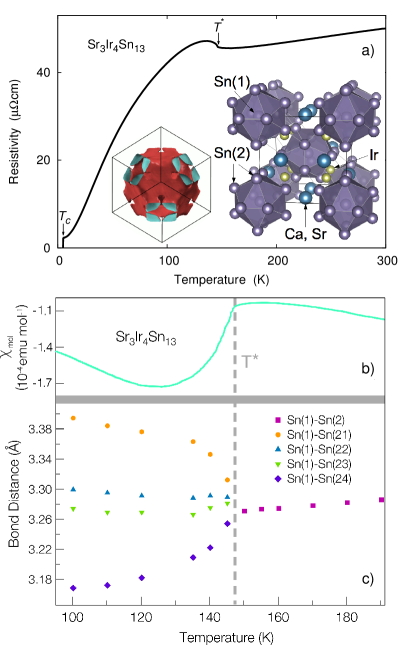
Room temperature single crystal XRD confirms that Sr3Ir4Sn13 forms in the -phase structure (Pm3̄n, lattice parameter at , inset of Fig. 1a). On cooling, distinct signatures of a phase transition at are observed in the temperature dependence of the electrical resistivity and of the magnetic susceptibility of Sr3Ir4Sn13, in addition to a superconducting transition at (Fig. 1). Below our single crystal XRD data are inconsistent with the -phase. They must instead be indexed SupMat to the -phase, a body(I)-centered cubic structure with a lattice parameter twice that of the high temperature phase (I4̄3d, at , 1, 2 and of 4.4 %, 13.9 % and 1.1 %, respectively). In the -phase, the bond distances in the Sn(1)Sn(2)12 icosahedra and in the IrSn(2)6 trigonal prisms which connect them are identical. In the -phase, however, a distortion of the Sn(2) icosahedra gives rise to four groups, Sn(1)-Sn(21-24), each group composed of three bonds with identical bond distances (see Fig. 1c). This distortion occurs in concert with tilting of three-quarters of the trigonal prisms while those whose axis are along the (111) direction remain untilted. Because of the periodic nature of this distortion, it leads to the formation of a superlattice.
| GGA calculation | LDA calculation | |||||
Electronic structure calculations give further insight into the nature of this superlattice transition. Our calculations (Table 1) suggest that in Sr3Ir4Sn13 the -phase superlattice has a slight energy advantage with respect to the -phase parent structure. Moreover, the period-doubling associated with the superlattice causes the large Fermi surface sheets computed for the -phase (e.g. left inset in Fig. 1a) to reconstruct, which gaps out significant sections of the Fermi surface. The calculated reduction in the electronic density of states at the Fermi energy amounts to nearly , or per formula unit, which translates to a change in the Pauli susceptibility of . This value is consistent with the observed reduction of the measured susceptibility at (Fig. 1b). The distinct increase of below may also be attributed at least in part to the reduction in , along with other factors, such as changes in the effective carrier mass and the scattering rate.
The significant reduction of on entering the -phase indicates that electronic states near the Fermi energy play an important role in forming the superlattice, which suggests a charge density wave (CDW) instability of the conduction electron system. In the -phase, six bands cross the Fermi level. Each sheet of the Fermi surface is three dimensional, but some sheets exhibit low curvature regions with the necessary characteristics for nesting: the flat sections of band 329 (inset of Fig. 1a) are strong candidates. The contribution of this band to the real part of the wavevector-dependent charge susceptibility , or Lindhard function, peaks at , with a 21% enhancement above that at the Brillouin zone centre SupMat . This confirms the visual impression that sections of the Fermi surface nest along the body diagonal and is consistent with the experimentally observed doubling of the lattice parameter in all directions. As in most CDW systems Johannes08 , the response of the conduction electrons in isolation is not singular, but strong electron-phonon interactions can induce an instability at the wavevector selected by the peak in the Lindhard function. Our calculations suggest that the low temperature -phase is stabilised by the interplay between a periodic lattice distortion and a CDW in the conduction electron system.
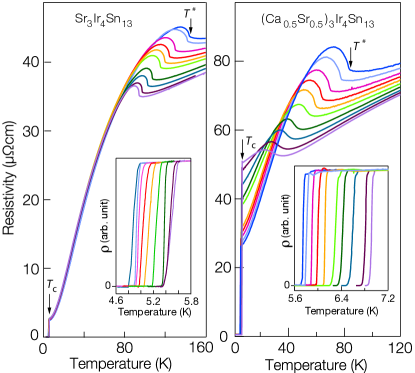
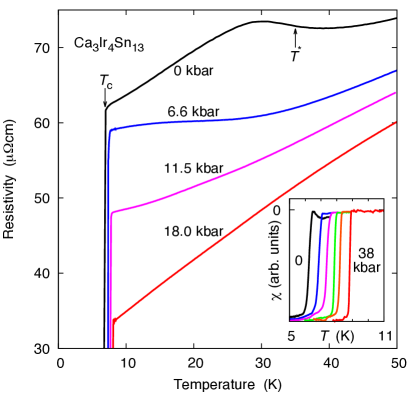
High-pressure measurements of the resistivity, , in Sr3Ir4Sn13 show that decreases rapidly with increasing pressure, , whereas rises slowly (Fig. 2a). This pattern carries over to partially Ca-substituted samples such as (Sr0.5Ca0.5)3Ir4Sn13 (Fig. 2b), which due to its smaller unit cell volume can be regarded as a high pressure analogue of Sr3Ir4Sn13. In the end member of this series, Ca3Ir4Sn13 (Fig. 3), the resistivity anomaly associated with broadens and decreases further with increasing pressure, extrapolating to 0 K at a critical pressure (see also Fig. 4). This constitutes a structural quantum phase transition or, if the transition remains continuous, a structural quantum critical point. Near , is linear over a wide temperature range, from up to 50 K. Anvil cell AC susceptibility measurements extend the available pressure range and show that peaks near at (inset of Fig. 3).
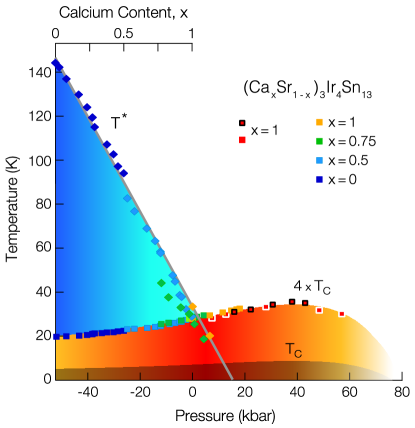
Analysis of the pressure dependence of and at intermediate substitution values suggests that the effect of fully substituting Ca with Sr places Sr3Ir4Sn13 at roughly relative to the physical pressure scale of Ca3Ir4Sn13. Applying Vegard’s law to intermediate composition values allows us to construct a universal temperature-pressure phase diagram for the (CaxSr1-x)3Ir4Sn13 series (Fig. 4). The observation of a superconducting dome, which peaks close to , and the anomalous quasi-linear are often associated with quantum critical phenomena on the threshold of magnetism mathur98 . There is, however, no evidence that the low temperature order observed in (Sr/Ca)3Ir4Sn13 is magnetic. On the contrary, the fact that no magnetic order has been reported in any other -phase material without rare-earth constituents, the low absolute magnetic susceptibility values, the absence of clear anisotropy in the susceptibility at , our spin polarised band structure calculations within density functional theory for various hypothetical magnetic states, in which the magnetic moments collapse to zero in all cases, and the strong indications that the superconducting state is conventional and fully gapped Kase11 ; zhuo12 all point towards a non-magnetic transition at . Because is strongly reduced in the -phase (Table 1), conventional BCS theory suggests that the associated is low compared to the value that could be achieved in the -phase. Conversely, when is suppressed with hydrostatic pressure, and the -phase survives to low temperatures, increases. This would be expected to raise on approaching , as is indeed observed.
To understand the initial further increase of for , the decrease of at much higher pressures and the linear temperature dependence of near (Fig. 3) we need to look beyond and examine the evolution of the phonon spectrum. If the superlattice transition remains second order or only weakly first order, then the associated optical phonon mode should soften at , which itself approaches zero at . This generates a low-lying, weakly dispersive phonon branch at low temperature. We would expect its contribution to the electrical resistivity to become linear in temperature, in analogy with the behaviour of simple metals above the Debye temperature, once the thermal energy exceeds the maximum phonon energy of this branch. A more detailed argument along the lines presented for Einstein solids cooper74 ; lortz06 , notes that the phonon contribution to the electrical resistivity can be written as
| (1) |
The sum is taken over all phonon wavevectors within a suitable cut-off, and is a -dependent Fermi surface average of the electron-phonon interaction, which is proportional to the density of states at the Fermi energy, has been weighted appropriately for transport calculations, and depends weakly on away from . Moreover, denotes the -dependent phonon frequency, and is the Bose occupation number. When exceeds the highest , this expression reverts to , giving a linear resistivity, which is strongly enhanced for low . Because the electron-phonon coupling constant can be expressed as (see, e.g. mcmillan68 ), where for large , it is seen to be directly connected to the slope of the linear resistivity.
The softening of parts of the phonon spectrum can also help explain the shape of the superconducting dome (see, e.g. calandra11 ). In the Eliashberg-McMillan treatment mcmillan68 is exponentially sensitive to , which in turn is proportional to and to . As is reduced, the removal of Fermi surface reconstruction raises , while the softening of parts of the phonon spectrum increases . Both effects tend to increase , which, if all other parameters are constant, raises . Beyond these considerations, the precise effect of a soft mode on has to be considered in order to understand the shape of the superconducting dome for pressures above . Whereas depends exponentially on , its scale prefactor is set by a weighted average of . The combined effect of scale and exponent is not necessarily optimised at the point where an optical mode is soft, as this minimises the scale prefactor. We would, instead, expect the peak to occur slightly beyond the critical point in the phase diagram, as found experimentally (Fig. 4). Eventually, the optical mode associated with the superlattice transition stiffens sufficiently so that the detrimental effect this has on begins to reduce . Detailed theoretical calculations based on more complete information about the phonon spectrum will be required to arrive at a quantitative understanding of the observed phase diagram.
Investigations into the effect of lattice instabilities on superconductivity have a long history, starting with the structurally related A15 compounds testardi75 ; tanaka10 . Examples of enhanced superconductivity near lattice instabilities include Lu5Ir4Si10 Shelton86 , dichalcogenides such as TiSe2 Morosan06 ; Kusmartseva09 and TaS2 Sipos08 , intercalated graphite CaC6 gauzzi07 , 1- or 2-D organic compounds Lubczynski96 ; Wosnitza01 , and a number of elements at very high pressure degtyareva07 . There is an emerging view that in most cases the evolution of the phonon spectrum with tuning parameters like pressure crucially influences , both by boosting it when the lattice instability is suppressed, and by reducing it again when pressure is increased further. Whereas most of the aforementioned materials are low-dimensional, very few clear cases of CDW order in 3D materials exist, notably cubic CuV2S4 fleming81 , which is not superconducting, and orthorhombic U Lander94 , for which a recent detailed examination of the phonon spectrum raymond11 suggests similarities to the mechanisms outlined above. (Sr/Ca)3Ir4Sn13 allows us to investigate the interaction between a structural instability and superconductivity in a cubic material. Our study clarifies the nature of the previously unidentified phase transition in (Sr/Ca)3Ir4Sn13, it demonstrates that this transition can be tuned to zero temperature, suggesting a structural quantum critical point, and it attributes the linear and the dome structure of to the associated softening of optical phonon modes. The prospect of fine-tuning phonon frequencies by controlling a structural transition temperature motivates further studies in this material class as well as in more complex systems, in which spin and charge density wave transitions may be correlated.
Acknowledgements We particularly thank G. G. Lonzarich, C. Pickard, and D. Khmelnitskii for helpful discussions. This work was supported by the EPSRC UK, Trinity College (Cambridge), Grant-in-Aid for Scientific Research from the JSPS (22350029), and the Global COE Program ”International Center for Integrated Research and Advanced Education in Materials Science” at Kyoto University. SKG acknowledges the Great Britain Sasakawa Foundation for travel support and Kyoto University for hospitality.
References
- (1) I. Bersuker, The Jahn-Teller Effect , Cambridge University Press (2006).
- (2) P. A. Lee, T. M. Rice, and P. W. Anderson, Phys. Rev. Lett. 31, 462 (1973).
- (3) J. Remeika, G. Espinosa, A. Cooper, H. Barz, J. Rowell, D. McWhan, J. Vandenberg, D. Moncton, Z. Fisk, L. Woolf, H. Hamaker, M. Maple, G. Shirane, and W. Thomlinson, Solid State Communications 34, 923 (1980).
- (4) G. P. Espinosa, Mater. Res. Bull. 15, 791 (1980).
- (5) H. Sato, T. Fukuhara, S. Iwakawa, Y. Aoki, I. Sakamoto, S. Takayanagi, and N. Wada, Physica B 186-88, 630 (1993).
- (6) A. M. Strydom, J. Phys.:Condens. Matter 19, 386205 (2007).
- (7) J. Hodeau, M. Marezio, J. Remeika, and C. Chen, Solid State Communications 42, 97 (1982).
- (8) S. Miraglia, J. Hodeau, M. Marezio, C. Laviron, M. Ghedira, and G. Espinosa, J. Solid State Chem. 63, 358 (1986).
- (9) P. Bordet, D. Cox, G. Espinosa, J. Hodeau, and M. Marezio, Solid State Communications 78, 359 (1991).
- (10) J. Yang, B. Chen, C. Michioka, and K. Yoshimura, J. Phys. Soc. Jpn. 79, 113705 (2010).
- (11) S. K. Goh, P. L. Alireza, P. D. A. Mann, A. M. Curnberlidge, C. Bergemann, M. Sutherland, and Y. Maeno, Curr. Appl. Phys. 8, 304 (2008).
- (12) P. L. Alireza and S. R. Julian, Rev. Sci. Instrum. 74, 4728 (2003).
- (13) L. E. Klintberg, S. K. Goh, S. Kasahara, Y. Nakai, K. Ishida, M. Sutherland, T. Shibauchi, Y. Matsuda, and T. Terashima, J. Phys. Soc. Jpn. 79, 123706 (2010).
- (14) G. M. Sheldrick, Acta Crystallographica Section A 64, 112 (2008).
- (15) L. J. Farrugia, J. Appl. Cryst. 32, 837 (1999).
- (16) J. P. Perdew, K. Burke, and M. Ernzerhof, Phys. Rev. Lett. 77, 3865 (1996).
- (17) K. Schwarz, and P. Blaha, Computational Materials Science 28, 259 (2003).
- (18) See Supplemental Material at http://link.aps.org/supplemental/… for (i) crystal structure (.cif) as well as processed data (.hkl) files from single crystal x-ray diffraction on Sr3Ir4Sn13, which provide information about relative intensity and associated errors of each observed reflection, (ii) the results of the Lindhard function calculation in Sr3Ir4Sn13, (iii) further high pressure resistivity data of the (Sr/Ca)3Ir4Sn13 composition series.
- (19) M. D. Johannes, and I. I. Mazin, Phys. Rev. B 77, 165135 (2008).
- (20) N. D. Mathur, F. M. Grosche, S. R. Julian, I. R. Walker, D. M. Freye, R. K. W. Haselwimmer, and G. G. Lonzarich, Nature 394, 39 (1998).
- (21) N. Kase, H. Hayamizu, and J. Akimitsu, Phys. Rev. B 83, 184509 (2011).
- (22) S. Y. Zhou, H. Zhang, X. C. Hong, B. Y. Pan, X. Qiu, W. N. Dong, X. L. Li, and S. Y. Li, arXiv:1202.5164 (2012).
- (23) J. R. Cooper, Phys. Rev. B 9, 2778 (1974).
- (24) R. Lortz, Y. Wang, U. Tutsch, S. Abe, C. Meingast, P. Popovich, W. Knafo, N. Shitsevalova, Yu. B. Paderno, and A. Junod, Phys. Rev. B 73, 024512 (2006).
- (25) W. L. McMillan, Phys. Rev. 167, 331 (1968).
- (26) M. Calandra and F. Mauri, Phys. Rev. Lett. 106, 196406 (2011)
- (27) L. Testardi, Rev. Mod. Phys. 47, 637 (1975).
- (28) S. Tanaka, A. Miyake, B. Salce, D. Braithwaite, T. Kagayama, and K. Shimizu, J. Phys.: Conf. Ser. 200, 012202 (2010).
- (29) R. Shelton, L. Hausermannberg, P. Klavins, H. Yang, M. Anderson, and C. Swenson, Phys. Rev. B 34, 4590 (1986).
- (30) E. Morosan,H. W. Zandbergen, B. S. Dennis, J. W. G. Bos, Y. Onose, T. Klimczuk, A. P. Ramirez, N. P. Ong, and R. J. Cava, Nature Physics 2, 544 (2006).
- (31) A. F. Kusmartseva, B. Sipos, H. Berger, L. Forro, and E. Tutis, Phys. Rev. Lett. 103, 236401 (2009).
- (32) B. Sipos, A. Kusmartseva, A. Akrap, L. F. H. Berger, and E. Tutis, Nature Materials 7, 960 (2008).
- (33) A. Gauzzi, S. Takashima, N. Takeshita, C. Terakura, H. Takagi, N. Emery, C. Herold, P. Lagrange, and G. Loupias, Phys. Rev. Lett. 98, 067002 (2007).
- (34) W. Lubczynski, S. V. Demishev, J. Singleton, J. M. Caulfield, L. du Croo de Jongh, C. J. Kepert, S. J. Blundell, W. Hayes, M. Kurmoo, and P. Day, J. Phys.: Condens. Matter 8, 6005 (1996).
- (35) J. Wosnitza, Curr. Opin. Solid State Mater. Sci. 5, 131 (2001).
- (36) O. Degtyareva, M. V. Magnitskaya, J. Kohanoff, G. Profeta, S. Scandolo, M. Hanfland, M. I. McMahon, E. Gregoryanz, Phys. Rev. Lett. 99, 155505 (2007).
- (37) R. Fleming, F. DiSalvo, R. Cava, and J. Waszczak, Phys. Rev. B 24, 2850 (1981).
- (38) G. H. Lander, E. S. Fisher, S. D. Bader, Adv. Phys. 43, 1 (1994).
- (39) S. Raymond, J. Bouchet, G. Lander, M. L. Tacon, G. Garbarino, M. Hoesch, J.-P. Rueff, M. Krisch, J. Lashley, R. Schulze, and R. Albers, Phys. Rev. Lett. 107, 136401 (2011).