MBM 12 and MBM 16 distances
Abstract
Among the multitude of intrinsic SDSS index vs. index diagrams the diagram is characterized by showing only minor variation for the M dwarfs. The reddening vector has a slope almost identical to the slope of the main sequence earlier than M2, meaning that dwarfs later than M2 are not contaminated by reddened dwarfs of earlier type. Chemical composition, stellar activity and evolution have only minor effects on the location of the M2M7 dwarfs in the diagram implying that reddening may be isolated in a rather unique way. From , and we may construct distance vs. diagrams. This purely photometric method is applied on SDSS DR8 data in the MBM 12 region. We derive individual stellar distances with a precision 2026. For extinctions in the the estimate is better than 0.2 mag for and between 0.3 and 0.4 for the remaining . The extinction discontinuities noticed in the distance vs. diagrams suggest that MBM 12 is at 160 pc and MBM 16 at a somewhat smaller distance 100 pc. The distance for which / = 3, where refers to -, may possibly be used as an indicator for the cloud distance. For MBM 12 and 16 these distance estimates equal 160 and 100 pc, respectively
keywords:
molecular clouds – interstellar extinction – distances : M dwarf stars.1 Introduction
MBM 12 is a high latitude molecular cloud and since it has exceeding 5 mag, Hearty, Neuhuser, Stelzer et al. (2000), it is classified as a dark cloud. And it contains more than a dozen PMS stars. An active high latitude cloud requires possibly other mechanisms for star formation than dark clouds close to the galactic plane. Estimating parameters essential for initiating star formation, such as the cloud mass and density, depends on the cloud distance. We include MBM 16, a high latitude neighboring tranclucent cloud, only ten degrees removed from MBM 12, and showing no star formation. For a recent review of high latitude molecular clouds McGehee (2008) may be consulted.
The MBM 12 distance has a long long history and a corresponding, large variation. Shortly after its inclusion in the MBM catalog Hobbs, Blitz, and Magnani (1986) suggested 65 pc as derived from NaI spectroscopy and spectroscopic distances of a small sample of stars. Hobbs et al. (1988) suggest the same distance for MBM 16 about ten degrees away from MBM 12. The estimate for MBM 12 was altered by Hearty, Neuhuser, Stelzer et al. (2000), after Hipparcos parallaxes became available, to the range from 58 to 90 pc. Again lower and upper estimates were based on the absence/presence of NaI absorbtion. Luhman (2001) and Andersson et al. (2002) have used more indirect methods and prefer a cloud distance of 275 pc and 36030 pc, respectively. Both of these papers do, however, detect dust, thought not to be associated to MBM 12, at 65, 140 pc and at 80 pc respectively. An intermediary distance, 325 pc, is proposed by Straiys et al. (2002) from Vilnius photometry of dwarfs and giants brighter than V12 mag. That work also indicates the possible presence of a small hump, 0.4 mag, of extinction at 140160 pc.
Accurate and homogenous SDSS photometry has proven useful for deriving distances and extinction estimates for stars in the M dwarf range within 1 kpc (e.g. Jones, West and Foster, 2011). Our own interest in using photometry for 3-D mapping of the ISM was inspired by the stellar models by Girardi et al. (2004). These models convinced us that the position of the locus was influenced very little by variation in [M/H], and by ages varying from a few million years to the age of the Milky Way. The latter invariance was perhaps to be expected. Furthermore, and most important, the reddening ratio has a value, Girardi et al. (2004), that approximates the slope of the main sequence, in the diagram, for dwarfs earlier than M1. A consequence is, that reddening seems to be the only parameter that shifts observed , pairs away from the intrinsic locus. Another fact that makes the photometry so useful for M dwarfs is the good relation, 0.4 mag, between and the absolute magnitude : a range of 2 mag in corresponds to a range of 9 mag in . This is taken from Table 2 of West et al. (2011) together with the equation for , Table 4 of Bochanski, Hawley, Covey et al. (2007) valid for the 0.62 2.82 range of . The absolute magnitude calibration have required precise distances for a represensative sample, Table 4.1, Bochanski (2008).
We apply the photometric parallax and investigate the variation of extinction with distance in a region with a radius 15∘ centered on the high latitude, dark cloud MBM 12. This region is known to contain several clouds with molecular gas, e.g. the extended translucent cloud MBM 16. The locations of these clouds are interesting because of their various state of activity and their position relative to the confinement of the local cavity.
2 M Dwarf Sample Selection from SDSS DR8
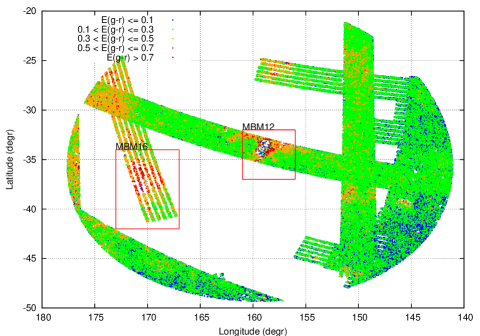
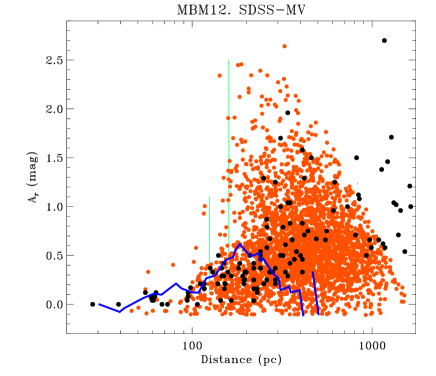
To establish a sample of M dwarfs we follow a selection procedure in line with Jones, West and Foster (2011). The candidate sample is drawn from the most recent SDSS data release, DR8, applied for a region, centered on the MBM 12 position with a 15∘ radius, as shown in Fig. 1. The coverage is incomplete but several MBMs are partially scanned. Using the DR8 CasJobs tool we queried for STAR objects with CLEAN photometry for , , and , respectively, and fulfilling the selection criteria: 0.06 mag, 0.53 mag and 0.3 mag. The cuts in and contribute to minimize the contamination by (partially) eliminating quasars, giants and M flare stars. Aspects of the sample are shown in Fig. 2. Notice how the reddening of the main sequence stars earlier than M1 does not contaminate the location of reddened M dwarfs.

3 Extinction and Distance Estimation. Uncertainty
The linchpin for our work is the diagram, which is characterized by showing only minor variation for M dwarfs. The reddening vector has a slope almost identical to the slope of the main sequence earlier than M1-M2 meaning that reddened dwarfs earlier than this limit do not contaminate the location of reddened dwarfs later than M2. See Fig. 2 where the M dwarf standard locus starts at M0. As judged from the evolutionary models by Girardi et al. (2004) the chemical composition and evolution have minor effects on the location of the M dwarfs in the diagram. According to Bochanski et al. (2007) colors are likely to depend on metallicity but no clear trends are apparent for and . M dwarf activity in the form of flares mostly effects the blue part of the spectrum, i.e. the and the bands implying that is affected but not . According to West et al. (2008) a flare will typically change to values below 0.05 mag. As Fig. 2 shows the range we consider is far redder than this and 1.4 or 4 is required to shift a flaring star into the color range we use. For the variation in with magnectic activity and metallicity see, however, the discussion by Bochanski, Hawley, West (2011). A more serious contamination can be caused by unresolved binarity and depends on the components mass ratio. With a mass ratio of one the colors do not change but the observed magnitude is decreased by 0.75 mag. The estimated is not influenced since the and colors are left unchanged. For an individual target, binarity introduces a distance uncertainty 35 with a unit mass ratio. The estimated extinction is accordingly not altered but its location is shifted to a larger distance. A recent paper, Clark, Blake and Knapp (2012) has estimated the fraction of close, a0.4 AU, M dwarf binaries to 34. Dwarfs later than M6 has a frequency of 204, Allen (2007) and the overall binary frequency among M dwarfs is 4220, Fischer and Marcy (1992).
In Fig. 2 is shown three aspects of the diagram for the MBM 12 region sample. The black points are a selection the region stars. The green symbols are M dwarfs in the MBM 12 area. Blue symbols signify M dwarfs in the MBM 16 area. True color excesses are positive but due to observational errors in and unreddened and little reddened stars are sometimes shifted to the blue of the locus. In Fig. 2 we have indicated the one sigma confinement based on the maximum error 0.060 mag in . This confinement is corroborated by the scatter around the standard locus of M dwarfs observed at the virtually unreddened North Galactic Pole.
3.1 Estimate of the Extinction
As the sample of nearby M dwarfs, forming the basis for the standard locus, shows there is a scatter around the standard locus even for vitually unreddened stars. But collapsing the main sequence to a sharp relation has often proven useful. In a previous section we have argued that a shift from the locus may mainly depend on reddening. The intrinsic location of a dwarf is on the locus and is determined by translating the observed position along a reddening vector. The color shifts and are accordingly assumed to equal and respectively.
=0.694 is adopted from Girardi et al. (2004) calculated with = 0.5 mag, =3.1, =3500 K, =4.5 and =0. Not ideal but rather close to the M range. We have =2.875, also adopted from Girardi et al. op. cit. For the relation is =4.142. The ratio between the two coefficients is 1.441 so other things being equal is preferred due to a more favorable error progression.
3.2 Estimated Distance
Having estimated and observed only is missing for the photometric parallax. We rely on the calibration of in terms of which is preferred to due to a better error progression. The calibration of for M dwarfs is as mentioned adopted from Bochanski, Hawley, Covey et al. (2007).
The distance estimate is derived from the usual formula:
| (1) |
where all parameters are known together with their uncertainties.
3.3 Uncertainties on Extinction and Distance
Each entry in the extraction from SDSS DR8 contains errors on all magnitudes but we have preselected stars with 0.060 mag. We may estimate the total uncertainty from the combination of observational errors and errors introduced from the calibrations.
If represents either the full set of equations used to estimate or the formal error of follows from the progression formula:
| (2) |
For each star we compute and implying that derivatives must be calculated and errors of the independent parameters also must be known. The errors and are derived from piecemeal linear approximations to the intrinsic locus, taking into account errors in slope and intersection, together with the observational errors in and . is calculated from the calibration equation considering our individual, estimated errors .
The resulting uncertainties are in the range 2026 for the distances and for about 2/3 has in the range from 0.04 to 0.20 mag and about 1/3 between 0.30 and 0.40. The reason for this double peaked distribution is the kink in the intrinsic locus noticed in Fig. 2
4 Results
SDSS DR8 provides a substantial amount of M dwarf data for the MBM 12 region and the distance and accuracies are adequate to study the distance - extinction variation.
4.1 MBM 12 Distance Estimate
The distance to MBM 12 is particularly interesting because the cloud is a specimen of a rare variety, high latitude, dark cloud ( have been measured) that even shows star formation activity.
4.1.1 Distance from appearence of substantial extinction
By substantial extinction we mean an extinction that appears in a discontinuity and is substantially larger than the extinction at smaller distances and that several stars do show such an extinction.
From the luminosity calibration of and the color excess from in Fig. 2 we construct a distance vs. diagram for the MBM 12 area, as shown by the red dots in Fig. 3. We have used a logarithmic distance scale to emphasize the smaller distances. Apparently there is a rise in beyond 0.5 mag around 100 pc. We have shown a vertical line at 125 pc. There are some MBM 12 stars with extinction 1 mag at 125 pc but the dominating increase takes place at 162 pc indicated by a vertical line too. Since this distance is somewhat smaller than the presently preferred range discussed in the introduction we have compared to the distance extinction variation derived from the Hipparcos Catalog. We have extracted Hipparcos stars in the MBM 12 area, same and limits as used for the SDSS extraction. Parallaxes are from the second derivation by van Leeuwen (2007) and extinctions are from , photometry and spectral classification, see e.g. Knude and Høg (1998). The extinction is averaged in 30 pc intervals and is given as the blue solid curve in Fig. 3. The Hipparcos curve is seen to follow the upper envelope of the MBM 12 extinction rather well. Since the Hipparcos sample has a rather bright limiting magnitude, Perryman, Lindegren, Kowalevsky et al. (1995), we can only expect to see smaller extinctions. If we accept the distance of the onset of extinctions beyond, say one magnitude, which is 3above 0, as the cloud distance, MBM 12 is at 160 pc.
4.1.2 Alternative distance derivation for MBM 12
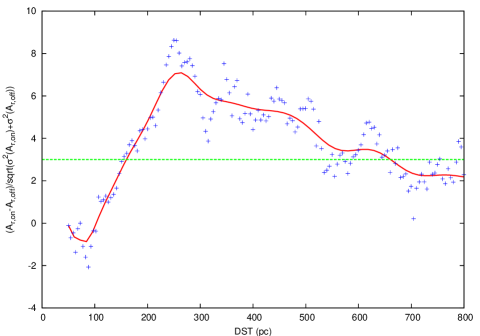
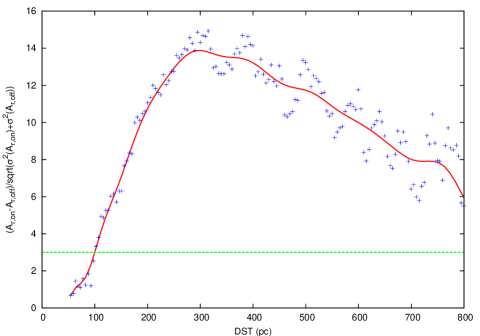
The scans in Fig. 1 cover several clouds revealed by their color excesses but also sight lines with less dust. One may expect that for a small distance bin at a given distance the average extinctions in a cloud direction and outside the clouds differ. For distances less than the cloud distance, but in the direction of a cloud, the two averages will be more similar. As Fig. 3 shows there is a substantial scatter of at almost any distance. A scatter caused by real variation in the presence of dust causing the extinction and the observational errors, . If and designate the average extinctions on and off a cloud for identical distance bins we propose that =- will measure the presence of a cloud at a given distance where the difference is sufficiently large. We use as a measure of the significance of and define the cloud distance as the distance when / equals three.
We have done this for the MBM 12 area and compared to the region outside the MBM 12 area as shown in Fig. 4. The individual points are not independent: bin size is 30 pc with a steplength of only 10 pc. The horizontal line is at three and intersects the curve at 160 pc. Which we accept as the distance to MBM 12.
4.2 The distance to MBM 16
Another cloud in the MBM 12 region is MBM 16 which is of different type than MBM 12. MBM 16 is translucent whereas MBM 12 is a dark cloud. The two types are distinguished by their optical extinction: a dark cloud has mag whereas a translucent cloud is less opague with in the range from 1 to 5, van Dieshoeck and Black (1988). MBM 16 has been studied by Magnani, Chastain, Kim et al. (2003) in order to understand the origin of turbulence and the correlations between molecular gas and color excesses. For their investigation a distance of 100 pc was assumed, identical to the distance to the wall of Local Bubble as estimated by Cox and Reynolds (1987). In their probing of the local low density cavity Lallement, Welsh, Vergely et al. (2003) suggest the presence of a region with a high density at a distance closer than 100 pc in the direction of MBM 16.
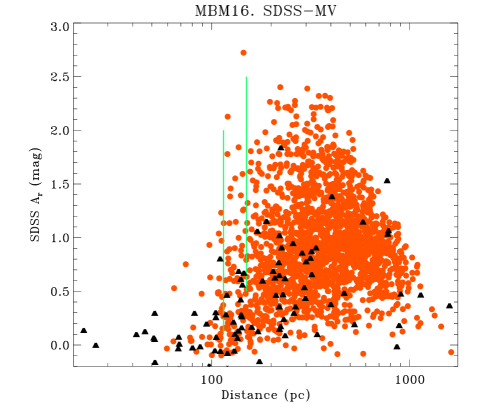
In Fig. 5 is shown SDSS for what is available inside the area shown in Fig. 1. Hipparcos 2 results from the same area is overplotted and two vertical lines at 115 and 160 pc respectively. From the occurence of the first dust, ranging from 0.5 to 2 mag, we would suggest 115 pc. Smaller than the MBM 12 distance of 160 pc. The data from Hipparcos 2 corroborates this to some degree, but only by two stars with in the range from 0.5 to 1 mag.
The /=3 criterion indicates a distance 100 pc for MBM 16 as shown in Fig. 6.
5 Conclusions
We have applied two different methods, which perhaps could be termed qualitative and quantitative, respectively, for estimating the distance to the two high latitude clouds MBM 12 and 16: the distance at which substantial extinction is first measured and the distance where the ratio / equals three. In the case of MBM 12 and 16 the two methods agree. Our suggested distances are 160 for MBM 12 and 100 pc for MBM 16. The former does not agree with the current values from the literature whereas the latter does, almost exactly. That either method works depend on the nice behaviour of the M2M7 dwarfs in the diagram.
The difference of the MBM 12 and 16 distances has been narrowed from 350-100 pc to 160-100 pc. The possibility that MBM 12 is outside the confinement of the local bubble and MBM 16 is on or inside still exist. Tempting to suggest that their dark/translucent status is a consequence of their different interstellar environment?
The / = 3 criterion may possibly be expanded to a generalized method for locating nearby molecular clouds where photometry is available and maps, 2D and 3D, could be produced with a larger number of stars than used in the spectroscopic study by Jones, West and Foster (2011).
Acknowledgments
Our investingation of the Milky Way ISM is financily supported by FNU, grant 09-060601, and Fonden af 29. December 1967.
Funding for the Sloan Digital Sky Survey (SDSS) and SDSS-II has been provided by the Alfred P. Sloan Foundation, and the Participating Institutions.
References
- Allen (2007) Allen, P.R., 2007, 668, 492
- Andersson et al. (2002) Andersson, B.-G., Idzi, R., Uomoto, Alan, Wannier, P. G., Chen, B., Jorgensen, A. M., 2002, , 124, 2164
- Bochanski (2008) Bochanski, J.J., 2008, Doctoral Dissertation, University of Wasington
- Bochanski et al. (2007) Bochanski, J.J., West, A.A., Hawley, S.L., Covey, K.R. , 2007, 133, 531
- Bochanski, Hawley, Covey et al. (2007) Bochanski, J.J., Hawley, S.L., Covey, K.R. et al., 2010, 139, 2679
- Bochanski, Hawley, West (2011) Bochanski, J.J., Hawley, S.L., West, A.A., 2011, 141, 98
- Clark, Blake and Knapp (2012) Clark, D.A., Blake, C.H., Knapp, G.R., 2012 744, 119
- Cox and Reynolds (1987) Cox, D.P. and Reynolds, R.J. 1987 ARAA 25, 203
- Fischer and Marcy (1992) Fischer, D.A. and Marcy, G.W. 1992 396, 178
- Girardi et al. (2004) Girardi, L., Grebel, E.K., Odenkirchen, M., Chiosi, C., 2004, 422, 205
- Hearty, Neuhuser, Stelzer et al. (2000) Hearty,T., Neuhuser, R., Stelzer, B. et al. , 2000, 353, 1044
- Hobbs, Blitz, and Magnani (1986) Hobbs, L.M., Blitz, L., Magnani, L., 1986, 306, 109
- Hobbs et al. (1988) Hobbs, L.M., Penprase, B.E., Welty, D.E., Blitz, L., Magnani, L., 1988, 327, 356
- Jones, West and Foster (2011) Jones D.O., West A.A., Foster J.B., 2011, 142, 44
- Knude and Høg (1998) Knude, J. and Høg, E. 1998 338, 897
- Koen and Eyer (2002) Koen, C., Eyer, L. 2002 331, 45
- Lallement, Welsh, Vergely et al. (2003) Lallement, R., Welsh, B.Y., Vergely,J.-L.,Crifo, F., Sfeir, D.. 2003, 411, 447
- Luhman (2001) Luhman K.I., 2001, ApJ, 560, 287
- Magnani, Chastain, Kim et al. (2003) Magnani, L., Chastain, R.J., Kim, H.C., Hartmann, D., Truong, A.T., Thaddeus, P. 2003, 586, 1111
- McGehee (2008) McGehee, P. M., 2008, Handbook of Star Forming Regions, VolumeII, The Southern Sky ASP Monograph Publications, 5, 813
- Perryman, Lindegren, Kowalevsky et al. (1995) Perryman, M.A.C., Lindegren, L., Kowalevsky,J. et al., 1995, 304, 69
- Straiys et al. (2002) Straiys V., ernis, A., Kazlauskas and Laugalys, V., 2002, Baltic Astronomy 11, 231
- West et al. (2008) West, A.A., Hawley, S.L., Bochanski, J.J., et al., 2008 135, 785
- West et al. (2011) West, A.A., Morgan, D.P., Bochanski J.J. et al., 2011, 141, 97
- van Dieshoeck and Black (1988) van Dieshoeck,E.F., John, J.B., 1988, 334, 771
- van Leeuwen (2007) van Leeuwen, F., 2007, 474, 653