/$0.00 © \lognumberxxxxxxx \pubitemidentS \loginfoManuscript received.
Comparison of EPOS and QGSJET-II in EAS Simulation using CORSIKA
Abstract
In this work we compare the predictions of two representative hadronic interaction models,
EPOS 1.99, and QGSJET II-03 with several extensive air showers (EAS) parameters for
proton and iron primaries in the energy range - using CORSIKA-6990.
The EAS parameters viz. depth of shower maximum, shower size, size of muon shower,
muon number distribution, electron number distribution,
size of hadron shower, hadron energy sum, electron muon correlations,
and, hadron energy spectra are studied in this paper.
PACS: 96.50.sd, 13.85.Tp
keywords:
hadronic interaction models, EAS,1 Introduction
High-energy cosmic rays enter into the Earth’s atmosphere resulting cascades of secondary particles known as extensive air showers(EAS). Information regarding the shower generating primary particle have to be derived from the registered information of secondary particles at observation level. The interpretation of properties of primary radiation derived from air shower measurements depends on the understanding of the complex processes of high-energy interactions during the development of air showers [1]. From the number and distribution of various ground particles of the EAS, the reconstruction of energy and the mass of the primary particle can be done. But to relate the observables to primary energy and mass, more reliable algorithms and detailed air shower simulations are needed. By comparing the predictions from simulation with measurements one can draw conclusions on the primary mass composition of the arriving particles.
Again predictions from simulations suffer from systematic uncertainties mainly due to statistical fluctuations involved in large-scale experiments and due to modeling of HE interactions. While the electro-weak interaction processes are reasonably well understood; above the attained energy by the man-made accelerator, modeling of hadronic multi-particle production is subject to large theoretical uncertainties [2]. Estimation of these uncertainties are further difficult task.
Different hadronic interaction models predict different lateral shapes and different number of particles at observation level. Hence, it is possible to test and compare the available interaction models by studying these EAS parameters. Moreover, some of these parameters like the muon content, depth of shower maximum , the expected lateral shape etc. also depend on the mass of primary cosmic rays. Heavier primaries lead, on average, to a flatter distribution and lower value of and more muons.
2 EPOS 1.99 and QGSJET II-03
CORSIKA [3, 4] is a detailed Monte Carlo program to simulate the 4-Dimensional evolution
of EAS in the atmosphere initiated by hadron, photon or any other particle. In CORSIKA-6990 [5], there are
seven HE models, namely DPMJET 2.55 [6], EPOS 1.99 [7, 8], neXus 3.97 [9],
QGSJET-01C [10], QGSJETII.3 [11, 12], SIBYLL 2.1 [13, 14], and, VENUS 4.12 [15],
from which we can choose one model at a time for EAS simulation.
To explain hadron-hadron/nucleus-nucleus collisions above the energy attainable by the man made accelerators, reliable and consistent hadronic interaction models are to be adopted. DPMJET, EPOS, QGSJET, and, SIBYLL are based on the Gribov’s Reggeon approach [16, 17], of Pomeron exchange in multiple scattering. The Pomeron corresponds to microscopic partons (quarks & gluons) cascades, can be classified into “soft” , “semi-hard” , and “hard” Pomerons. Soft non-perturbative interactions involving large impact parameters and slow energy rise are described as “soft” Pomeron exchanges, and are dominant at relatively low energy domain giving important contributions to total, inelastic, and diffractive cross sections. However, in the high energy regime “semi-hard” Pomeron exchange, and, “hard” Pomeron exchange describing hard interactions (with high energy rise) at large impact parameter, and at small impact parameters respectively are dominant.
2.1 QGSJET II-03
QGSJET [10] is an addition of Gribov’s Reggeon approach [16, 17] of hadronic and nuclear collisions to the Quark-Gluon String model of high energy interactions. It has been generalized to treat nucleus-nucleus interactions and “semi-hard” processes using the so-called “semi-hard” Pomeron approach. [11, 12, 18]. The “semi-hard” processes can be described by enhanced Pomeron diagrams and proved to be of extreme importance for a correct treatment of very high energy hadronic interactions [19]. QGSJET scheme is based on the assumption that individual Pomeron exchanges occur independent of each other, which is not true at high energy regime. At high energies parton cascades strongly overlap and interact with each other. These effects can be described as Pomeron-Pomeron interactions. This non-linear interaction effects are incorporated into the QGSJET-II-3 model, which is based on the assumption that corresponding effects are dominated by “soft” partonic processes. Re summation of essential enhanced contributions corresponding to particular final states of the interaction from uncut diagrams (representing the elastic scattering), and from various unitarity cuts of enhanced Pomeron diagrams for all orders, yields the final state. QGSJET II-03 is based on the obtained solutions, explicitly treating the corresponding effects in individual hadronic (nuclear) collisions [12, 19].
2.2 EPOS 1.99
EPOS [7] is a newly developed model emerging from VENUS [15] and neXus models [9]. EPOS is a parton model, with many binary parton-parton interactions, each one creating a parton ladder. EPOS is a quantum mechanical model of multiple scattering approach based on partons and strings. Both the process of the particle production, and the process of cross section calculations are consistent with the conservation of energy in EPOS. However for other models energy conservation is not considered for cross section calculations [20]. In EPOS 1.99 reduction of the proton-nucleus cross section is done for better correlation between the number of muons and the number of electrons at ground based air shower measurement [21, 22].
2.3 FLUKA 2011
In CORSIKA apart from seven high energy interaction models there are three low energy models, namely GHEISHA [23], UrQMD [24], and FLUKA [25]. The Fluka hadron-nucleon interaction models are based on resonance production and decay below a few , and on the Dual Parton model above. Two models are used also in hadron-nucleus interactions [26, 27].
2.4 Moun Number
Muons are produced mainly by decay of charged pions and kaons in a wide energy range. Usually they are not produced directly on the shower axis. Multiple Coulomb scattering occurred in the atmosphere and in the shielding of the detector may change the initial direction of the muon. It is known that the reconstruction of the longitudinal development of the muon component provides the information similar to that obtained with the fluorescence technique, but in the energy range above that accessible by the detection of fluorescence light [28]. Thus muon component of EAS provides a powerful key for primary mass measurement and as well as provides information regarding hadronic interactions. In some experiment like KASCADE, truncated muon size is calculated by integrating muons between 40 and 200. Instead of total number of muons, truncated muon size is considered for EAS study [29]. The range of muon truncation is from 140-360 in KASCADE Grande.
2.5 Depth of Shower max
The depth of shower maximum contains the information about the mass of the primary CR initiating the shower as well as about the properties of hadronic interactions involved in the process of cascade evolution. The average value depends on the primary energy E and on the number of nucleons A of the primary as given in the Eq.1,
= ( E - A ) + (1)
where and depend on the the details of hadronic interactions so far as a fixed primary is considered. Their values are very sensitive to changes in cross-section, multiplicity and elasticity [30]. Eq.1 can be derived from the simple generalized Heitler model of cascade formation due to hadronic primaries, but it is in good agreement with the description of the evolution predicted by hadronic models currently in use. Eq.1 can be expressed as,
= ( E - A ) + (2)
where is known as elongation rate and is the depth of first interaction [31]. Another sensitive parameter is , expressing quantitatively the shower to shower fluctuations of . It depends mainly on the cross section and less strongly on the elasticity. This makes fluctuations in , a good parameter to study hadronic cross sections at ultra-high energies.[30]
3 Simulation
The shower simulations are performed using CORSIKA-6990. Hadronic interactions at low energies(E 80 ) are modelled using the FLUKA-2011 code. High Energy interactions are treated with EPOS 1.99 and QGSJET II-3. Vertical showers initiated by primary protons and iron nuclei are simulated. Observation level is taken at the sea level. US standard atmosphere and default magnetic field in CORSIKA are taken. 1000 showers are simulated each for three primary energies , , and , two primary masses(p & Fe) and for two HE models EPOS 1.99 and QGSJET II-3. All together 12,000 showers are generated.
| Model | Slope of | Intercept | ||
|---|---|---|---|---|
| & Primary | ||||
| 58.3690 | 1.64891 | -303.488 | 29.7108 | |
| 47.5875 | 0.24876 | -125.219 | 4.48227 | |
| 62.9539 | 1.55497 | -491.491 | 28.0169 | |
| 55.2977 | 0.23593 | -354.504 | 4.25079 | |
| Energy/Model | Proton Primary | Iron Primary | ||
|---|---|---|---|---|
| 5.33582 | 0.09227 | 5.45870 | 0.04113 | |
| 5.42664 | 0.10664 | 5.52427 | 0.04210 | |
| 6.26616 | 0.09035 | 6.38253 | 0.04637 | |
| 6.37158 | 0.09563 | 6.47433 | 0.04434 | |
| 7.21209 | 0.08441 | 7.31510 | 0.05116 | |
| 7.31632 | 0.09665 | 7.41770 | 0.04526 | |
4 Results
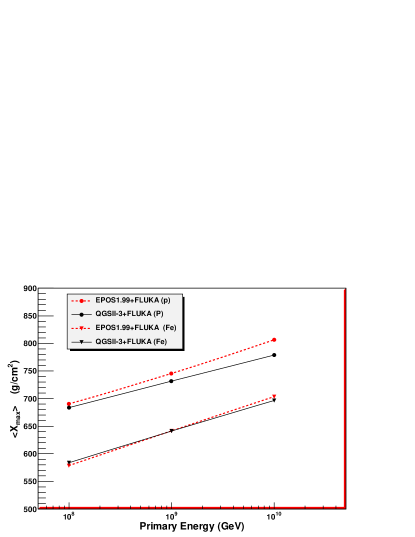
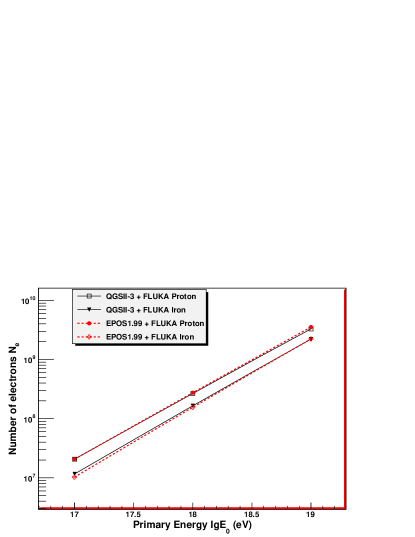
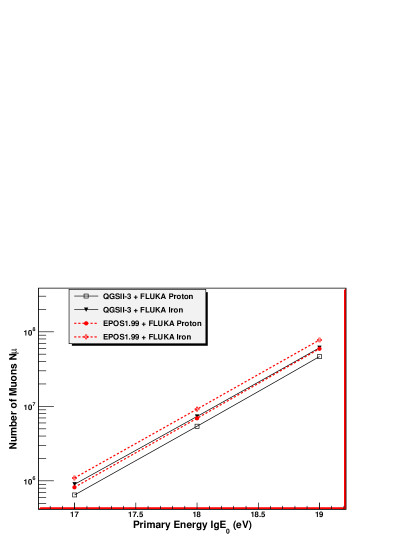
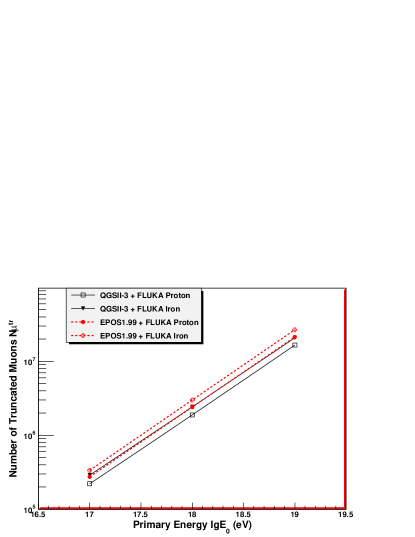
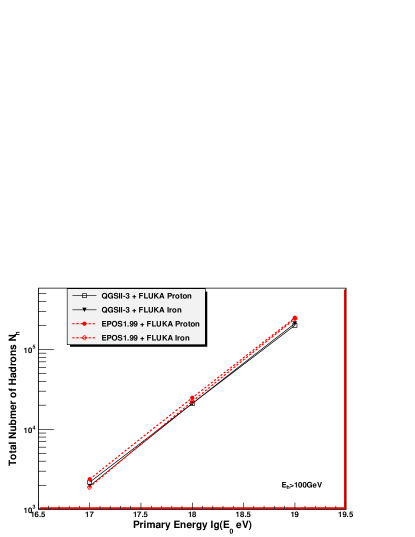
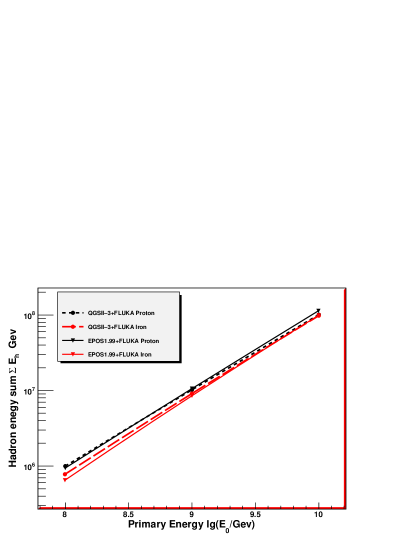
The average of Depth of maximum for the two models are plotted as function of energy in Figures 1. It is seen that heavier primary produces shower maximum at lower depth compared with lighter primary as expected. The average total number of electrons(), muons(), truncated muons(), hadrons (), and sum of energies of all the hadrons() registered at the ground level for the interaction models EPOS 1.99 and QGSJET II-03 are plotted as a function of energy in Figures 2, 3, 4, 5, and 6 respectively.
It is seen that, both models yield a linear dependence of these components with energy in Log-Log scale.
4.1 Dependence of with primary Energy
The value of and also the slope of the curve for proton primary for EPOS 1.99 is slightly higher than that of QGSJET II-03. Again, for iron primary also the slope of the curve has higher value for EPOS 1.99, while the values of are nearly equal for both the models.
The fitted values of the slope and intercept are given in the Table 1.
| Energy/Model | Proton Primary | Iron Primary | ||
|---|---|---|---|---|
| 7.28989 | 0.14648 | 7.05567 | 0.08888 | |
| 7.27924 | 0.15111 | 6.99535 | 0.09171 | |
| 8.40937 | 0.11724 | 8.21039 | 0.07825 | |
| 8.42408 | 0.11274 | 8.18449 | 0.07497 | |
| 9.50743 | 0.09597 | 9.34173 | 0.06344 | |
| 9.54035 | 0.08953 | 9.34330 | 0.06105 | |
4.2 Primary Energy Correlations
From Figures 2 through 6, it is seen that, there is no significant differences in the electron shower size and sum of hadron energy for the two models considered in the chosen primary energies for proton and iron primaries. However for muons (Fig. 3, 4) differences between the predictions of the two models are significant. The number of muons is larger for EPOS1.99 model as compared to QGSJET II-03 for both the primaries. From the figure 3, it is seen that there is very little overlap in the region bounded by p & Fe primaries for two models considered. However, for truncated muons (in the range 40-200) there is no overlap beyond eV (Figure 4). For hadrons, total number for both proton & iron primaries are found to be significantly more for EPOS than that for QGSJET II-3 (Figure 5). However, considering the sum total of energies of all the hadrons (), there is no significant difference between the two models (Figure 6).
4.3 Distribution of truncated muon numbers and electron numbers
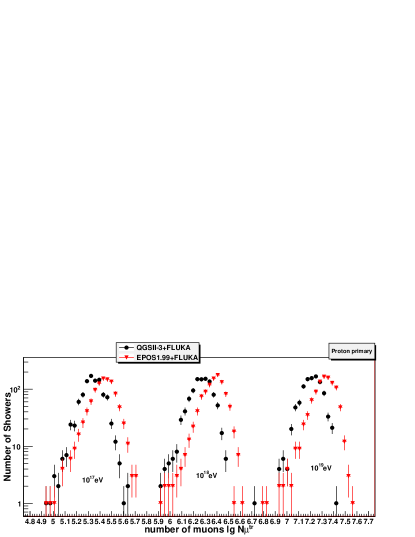
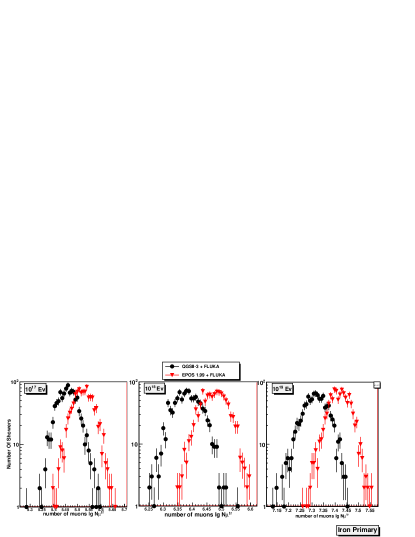
Distributions of truncated muon numbers for proton and iron primaries are plotted in Figure 7 and 8. It is seen that EPOS1.99 yields higher value of than QGSJET II-03. The mean & s.d. of these distributions are tabulated in Table 2, and significance test done (A.3).
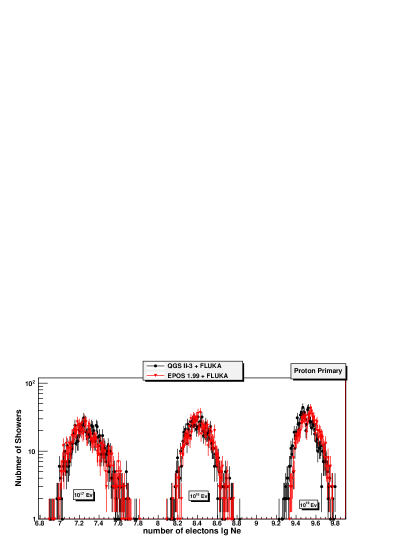
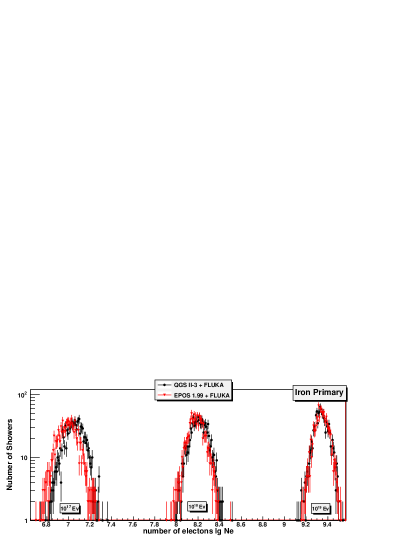
Distributions of electron numbers for proton and iron primaries are plotted in Figure 9 and 10. It is seen that EPOS1.99 produces slightly less numbers of electrons for energy eV for iron primary, but at eV, EPOS1.99 produces slightly more electrons as tabulated in Table 3, and significance test done(A.3).
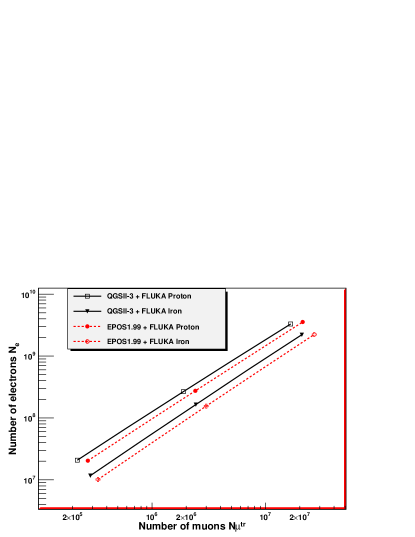
4.4 Electron to muon correlation
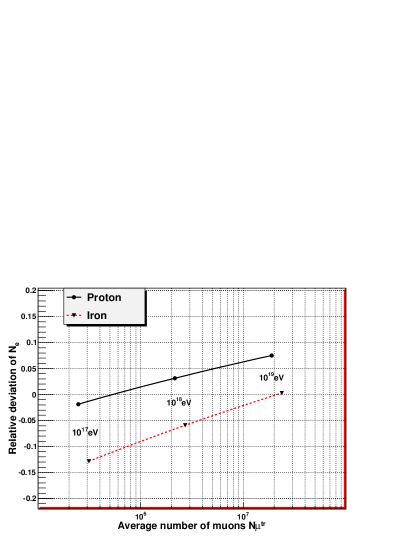
The average number of electrons as a function of the number of truncated muons are plotted in figure 11 for the two models. Slopes of all the curves are almost equal. To emphasize the differences between the model predictions, relative deviation in the model prediction EPOS1.99 with respect to the QGSJET II-3 prediction, is plotted against the mean of and in Figure 12. It is seen that for proton primary, EPOS1.99 predicts slightly less (about 2%) electrons for proton-induced showers, slightly more (about 3%) electrons for and about 8% more electrons for primary energy. But for iron primary at , , and, , EPOS 1.99 yields about 12% lesser, about 6% lesser and nearly equal ( difference is less than 1%) numbers of electrons as compared with QGSJET II-3 predictions.
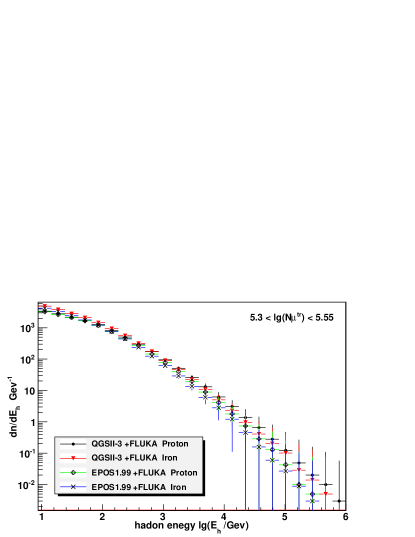
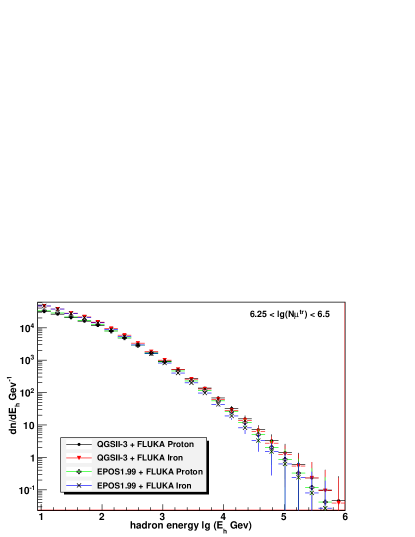
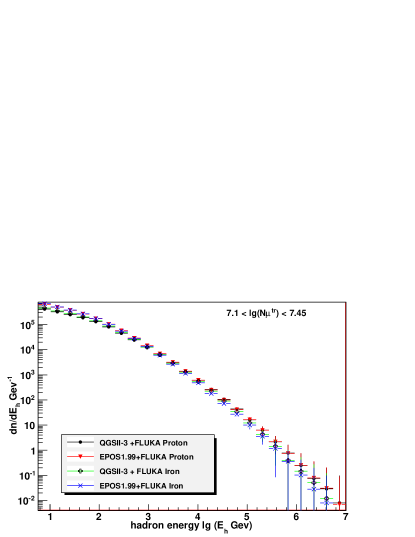
4.5 Variation in hadron component
Total average number hadrons with energy , for both primary masses & at all the three energies show significant difference between the two models (A.4). Energy spectrum of registered hadrons for , , and primary for both the models considered are displayed in the Figures 13, 14, and 15 respectively. There are apparently no distinguishable differences. All the four data plots are overlapped to each-other with their error-bars.
5 Summary
Although , shower size, hadron energy sum, hadron energy distribution shows no significant difference between the two HE models EPOS 1.99 (FLUKA) and QGSJET II-3 (FLUKA); muon number, hence electron to muon correlation shows incompatibility between them. EPOS 1.99 (FLUKA) predicts more muons than QGSJET II-3 (FLUKA) which is known widely since its inception [22]. This difference is explained as more (anti-)baryon production in EPOS leads to more muons in EAS [22]. More (anti-)baryon generations in forward region result larger fraction of energy in the hadronic cascades and lesser in the electromagnetic cascades (more muon to electron ratio in the EAS) for EPOS prediction. Also hadron() shower size prediction by EPOS 1.99 (FLUKA) yields higher values irrespective of primaries considered as compared to that by QGSJET II-3 (FLUKA). Modifications may be needed for one, or, both of the models considered herein by comparing the model predictions with experimental data.
6 Acknowledgements
The authors thankfully acknowledge UGC for computational infrastructure support under SAP and C.C. Thakuria acknowledges UGC for fellowship under FDP.
References
- [1] W.D. Apel et al., J. Phys. G.: Nucl. Part. Phys. 36 (2009) 035201, DOI:10.1088/0954-3899/36/3/035201
- [2] D. d’Enterria, R. Engel, T. Pierog, S. Ostapchenko, K. Werner, Astro. Part. Phys. 35, (2011), pp 98-113
- [3] J.N. Capdevielle et al., Report KfK 4998 (1992), Kernforschungszentrum Karlsruhe
- [4] D. Heck and J. Knapp, Report FZKA 6097 (1998), Forschungszentrum Karlsruhe; available from http://www-ik.fzk.de/~heck/publications/
-
[5]
D. Heck, J. Knapp, J.N. Capdevielle, G. Schatz, and
T. Thouw, Report FZKA 6019 (1998), Forschungszentrum
Karlsruhe; available from
http://www-ik.fzk.de/corsika/physics_description/corsika_phys.html - [6] J. Ranft, Phys. Rev. D51 (1995) 64; preprint hep-ph/9911213 and hep-ph/9911232 (1999)
- [7] K. Werner, F. M. Liu and T. Pierog, Phys. Rev. C 74 (2006) 044902
- [8] K. Werner, and T. Pierog, arXiv:0707.3330v1[astro-ph].
- [9] H.J. Drescher, M. Hladik, S. Ostapchenko, T. Pierog, and K. Werner, Phys. Rep. 350 (2001) 93 (preprint hep-ph/0007198 (2000))
- [10] N.N. Kalmykov, S.S. Ostapchenko, and A.I. Pavlov, Nucl. Phys. B (Proc. Suppl.) 52B (1997) 17
- [11] S.S. Ostapchenko, Nucl. Phys. B (Proc. Suppl.) 151 (2006) 143-147; Phys. Rev. D 74 (2006) 014026
- [12] S. Ostapchenko AIP Conf. Proc. 928 (2007) pp-118.
- [13] R.S. Fletcher, T.K. Gaisser, P. Lipari, and T. Stanev, Phys. Rev. D50 (1994) 5710; J. Engel, T.K. Gaisser, P. Lipari, and T. Stanev, Phys. Rev. D46 (1992) 5013
- [14] R. Engel, T.K. Gaisser, P. Lipari, and T. Stanev, Proc. Int. Cosmic Ray Conf., Salt Lake City (USA), 1 (1999) 415; E.-J. Ahn, R. Engel, T.K. Gaisser, P. Lipari, and T. Stanev, Phys. Rev. D80 (2009) 094003
- [15] K. Werner, Phys. Rep. 232 (1993) 87
- [16] V.N. Gribov, Sov. Phys. JETP 26 (1968) pp-414.
- [17] V.N. Gribov, Sov. Phys. JETP 29 (1969) pp-483.
- [18] S. Ostapchenko, Phys. Rev. D 83, 014018 (2011), (preprint arXiv:1010.1869v2)
- [19] S. Ostapchenko, (preprint arXiv:hep-ph/0412332)
- [20] M. Hladik, H. J. Drescher, S. Ostapchenko, T. Pierog, and K. Werner et al., Phys. Rev. Lett. 86, 3506 (2001), arXiv:hep-ph/0102194.
- [21] T. Pierog, Iu. Karpenko, S. Porteboeuf,and K. Werner, arXiv:1011.3748v1[astro-ph.HE]
- [22] K. Werner, and T. Pierog, Proc. 31st ICRC, LODZ 2009
- [23] H. Fesefeldt, Report PITHA-85/02 (1985), RWTH Aachen
- [24] S.A. Bass et al., Prog. Part. Nucl. Phys. 41 (1998) 225; M. Bleicher et al., J. Phys. G: Nucl. Part. Phys. 25 (1999) 1859; http://urqmd.org/
- [25] A. Fassò, A. Ferrari, S. Roesler, P.R. Sala, G. Battistoni, F. Cerutti, E. Gadioli, M.V. Garzelli, F. Ballarini, O.Ottolenghi, A. Empl and J. Ranft, The physics models of FLUKA: status and recent developments, Computing in High Energy and Nuclear Physics 2003 Conference (CHEP2003), La Jolla, CA (USA), March 24-28, 2003 (paper MOMT005); eConf C0303241 (2003); arXiv:hep-ph/0306267; http://www.fluka.org/references.html
- [26] A. Ferrari, P.R. Sala, A. Fass‘, and J. Ranft, “FLUKA: a multi-particle transport code”, CERN-2005-10 (2005),INFN/TC 05/11, SLAC-R-773.
- [27] G. Battistoni, S. Muraro, P.R. Sala, F. Cerutti, A. Ferrari, S. Roesler, A. Fass, J. Ranft, “The FLUKA code: Description and benchmarking”, Proceedings of the Hadronic Shower Simulation Workshop 2006, Fermilab 6–8 September 2006, M. Albrow, R. Raja eds., AIP Conference Proceeding 896, 31-49, (2007)
- [28] P. Doll et al. Nucl. Phys. B (Proc. Suppl.) 196 (2009) 305–308
- [29] T. Antoni et.al. Nucl. Instr and Meth A 513, pp 490-510 (2003)
- [30] Ralf Ulrich, Ralph Engel , and Michael Unger Phys. Rev. D. 83, 054026 (2011)
- [31] P.K.F. Grieder, Extensive Air Showers , DOI:10.1007/978-3-540-76941-5-20
Appendix A Statistical Test
A.1 Z-test results for distribution (Table 4)
The null hypothesis is
= There is no difference between the two samples (QGSJET II-03 data and EPOS1.99 data).
| Energy/Primary | |||
|---|---|---|---|
| 1.81 | Not | Significant | |
| 3.00 | Moderately | Significant | |
| 4.41 | Significant | ||
| 0.28 | Not | Significant | |
| 8.65 | Highly | Significant | |
| 3.83 | Moderately | Significant | |
A.2 Z-test results for and (Table 5)
The null hypothesis is
= There is no difference between the parameters for QGSJET II-03 and EPOS1.99 .
| Parameter | and | ||
|---|---|---|---|
| 6.466 | Significant | ||
| 4.981 | Significant | ||
| 5.933 | Significant | ||
| 4.834 | Significant | ||
It is seen that the parameters and describing (Equation 2), show significant differences for EPOS and QGSJET II, irrespective of the primaries.
A.3 Z-test results for and distributions (Table 6)
The null hypothesis is
= There is no difference between the two samples (QGSJET II-03 data and EPOS1.99 data).
| Energy/Primary | ||||
|---|---|---|---|---|
| 20.36 | Highly | 1.60 | Not | |
| Significant | Significant | |||
| 35.22 | Highly | 14.93 | Highly | |
| Significant | Significant | |||
| 25.34 | Highly | 2.86 | Moderately | |
| Significant | Significant | |||
| 45.25 | Highly | 7.56 | Significant | |
| Significant | ||||
| 25.68 | Highly | 7.93 | Significant | |
| Significant | ||||
| 47.50 | Highly | 0.56 | Not | |
| Significant | Significant | |||
Average truncated muon number shows highly significant difference between the two models. For the average electron number, for lower energy() high significance for iron primary, but no significant difference for proton primary is seen, whereas at higher energy(), no significance for iron, but significant differences for proton primary is observed ( Table 6).
A.4 Z-test results for total hadron number ( (Table 7)
The null hypothesis is = There is no difference between the two samples (QGSJET II-03 data and EPOS1.99 data).
| Energy/Primary | |||
|---|---|---|---|
| 4.07 | Significant | ||
| 21.09 | Highly | Significant | |
| 8.91 | Highly | Significant | |
| 6.52 | Highly | Significant | |
| 13.25 | Highly | Significant | |
| 15.59 | Highly | Significant | |