Stellar lifetime and ultraviolet properties of the old metal-rich
Galactic open cluster NGC 6791:
a pathway to understand
the UV upturn of elliptical galaxies11affiliation: Based on observations carried out at the Italian
Telescopio Nazionale Galileo, operated by INAF at the Roque de los Muchachos
Observatory (La Palma, Spain)
Abstract
The evolutionary properties of the old metal-rich Galactic open cluster NGC 6791 are assessed, based on deep photometry and 2Mass data. For 4739 stars in the cluster, bolometric luminosity and effective temperature have been derived from theoretical and color fitting. The derived H-R diagram has been matched with the Uvblue grid of synthetic stellar spectra to obtain the integrated SED of the system, together with a full set UV (Fanelli) and optical (Lick) narrow-band indices.
The total bolometric magnitude of NGC 6791 is , with a color . The cluster appears to be a fairly good proxy of standard elliptical galaxies, although with significantly bluer infrared colors, a shallower 4000 Å Balmer break, and a lower index. The confirmed presence of a dozen hot stars, along their EHB evolution, leads the cluster SED to consistently match the properties of the most active UV-upturn galaxies, with 1.7% of the total bolometric luminosity emitted shortward of 2500 Å.
The cluster Helium abundance results , while the Post-MS implied stellar lifetime from star number counts fairly agrees with the theoretical expectations from both the Padova and Basti stellar tracks. A Post-MS fuel consumption of 0.43 M⊙ is found for NGC 6791 stars, in close agreement with the estimated mass of cluster He-rich white dwarfs. Such a tight figure may lead to suspect that a fraction of the cluster stellar population does actually not reach the minimum mass required to effectively ignite He in the stellar core.
Subject headings:
galaxies: elliptical and lenticular, cD — galaxies: evolution — Galaxy: open clusters and associations: individual (NGC 6791) — stars: evolution — ultraviolet: galaxies1. Introduction
As a natural marker of the hot stellar component, the study of the ultraviolet (UV) properties of galaxies and smaller star clusters provides us with an important piece of information to more deeply constrain the overall evolutionary status of a stellar aggregate as a whole.
While the implied presence of O-B stars hotter than 30 000 - 40 000 K is a quite standard condition for any young and/or star-forming system, like in spiral and irregular galaxies (Code & Welch, 1982), things revealed to be much more puzzling when facing the UV-enhanced luminosity as sometimes observed in the spectral energy distribution (SED) of old quiescent elliptical galaxies. Although within a wide range of strength, the abrupt rise in the UV emission of ellipticals and spiral bulges shortward of 2000 Å, known since the 80’s as the “UV upturn” phenomenon (Code & Welch, 1979; Bertola et al., 1982), seems to characterize the stellar population in old metal-rich environments. This poses a crucial constrain to stellar evolution theory in order to settle this effect into a convenient theoretical framework.
Among the different UV sources one can run into in any old stellar population (see, e.g. Yi & Yoon, 2004, for an updated review), hot Post-AGB (PAGB) and extreme horizontal-branch (EHB) stars stand out as main contributors to short-wavelength emission. Depending on the core/envelope mass ratio (), evolution of low-mass () stars actually heads to the final white-dwarf (WD) stage either through a full completion of the AGB phase and the subsequent planetary-nebula event (hot-PAGB evolution, see e.g. Paczyński, 1970; Iben & Renzini, 1983), or by skipping partially or in toto any AGB evolution (Greggio & Renzini, 1990). EHB stars are the natural outcome in the latter case, being on their route toward the WD cooling sequence after completing the horizontal-branch (HB) evolution (Dorman et al., 1995; D’Cruz et al., 1996). In both cases, stellar structure is characterized by a shallow external envelope, which lets the hot H-burning shell to “emerge” close to the stellar surface thus moving stars toward the high-temperature region of the H-R diagram.
In the c-m diagrams of a few globular clusters– Cen (D’Cruz et al., 2000) and NGC 2808 (Harris, 1974; Castellani et al., 2006a) are good examples in this sense– EHB stars appear to clump at the hot-temperature edge of the HB being classified, from the spectroscopic point of view, as hot subdwarfs (sdB). Spectroscopy (Brown et al., 1997) and imaging (Brown et al., 2000) of resolved c-m diagrams for stellar populations in local galaxies, like M32, seem definitely to point to these stars as the main responsible for the UV upturn providing some (unknown) critical threshold in to be exceeded to trigger the phenomenon (e.g. Greggio & Renzini, 1990; Bressan et al., 1994; Buzzoni, 1995a, 2007; Dorman et al., 1995).
Although metallicity might be the leading parameter in the game, the exact physical mechanisms at work still lack any firm observational confirmation as photometry of evolved UV-bright stars in external galaxies still confine to the relevant case of M31 and its satellite system (e.g. Bertola et al., 1995; Brown et al., 1998, 2000), and no suitable spectroscopy for single stars is available to date. The study of old metal-rich open clusters in the Galaxy may provide important clues in this regard. Although over a much reduced mass scale, open clusters may prove, in fact, to be an effective proxy to constrain the nature of the again-emerging UV in elliptical galaxies and spiral bulges.
In this framework, NGC 6791 plays perhaps a central role being, with its M☉ (Kinman, 1965; Kaluzny & Udalski, 1992), among the most massive and populated open clusters in our Galaxy. Its old age, about 8 Gyr, has recently been confirmed by Chaboyer et al. (1999), Anthony-Twarog et al. (2007) and Grundahl et al. (2008), relying on CCD photometry, while extensive high-resolution spectroscopy of member stars (Peterson & Green, 1998; Carraro et al., 2006; Origlia et al., 2006; Gratton et al., 2006; Boesgaard et al., 2009) points to a supersolar metallicity (i.e. ). Located about 4 kpc away (Carraro et al., 1999, 2006; Carney et al., 2005) in an oscillating orbit, that periodically brings it closer to the bulge of the Milky Way (Bedin et al., 2006; Wu et al., 2009), NGC 6791 stands out as a sort of backyard “Rosetta Stone” to assess the UV emission of more distant ellipticals.
This match is even more reinforced by the truly peculiar hot-HB content of this cluster, with a sizeable fraction of sdB/O stars, as first detected by Kaluzny & Udalski (1992) and Kaluzny & Rucinski (1995). On the basis of ground and space-borne (UIT and HST) UV observations (Yong & Demarque, 2000; Liebert et al., 1994; Landsman et al., 1998), these hot sources have then been interpreted as EHB stars with -32 000 K. Some hints for the presence of a composite stellar population in NGC 6791 recently came from Twarog et al. (2011), who reported a significant color shift in the Main-sequence location along the cluster radius. This feature may lead to an age Gyr older in the core region compared to cluster periphery, although an alternative explanation in terms of reddening gradient may not be firmly excluded (Platais et al., 2011).
Facing the relevance of NGC 6791 as a potentially effective proxy of UV-upturn ellipticals, in this note we present the results of an application of population synthesis techniques to further explore the evolutionary lifetime of the cluster stellar population and the integrated UV properties of the system as a whole. For our task we take advantage of a new set of deep CCD photometry, resolving stars down to , complemented at bright luminosity by the 2Mass IR observations. This observing dataset is briefly described in Sec. 2, referring the reader to an accompanying paper (Buson et al. 2011, Paper II, in preparation) for more details. By calibrating the apparent color of our stars with a set of theoretical models we have been able, in Sec. 3, to convert the c-m diagram of the cluster into the H-R fundamental plane of bolometric luminosity and effective temperature. This allowed us to single out and study in fairly good detail the hot stellar component of the cluster, and lead to the integrated SED of the whole aggregate, by summing up the spectrophotometric contribution of each star (Sec. 4). By relying on the synthetic broad-band colors and narrow-band UV and optical spectrophotometric indices, we assessed in Sec. 5 the problem of how close does NGC 6791 resemble the case of UV-upturn elliptical galaxies. Finally, a careful match of the star number counts across the cluster H-R diagram and the theoretical prescriptions of the so-called “fuel consumption theorem” of Renzini & Buzzoni (1986) led us to derive, in Sec. 6, the implied stellar lifetime along the different evolutionary branches of the diagram, together with an estimate of the corresponding energetic constraints from the consumed nuclear fuel inside stars. A number of interesting implications on the distinctive evolutionary properties of the cluster are therefore discussed in this section, and further expanded in the final summary of our conclusions, in Sec. 7.

2. Observing database and cluster selection
A set of deep CCD imagery of NGC 6791 has been collected at the 3.6m Telescopio Nazionale Galileo (TNG) of La Palma (Spain) along the three nights of July 29-31, 2003. The cluster field has been sampled by stacking four (partially overlapping) quadrants on the sky taken with the LRS FOSC camera equipped with a 2048 2048 back-illuminated E2V CCD. This setup provided a platescale of px across a total field of (roughly pc across, at the cluster distance). Exposure time for the observations has been 1200 sec, while frames have been taken with 300 sec. A standard photometric reduction of the images has been carried out, relying on Landolt (1992) reference fields, and by matching a supplementary set of 16 cluster stars in common with the photoelectric observations of Montgomery et al. (1994).
Data have been reduced with the Iraf111Iraf is distributed by NOAO, which are operated by Aura under cooperative agreement with the NSF. packages Ccdred, Daophot, Allstar and Photcal using the point spread function (PSF) method (Stetson, 1987). This led to a photometric catalog with 7831 entries of stars down to mag with measured color. For reader’s better convenience, a detailed discussion of this database is deferred to Paper II, just focussing here to the application of the photometric catalog to our cluster spectral synthesis procedure.
For its low Galactic latitude NGC 6791 is heavily embedded into Galaxy disk. This is evident at first glance from the resulting c-m diagram of the sky region surrounding the cluster (see Fig. 1, and even more clearly Kaluzny & Rucinski, 1995). A comparison with synthetic c-m diagrams of the same region, as from the Girardi et al. (2005) Galactic model (see Paper II for details), makes clear that a major contamination along the cluster sightline comes from bright A-F stars belonging to the thick-disk stellar component, while a negligible contribution from stars of later spectral type has to be expected, especially as foreground interlopers. This provides us with a simple diagnostic scheme as one can imagine to (mostly) pick up the bona fide cluster stellar population by rejecting field A-F stars in a color strip (see, e.g. Johnson, 1966, for the relevant fiducial colors) and all “redder” (i.e. later type) objects fainter than the fiducial main sequence (MS) locus of the cluster, as sketched in Fig. 1.
With these magnitude/color cuts, we are eventually left with a total of 5202 stars in our catalog. After reddening correction, assuming a color excess or from Twarog et al. (2009) this bona fide star sample provides an integrated magnitude and color of .
Being especially addressed to the study of the hot stellar component in the cluster, our imagery is of course not well suited to match also the cool red giant stars. To a more accurate check of the resulting c-m diagram, in fact, most of these stars suffered from poor photometry as their exceedingly red colors often required some prudent extrapolation of our photometric solution. In addition, the reddest stars were sometimes barely detectable in the frames or conversely resulted partly saturated in . For this reason, the bright stellar sample in the cluster field (including basically all the RGB+AGB stars for ) have been directly assessed through the infrared observations of the 2Mass survey (Skrutskie et al., 2006).
A selection of all the 2Mass stellar candidates across our field with color (that is consistent with or redder than the cluster Turn Off point) provided 94 stars, of which 61 objects were also catched by our survey, although in a few cases (3 stars) as saturated objects. The remainig 33 objects were actually not comprised in our catalog being all bright stars sampling the reddest tail in the overall color distribution.
3. The fundamental parameters of cluster stars
In order to lead to a self-consistent spectral synthesis of the cluster stellar population, apparent magnitudes and colors of member stars have to be converted to the fundamental physical plane of the H-R diagram such as to safely derive for each star its intrinsic parameters (namely bolometric luminosity, effective temperature and surface gravity). An iterative algorithm has been set up in this regard, with the help of the Uvblue synthetic library of stellar spectra (Rodríguez-Merino et al., 2005), computed for and with the Castelli & Kurucz (2003) revised chemical opacities, as shown in Fig. 2.
To avoid spurious transformations in consequence of high color uncertainty of faint objects we restrained our analysis only to stars in our bona fide sample brighter than , namely about 3.5 mag below the Turn Off point. These are 4706 entries in total, from the catalog, of which 61 objects overlap the 2Mass sample. For each star we proceeded first by fixing a reference value for surface gravity, namely . With this value, and the (dereddened) color of the star we then entered the two panels of Fig. 2 deriving a guess value for and the -band bolometric correction, . With the help of , and once accounting for the reddening and distance modulus, the latter being as from Twarog et al. (2009), the apparent magnitude can eventually be converted to . At this point, a self-consistency check must hold as, by definition,
| (1) |
As the stellar radius is tied to through , then eq. (1) can easily be re-written in terms of stellar surface gravity as
| (2) |
where we assume in c.g.s. units and K for the Sun. Note that eq. (2) only weakly depends on the exact value of the stellar mass (). For example, even a factor of two uncertainty on would only reflect into a uncertainty, which is safely within the sampling step of the Uvblue model grid (i.e. dex). Considering the estimated age for NGC 6791 and the implied Turn Off mass, then we could conservatively set M⊙ with no relevant impact on our conclusions.
At this point, by entering eq. (2) with the guess values for and , we get back a refined (“predicted”) estimate for to be used for a new iteration, such as
| (3) |
The iterative procedure has been carried on for each entry of our bona fide catalog until the “predicted” matches, within dex, the previous guess value. Accordingly, this also left us with the final values for and . It could be verified that a solution is quickly achieved in a couple of iterations or so, providing the star locates into the sampled domain of Uvblue models. This has actually always be the case, except for the little bunch of WD stars easily recognized in the c-m diagram of Fig. 1 fainter than and with negative colors. Their gravity is far larger (-7) than the Uvblue domain so that they have forcedly to be approximated within the theoretical grid with models.
A different procedure has been applied, on the contrary, for the 94 stars included in the 2Mass sample. For them we relied on the accurate bolometric calibration by Buzzoni et al. (2010), who accounted for NGC 6791 red giants themselves in their analysis. According to the (dereddened) color, we obtain for our cluster the following transformation equations:222In addition to the luminosity and temperature estimates as from eq. (4), also a measure of surface gravity for these stars can be obtained, via eq. (3).
| (4) |
A comparison of the two calibration procedures, for our 58 2Mass stars with available and unsaturated color confirmed that effective temperature is derived within an internal accuracy of 6% (namely dex, in the sense “ - ”), while the bolometric magnitude scale is reproduced within a mag accuracy.
In total, bolometric luminosity and effective temperature have been secured for 4739 stars, whose 4645 entries come from the bona fide sample and 94 stars from the 2Mass database.333Note that for the 61 stars with available and photometry, the latter calibration was eventually retained for our analysis.
3.1. The cluster H-R diagram
The resulting H-R diagram from our iterative conversion of the vs. plot of Fig. 1 plus the bright 2Mass extension is displayed in Fig. 3. As a reference guideline, we superposed to the stellar distribution two isochrones from the Padova database (Bertelli et al., 2008), for and 8 Gyr and , closely matching the cluster metallicity. The fairly good agreement confirms the reliability of our transformation procedure. The Turn Off point appears to have an effective temperature K, consistent with a spectral type G5 (Johnson, 1966).
Just a glance to the figure makes evident one outstanding feature of NGC 6791 stellar distribution, with a marked deficiency of bright red giants, surmounting the luminosity level of the red HB clump. This scanty population of bright cool stars (assumed to include both the bright tail of RGB evolution and the full AGB phase), compared for instance with the HB population, is in fact an established feature of NGC 6791 (Kalirai et al., 2007), widely recognized also in other observing sets taken in different photometric bands (see, for instance, the c-m diagram of Montgomery et al., 1994; Kaluzny & Rucinski, 1995; Stetson et al., 2003; Platais et al., 2011). These arguments led Kalirai et al. (2007) to envisage a sort of physical link, essentially driven by enhanced stellar mass loss, between the peculiar RGB morphology of NGC 6791 and a prevailing presence of low-mass ( M⊙) He-rich WDs, a feature that might call for an anticipated completion of RGB evolution, missing in some cases even the canonical He-flash event.
Although within the large uncertainties due to the low statistics and the intervening effect of field contamination, we think that even a raw estimate of the HB vs. bright RGB+AGB relative number counts can offer an interesting alternative interpretation being the ratio strongly modulated by the Helium abundance of the cluster stellar population. As a well established result (Iben, 1968), in fact, stellar evolution theory tends to predict a quicker RGB evolution at bright luminosity with increasing Helium abundance. Consequently, a larger ratio has to be expected in Helium-rich stellar systems. As we will show in better detail in Sec. 7, this might actually be the case for NGC 6791.
3.2. The hot stellar component
The H-R diagram of Fig. 3 allows us a quite clean assessment of the hot stellar component in the cluster. This recognition is actually favored by the good sensitivity of the color to the temperature range of B stars, hotter than , as shown in Fig. 2. In particular, the HB morphology can be accurately traced by our calibration, although a few possible A-type member stars may have been missed according to our color selection, as explained in Sec. 2.
A straight comparison of our data can be performed in Fig. 3 with the theoretical ZAHB and the upper envelope tracing the end of the core He-burning stage, according to the Basti model database (Pietrinferni et al., 2007). A standard solar-scaled chemical composition has been assumed, as from Pietrinferni et al. (2004), with , together with the -enhanced case (Pietrinferni et al., 2006). For both model sets we singled out with tick solid lines in the figure the locus of M⊙ stars which, for this metallicity, identifies the EHB objects. At least six stars in our sample seem to match this constrain. They are all comprised in the list of UV-bright stars proposed by Kaluzny & Udalski (1992), with ID code B02, B03, B04, B05, B06, and B10 (see Paper II for a detailed discussion). Most of them have been spectroscopically characterized by Liebert et al. (1994) and Landsman et al. (1998) leading to an accurate temperature classification. As an important cross-check of our transformation procedure, we compared in Fig. 4 our temperature scale obtained from the color and the corresponding estimate by Liebert et al. (1994) from the spectral fit of the Balmer absorption lines with synthetic high-res spectra. The agreement is most than encouraging, with a relative scatter of % (at 1- level) in the inferred values of with the two methods.
A closer inspection of Fig. 3 reveals, however, that a few other stars (three new ones marked with letter “a”, “b”, and “c” in the plot plus the Kaluzny object B08) may still be viable hot-HB members owing to the photometric uncertainty, that somewhat scatter the point distribution in the diagram. Two more objects in this region (namely stars B01 and B07 in the Kaluzny & Udalski, 1992 original list) have been first claimed to be field stars by Liebert’s (1994) spectroscopy but they now seem to be re-admitted as definite cluster member, based on the astrometric analysis of Platais et al. (2011).444A further star, B10, is questioned as a field member by Platais et al. (2011), but see Paper II. These alleged cases warn, however, of the possible amount of contamination by field interlopers.
4. Cluster spectral synthesis
As a final, and possibly most instructive excercise, we could rely on the derived set of () fundamental parameters of our bona fide cluster sample to sum up the expected spectrophotometric contribution of each star such as to obtain the integrated SED of the cluster as a whole.
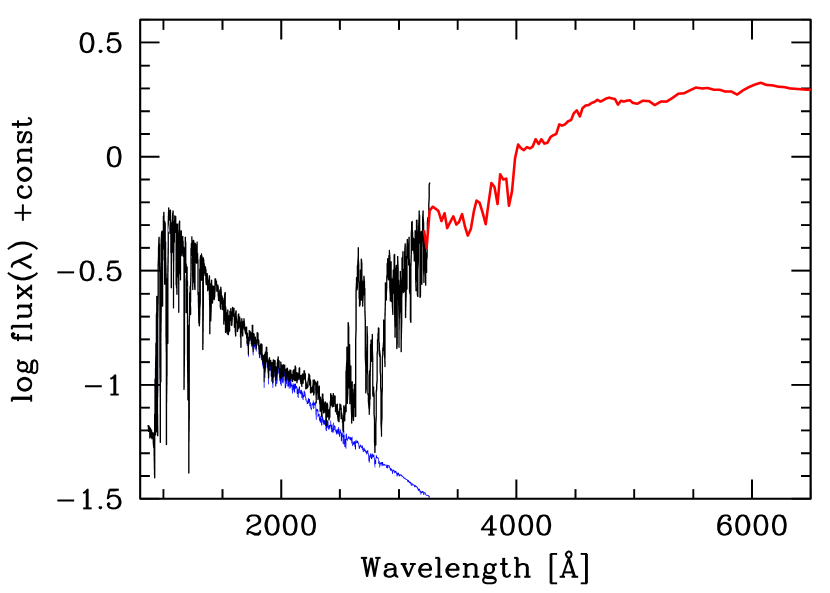
This task has been first carried out at low spectral resolution especially addressing the optical/infrared wavelength range. We made use, in this regard, of the original Atlas9 grid of Kurucz’ (1993) synthetic stellar spectra, sampling wavelength at 25-50 Å steps. In addition, to gain a better view of the UV distinctive properties of the cluster stellar population, we also carried out a high-resolution (2 Å FWHM) spectral synthesis between 870 and 3300 Å by matching stars with the appropriate Uvblue spectral grid. As a general procedure in both cases, each star has been located within the relevant grid according to its fundamental parameters, and the corresponding synthetic SED has been attached to it providing to normalize flux density such as to match the value of the bolometric luminosity. By summing up all the 4739 entries brighter than , we eventually led to an estimate of the integrated SED of NGC 6791. Our results are displayed in Fig. 5.
The synthetic SED opens to a number of interesting applications. Besides computing broad-band colors along the entire wavelength range, we could also estimate narrow-band spectrophotometric indices, either via direct integration on the synthetic spectrum, or by means of the so-called fitting-function procedure (Buzzoni et al., 1992; Worthey et al., 1994). As for first case, the Fanelli et al. (1990) mid-UV indices have been obtained, providing to degrade our spectral resolution to 6 Å (FWHM) to match the standard system definition (see also Chavez et al., 2007, for details). In addition, a relevant subset of Lick narrow-band indices has been obtained by relying on two independent schemes of index fitting functions, according to Buzzoni et al. (1992, 1994) and Worthey et al. (1994). We therefore dealt with the integrated strength of the H Balmer line, the popular Magnesium absorption features (Mg2 and Mgb indices), and three recognized Fei blends around 5000 Å (Fe5015, Fe5270, and Fe5335 indices). A direct assessment of the 4000 Å Balmer break has been possible, as well, through the two indices , originally defined in mag scale by Brodie & Hanes (1986) and Brodie & Huchra (1990), and , in terms of flux ratio as from Bruzual (1983) (see also Hamilton, 1985 and Gorgas et al., 1999).
For reader’s better convenience, the full set of broad-band synthetic colors for NGC 6791, including the Johnson/Cousins, Gunn, Galex photometric systems and Balmer-break indicators is summarized in Table 1. The narrow-band spectrophotometric indices are collected, instead, in Table 2.
| NGC 6791 | Ellipticals(b) | System ref. | |
| Mbol | –6.29 | — | |
| Bol–V | –0.69 | Johnson | |
| U–B | 0.60 | 0.56 | ” |
| B–V | 0.97 | 0.97 | ” |
| V–R | 0.86 | 0.86 | ” |
| V–I | 1.50 | 1.63 | ” |
| V–J | 2.08 | 2.35 | ” |
| V–H | 2.74 | 3.05 | ” |
| V–K | 2.90 | 3.28 | ” |
| V–Rc | 0.60 | 0.61 | Johnson/Cousins |
| V–Ic | 1.18 | 1.31 | ” |
| Mg | –5.38 | Gunn | |
| g–r | 0.45 | 0.40 | ” |
| g–i | 0.67 | 0.70 | ” |
| g–z | 0.79 | 0.96 | ” |
| 1550-V | 2.44 | Burstein et al. (1988) | |
| FUV-V | 5.22 | Galex(c) | |
| NUV-V | 5.01 | ” | |
| Balmer break indices: | |||
| 0.36 | Brodie & Hanes (1986) | ||
| 1.82 | 2.16 | Bruzual (1983)(d) | |
| (a)Reddening and distance modulus according to | |||
| Twarog et al. (2009); error bar for the UV colors from | |||
| Poissonian number fluctuation of bright hot stars of Fig. 3. | |||
| (b)Johnson colors are from Yoshii & Takahara (1988); | |||
| Cousins and Gunn colors from Fukugita et al. (1995); | |||
| (1550-V) and Galex average colors for the | |||
| four strongest UV-upturn galaxies in Fig. 7; | |||
| Balmer-break index from Hamilton (1985). | |||
| (c)Galex colors in AB magnitudes. | |||
| (d)Index value as a flux ratio. | |||
| Mid-UV indices:(a) | Lick indices: | ||||
|---|---|---|---|---|---|
| Feii 2332 | 0.123 | H | 1.92 | Å | |
| Feii 2402 | 0.145 | Fe5015 | 7.44 | Å | |
| BL 2538 | 0.374 | Mg2 | 0.246 | mag | |
| Fe ii 2609 | 1.328 | Mgb | 4.28 | Å | |
| BL 2720 | 0.410 | Fe5270 | 3.51 | Å | |
| BL 2740 | 0.523 | Fe5335 | 3.16 | Å | |
| Mg ii 2800 | 0.668 | ||||
| Mg i 2852 | 0.700 | ||||
| Mg wide | 0.343 | ||||
| Fe i 3000 | 0.286 | ||||
| BL 3096 | 0.170 | ||||
| 2110/2570 | 0.132 | ||||
| 2600-3000 | 0.969 | ||||
| 2609/2660 | 1.328 | ||||
| 2828/2921 | 0.778 | ||||
| S2850 | 1.277 | ||||
| S2850L | 1.447 | ||||
A first direct estimate of the integrated color of NGC 6791 has been attempted by Kinman (1965), who probed the central region of the cluster obtaining (after correction to our reddening scale) , in perfect agreement with our synthesis output. An isochrone approximation of the same data, and with the same reddening offset, led Xin & Deng (2005) to obtain , while Lata et al. (2002), from a coarser set of observations, propose for the cluster. Both these sources, however, tend to be biased against bluer objects. Based on the Kaluzny & Rucinski (1995) and Stetson et al. (2003) database we carried out different experiments by summing up stars in each catalog after field-stars cleaning according to the color selection scheme of Sec. 2. A more realistic figure, still adopting our color excess, can be envisaged for the integrated color in the range for Kaluzny & Rucinski (1995) and for Stetson et al. (2003).
According to the H-R transformation, the bolometric emission of the integrated SED of Fig. 5 amounts to , which implies a total luminosity of the sampled cluster population of
| (5) |
assuming from Portinari et al. (2004). According to our total -band magnitude , cluster luminosity results about a factor of two brighter than Kinman’s (1965) original output (once converting to our reddening scale and distance modulus), but one has to consider, in this regard, that we are sampling a factor of four wider field. Again, with our prescriptions for distance and reddening correction, the previous experiments with the Kaluzny & Rucinski (1995) and Stetson et al. (2003) stellar sets provided us with a value of , and , respectively, in far better agreement with our prediction, once considering the slightly different sampled area.
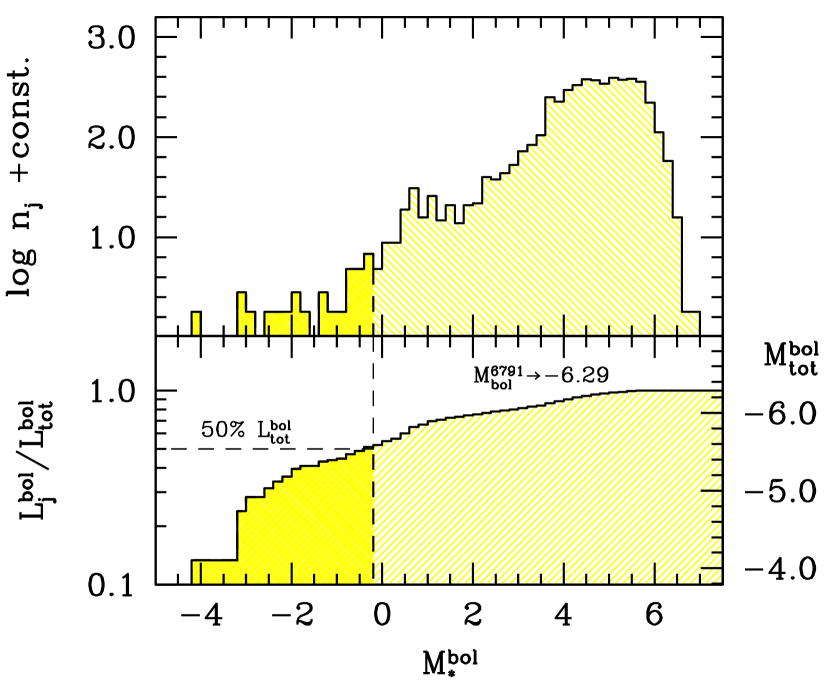
Although a prevailing fraction of the cluster total luminosity certainly comes from the few bright giant stars in our sample, one may argue, however, that our estimate of is a somewhat lower limit as i) we are missing the contribution of the faintest MS stars and ii) we might be sampling just a fraction of the total cluster, according to our observed field. A preliminary estimate of point (i) can be attempted by relying on the combined analysis of the luminosity function and the cumulative luminosity contribution of the star counts vs. absolute stellar luminosity. This is shown in Fig. 6. One may guess from the figure that sampling completeness of our luminosity function safely extends down to . Even assuming star counts to steadily increase with the same trend also at fainter magnitudes555An intrinsic flattening of the luminosity function just fainter than the Turn Off point (i.e. ) is however confirmed also by the results of Kaluzny & Rucinski (1995). we verified that the inferred value would increase by 15% at most.
Concerning the spatial sampling, as for point (ii) of our caveat, we made use of the data from Stetson et al. (2003), collected over a larger field () compared to our observations, to derive an estimate of the lost luminosity fraction. From these data, after fitting the star distribution with a King (1966) profile we obtain a photometric (projected) and tidal radius for the cluster, respectively of , and arcmin,666Note that the large error of our estimate are due to a mild spatial extrapolation of the Stetson et al. (2003) data. in nice agreement with the recent study of Platais et al. (2011). With these shape parameters, according to the luminosity profile, we estimate that about 95% of cluster luminosity has been effectively collected by our observations.
5. NGC 6791 as a proxy of UV-upturn elliptical galaxies?
Based on the resolved H-R diagram of Fig. 3, the contribution of the different stellar evolutionary stages to the integrated SED of the cluster can easily be disaggregated. As an outstanding feature, in this regard, one sees from Fig. 5 that the hot stellar component with K is by far the prevailing contributor to the UV luminosity of the cluster shortward of 2500 Å. Actually, these stars are the main responsible of the striking “UV upturn” in the spectrum of NGC 6791. A so close resemblance with the corresponding feature that sometimes marks the SED of elliptical galaxies evidently calls for special analysis of our data, in order to assess how confidently we can retain NGC 6791 as a suitable “proxy” of UV-enhanced ellipticals.
The strength of the UV upturn for the cluster is probed in Table 1 by the classical color, as originally defined by Burstein et al. (1988). A nearly equivalent definition can be obtained in an updated AB mag scale based on the Galex photometric system, as (see, e.g. Neff et al., 2008), as reported in the same table. According to our synthesis output, hot stars supply a total of 430 so that the relative contribution of the UV emission to the total bolometric luminosity of the cluster is
| (6) |
where error bar has been estimated from the Poissonian number fluctuation of the 12 bright hot stars of Fig. 3.
To properly set this figure in the more general extragalactic framework, in Fig. 7 we compare the NGC 6791 output with a set of elliptical galaxies spanning a wide range of evolutionary cases. In particular, the original Iue sample of Burstein et al. (1988), recently recompiled by Buzzoni & González-Lópezlira (2008) (18 galaxies with available Lick indices), has been extended by including the Sauron database of ellipticals with available Galex UV photometry, as discussed by Bureau et al. (2011) (41 galaxies, whose 5 objects in common with Buzzoni & González-Lópezlira, 2008).
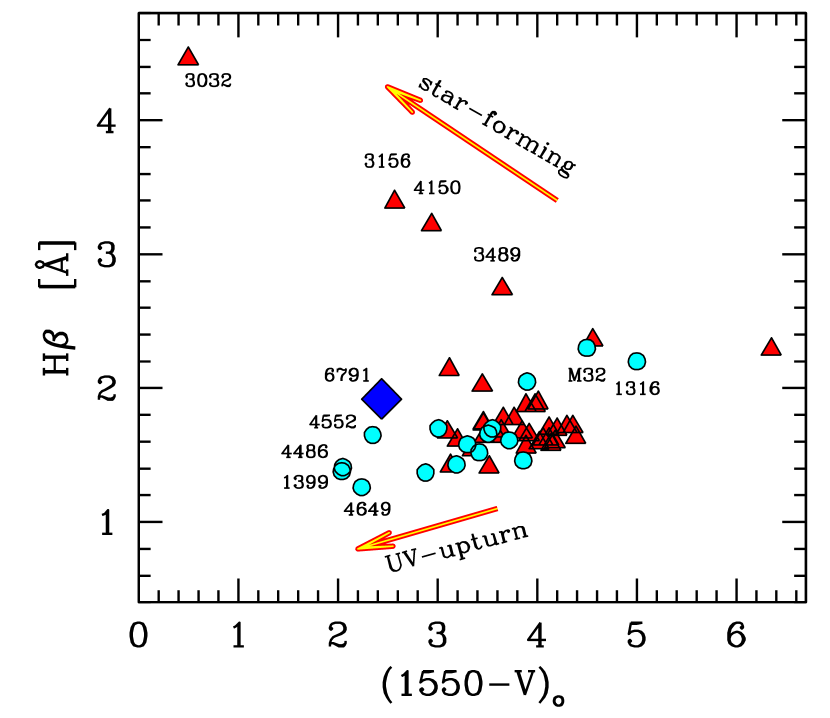
A more effective evolutionary characterization of the whole galaxy sample can be done by contrasting the color with the H equivalent width, as probed by the corresponding Lick index. Being especially sensitive to A-F stars (Gorgas et al., 1993; Buzzoni, 1995a; Buzzoni et al., 2009), is an effective tracer of the Turn-Off temperature in the c-m diagram of intermediate-age (a few Gyr, or so) stellar populations. A stronger absorption, combined with enhanced UV luminosity is therefore an unequivocal sign of moderate but recent star-formation activity in a galaxy, while a shallower feature always points to the presence of an underlying old (quiescent) stellar population.
The “”-shaped trend of the galaxies in Fig. 7 actually summarizes the general picture, with a clear sequence of star-forming ellipticals (i.e. NGC 3032, 3156, 4150 etc., see e.g. Temi et al., 2009, for a discussion), which diagonally crosses the plot, with decreasing and , and ending up in the lower right corner with the relevant case of NGC 1316 (a fresh post-merger object, see e.g. Goudfrooij et al., 2001) and M32. With further decreasing the Balmer index (roughly for Å), one sees that the UV upturn begins to take shape especially for the group of giant ellipticals, namely NGC 4552, 4486, 1399, and 4649, characterized by an increasingly “blue” color. In this framework, no doubt the case of NGC 6791 fits well with the quiescent ellipticals with the strongest UV upturn, although one has to notice the slightly larger , in consequence of the relatively younger age of the cluster compared to the galaxy stellar populations.
Assuming the UV slope not to vary so much among ellipticals, one can rely on the case of NGC 6791 to set a scale relationship between the color, and the relative strength of galaxy UV emission, compared to the global bolometric luminosity. According to the color definition, and relying on the figures of Table 1 we simply obtain777A similar relation can also be derived for the Galex color such as .
| (7) |
According to the galaxy distribution of Fig. 7, UV-upturn ellipticals are expected to emit between 1 and 2.5% of their bolometric luminosity in the ultraviolet.
A more general view of the stellar bulk of NGC 6791 can be gained in the domain of classical broad-band colors. A comparison with standard ellipticals is proposed in Table 1, after compiling Johnson, and Cousins/Gunn mean colors from the original works of Yoshii & Takahara (1988) and Fukugita et al. (1995), respectively. We also took advantage of Hamilton’s (1985) analysis of the Balmer-break index in the local and cosmological framework to derive a mean representative value of the index for present-day ellipticals (see Table 2 therein). This is reported in Table 1, as well, together with its observed standard deviation.
The UV-upturn feature is quantified in the table from the data of Fig. 7 by averaging the color of the four most UV-enhanced ellipticals in the plot, namely NGC 1399, 4486, 4552 and 4649. For these galaxies we also assumed a Galex color from the reference SED of Buzzoni & González-Lópezlira (2008). According to Yi et al. (2011), only some 5% of present-day early-type galaxies do actually display the UV-upturn phenomenon. For this reason, our figures in Table 1 should be taken as lower limits to the allowed color range for standard ellipticals in the local Universe.
As far as optical colors are concerned, we see that NGC 6791 strictly matches the photometric properties of standard ellipticals. A systematic difference begins to appear, on the contrary, when moving to longer wavelength in the near infrared, with increasingly brighter magnitudes relative to the luminosity (“redder” colors) for ellipticals with respect to the open cluster. An interesting difference can also be noticed for the 4000 Å Balmer jump, which is significantly shallower for the cluster with respect to the average elliptical. When specifically contrasted with UV-upturn galaxies, like NGC 4552 () and NGC 4486 (), we see from Hamilton (1985) that in any case galaxy index exceeds the NGC 6791 estimate. As the feature mainly collects the photometric properties of the Turn Off stars, increasing in value along the early- late-type spectral sequence (see the instructive Fig. 6 of Hamilton, 1985), we are inclined to interpret this difference as a sign of the younger age of NGC 6791.
| Stage | number | implied lifetime | theoretical lifetime | H-equivalent | ||
| of stars | Basti | Padova | fuel [] | |||
| MS | 0.10 | |||||
| SGB | 881 | 1762 Myr | 2390 Myr | 1660 Myr | 0.08 | 0.039 |
| RGB+AGB | 333 | 666 Myr | 735 Myr | 633 Myr | 0.64 | 0.304 |
| RHB+EHB | 45+12 | 114 Myr | 107 Myr | 113 Myr | 0.10 | 0.047 |
| WD | 0.00 | |||||
| Unclass. | 151 | 0.08 | 0.040 | |||
| Total | 4739 | 1.00 | 0.43 M⊙ | |||
| BRGB+AGB | 35 | 70 Myr | 67 Myr | 59 Myr | ||
| R′ = | 57/35 | 1.63 | 1.60 (Y=0.30) | 1.92 (Y=0.34) | ||
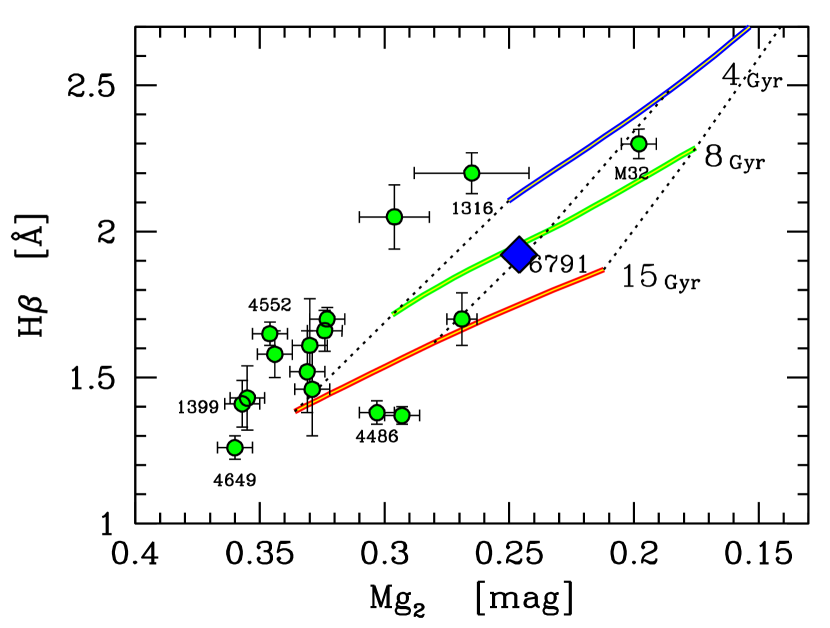
Finally, a comparison of the two most popular Lick indices, namely H and Mg2, is attempted in Fig. 8. As well known (Buzzoni, 1995a, b) this combination allows a simple and quite effective “taxonomy” of the H-R diagram of a stellar population as, while H strength probes the Turn-Off location of the population (and therefrom its age), the integrated Mg2 index better responds to the red-giant branch (AGB+RGB) contribution. When compared to its location in Fig. 7, NGC 6791 moves now in the Lick plane toward the region of low-mass metal-poorer ellipticals, like M32. When matched with standard population synthesis models (e.g. Buzzoni, 1989, 1995a) the H strength consistently confirms for the cluster an age about 8 Gyr, while Mg2 points to just a marginally supersolar metallicity. According to our discussion in Sec. 3.1, this behavior may be the natural effect of a larger parameter, as induced by an enhanced Helium abundance. A coarser number of bright RGB+AGB stars would reduce in fact the integrated Mg2 index and could also give reasons of the sensibly “bluer” infrared colors, thus mimicking the effect of a lower metallicity.
6. Implied stellar lifetimes
Star number counts across our resolved H-R diagram of NGC 6791 can also be used to infer the absolute lifetime of the different post-Main Sequence (PMS) evolutionary stages. This can be done by relying on the the so-called “Fuel consumption theorem” (FCT) (Renzini & Buzzoni, 1986) which, for every “j-th” PMS phase, allows us to probe its implied lifetime () just in terms of the number () of observed stars that currently sample it in the cluster diagram. Following Renzini & Buzzoni (1986), once accounting for the total collected luminosity of NGC 6791, we can write
| (8) |
In the equation, the parameter is the so-called “specific evolutionary flux” and, according to stellar population synthesis models (see, e.g. Buzzoni, 1989; Maraston, 1998), it can safely be set to Lyr-1. By recalling eq. (5), we eventually obtain
| (9) |
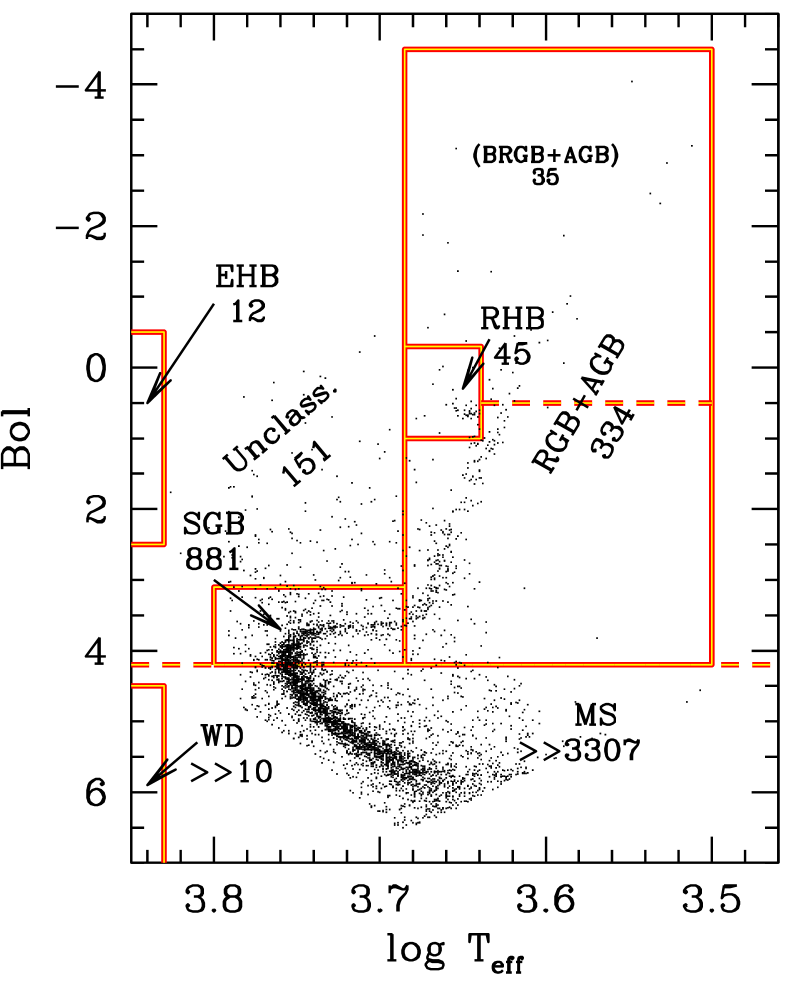
In our sample one has therefore to expect, on average, one star per PMS evolutionary step of 2 Myr. Star number counts have been carried out for the NGC 6791 stellar population according to the scheme of Fig. 9. Our results are summarized in col. 2 of Table 3 together with the implied lifetime (col. 3), as from eq. (9).
Although within the large uncertainties due to the low statistics, a close inspection of our data and a match with the several c-m diagrams available in the literature (see, in particular Liebert et al., 1994, on this subject) allows us a preliminary estimate of the Iben (1968) parameter to probe the Helium content of the NGC 6791 stellar population. More properly, as a variant in case one cannot firmly discriminate between AGB and bright RGB stars, also an alternative parameter can be tried, where and includes both the RGB tail brighter than the RHB luminosity level, and the AGB contribution. According to Table 3, we have , where the error bar comes from a logarithmic differentiation, so that .
By relying on the Buzzoni et al. (1983) calibration, one may eventually figure out a Helium abundance for the cluster of , in close agreement with the results of Brogaard et al. (2011) based on high-res spectroscopy of detached eclipsing binaries. This implies an enrichment ratio .
Although moving from opposite physical arguments, our picture may actually complement the original interpretative scheme proposed by Kalirai et al. (2007), as we have been anticipating in Sec. 3.1. Both the effect of enhanced mass loss and Helium abundance act, in fact, in the sense of increasing the ratio of PMS stars either by decreasing the envelope size (mass loss) or by increasing the He core mass (He overabundance). An enhanced ratio favors post-RGB stars to anticipate their pathway to the white-dwarf final stage, in some cases by directly relocating in the high-temperature region of the H-R diagram both in the form of EHB or “hot flasher” stars (D’Cruz et al., 1996; Castellani et al., 2006b; Miller Bertolami et al., 2008; Yaron et al., 2008). Besides their synergic behavior to produce hotter HB stars, one major difference between the two evolutionary scenarios is that, contrary to mass loss, a change in Helium abundance directly acts on the evolutionary lifetime as it affects the nuclear clock of stars along the whole He-burning phases.
A useful comparison of our output can be done with predictions from stellar evolution theory. Again, for this match we relied on the two reference sets of stellar tracks from the Basti (Pietrinferni et al., 2004) and Padova (Bertelli et al., 2008) databases assuming a very similar (solar-scaled) chemical composition, namely for the Basti models and for the corresponding Padova ones. Considering cluster age and chemical composition, a Turn-Off stellar mass of has to be expected. This value is also consistent with the direct estimate of the primary stellar component of the detached binary system V20, almost exactly placed at the Turn Off point, and for which Grundahl et al. (2008) indicate a mass of . The resulting theoretical lifetime for PMS evolution is displayed in cols. 4 and 5 of Table 3.
In addition, we also added to the table (see col. 6) the relative bolometric contribution to cluster luminosity as from the observed stars in the different evolutionary stages. This ratio is actually the essence of the FCT, and gives a direct hint of the nuclear fuel consumed by stars along their PMS evolution. By simply rearranging eq. (8) we can write in fact
| (10) |
where is the mean reference luminosity of stars along their j-th evolutionary phase. Allover, this phase will provide a total emission and a relative contribution to the global cluster luminosity of
| (11) |
In the equation, is the fuel consumed by a star along its j-th PMS evolutionary stage. After appropriate conversion (see Buzzoni, 2011, for the detailed procedure) this figure can also be expressed in H-equivalent , as reported in col. 7 of Table 3 (see also Renzini & Fusi Pecci, 1988 and Maraston, 1998 for an instructive application of this approach to other Galactic globular clusters).
A few interesting considerations stem from the combined analysis of the table entries. The first, and possible most important one, deals with the implied HB lifetime. As far as the number counts is concerned, one sees from the table that a full score, including both the RHB and the EHB stars, is required to consistently compare with the theoretical expectations from both the Basti and Padova stellar tracks. This confirms therefore that both RHB and EHB stars are part of the same physical stage along the evolutionary path. According to our data, the HB phase for NGC 6791 stars lasts a total of Myr in quite good agreement with theory. Along this phase, stars burn a total of 0.047 , an output that has to be compared with the theoretical fuel figures of and for the Basti and Padova stellar tracks, respectively. Concerning the claimed presence of a few () supplementary HB stars at intermediate temperature filling the gap between the RHB clump and the EHB group, as suggested by Platais et al. (2011) but never confirmed before, this result seems unlikely as the implied HB lifetime could be hardly explained in terms of standard theory of stellar evolution.
While the energetic arguments about fuel consumption successfully account for star counts and the implied stellar lifetime, they could hardly give reason of the peculiar HB morphology as observed in NGC 6791, a striking sign of mass bimodality among HB stars. Other intervening mechanisms should likely be invoked in this sense to modulate HB morphology, perhaps through an “outside-in” action on the stellar envelope (thus leaving untouched the stellar clock), for instance as a consequence of binary mass transfer (Yong & Demarque, 2000; Yi & Yoon, 2004).
As for the bright RGB (BRGB) evolution, models agree to predict that stars complete their run from the HB luminosity level up to the RGB tip in about 51 Myr (Basti) or 42 Myr (Padova). If one adds further 16-17 Myr for stars to accomplish their AGB evolution then, according to eq. (9), a total of 30-35 bright stars are to be expected in our sample, in fairly good agreement with what we observe. According to Table 3, the total “fuel” consumed by stars along their full RGB+AGB path amounts to 0.30 , which is close to the corresponding theoretical figure of , as confirmed both by the Basti and Padova models. In force of our previous arguments about the ratio, this evidence points again to a relatively “quiescent” evolutionary scenario for NGC 6791, where the apparent deficiency in bright red giants seems a natural consequence of the enhanced Helium abundance rather than of any harassing effect of mass loss via enhanced stellar wind. This argument is further supported by the results of van Loon et al. (2008), based on Spitzer observations, who find a definite lack of evidence for any circumstellar dust production that would accompany, in case, enhanced mass loss.
On the other hand, the Kalirai’s et al. (2007) unescapable evidence for 0.43 M⊙ WDs in the cluster evidently suggests that another mechanism must be at work providing an efficient and alternative way for stars to loose mass. As a further piece of evidence, on this line, one may also recall the recent works of Bedin et al. (2008) and Twarog et al. (2011), where a similar figure (namely ) is independently found for the fraction of binary stars in NGC 6791. Further evidence for unresolved (close) binary systems among RHB stars has been also provided by Stello et al. (2011), based on asteroseismology observations from the Kepler space mission. Such a sizeable presence of binary systems has actually been meant by Bedin et al. (2008) to originate the WD peculiar distribution.
According to Fig. 9, about 3% of our total bona fide sample (151 stars) cannot easily be arranged in our classification scheme. They provide 8% of our estimated cluster luminosity. If simply neglected, as in the most drastic interpretation supposing to be all spurious interlopers, then we should decrease accordingly, and this would lead to a correspondingly higher (+8%) implied PMS lifetime, through eq. (8). So, our estimates in Table 3 should be taken, in case, as lower limits.
A thorough assessment of membership probability in this region of the H-R diagram (see Platais et al., 2011) may actually lead to envisage a certain fraction of field stars. However, one could argue that the evident overdensity of faint stars (some 30 objects, just above the Turn-Off region about ) is certainly to be ascribed to the sizeable population of cluster Blue Stragglers as extensively recognized in other literature studies (Kaluzny & Udalski, 1992; Rucinski et al., 1996; Landsman et al., 1998; Kalirai et al., 2007). Ahumada & Lapasset (2007), in their revised catalog, report 75 blue stragglers candidates for this cluster.
If fully considered in the cluster budget, according to the FCT the 151 “unclassified” stars would imply a supplementary fuel consumption of roughly . Therefore, a total of of Hydrogen (mainly converted to Helium and some metals) has been consumed by NGC 6791 stars along their PMS evolution. Interestingly enough, this figure is very close to the Kalirai et al. (2007) estimate of WD mass, so that one may conclude that cluster stars reach the end of their PMS path after having fully exhausted (or lost) their external envelope.
A final consideration deals with the MS contribution, which in our sample amounts to a scanty 10% of the total cluster luminosity. This has evidently to be regarded as a lower limit, being the faint red dwarf stars off the limit of our detection.888Note, by the way, that part of the faintest undetected population of MS stars in the cluster may in fact already be accounted for in our photometry via blending effects with brighter objects. This would actually make “detected” stars slightly brighter and redder. A hint in this sense is for instance the drift toward “cooler” temperatures in the faint-end MS locus of Fig. 3 when compared with theoretical isochrones. In force of the discussion in Sec. 4 (see, in particular, Fig. 6 therein) one could set a quite safe upper limit to the MS luminosity contribution such as . With this figure, however, even a quick check with the theoretical predictions from stellar population synthesis (Buzzoni, 1989, 1995a) firmly points to a dwarf-depleted IMF (that is with a slope consistent or flatter than the Salpeter case) for cluster stars.
7. Summary & conclusions
In this work we have carried out an analysis of the distinctive evolutionary properties of the stellar population in the old metal-rich Galactic open cluster NGC 6791. Our discussion moves from a set of orginal observations, which sampled the cluster field down to mag. In lack of any systematic membership parameters for our stars, a statistical cleaning of the field interlopers across the cluster region has been adopted through an appropriate magnitude/color selection in the observed vs. c-m diagram as sketched in Fig. 1. To better probe also the few bright red giants in the cluster we complemented our sample with the 2Mass output on the same field. The merged database of bona fide cluster stars brighter than eventually consisted of 4739 objects.
Based on the Uvblue theoretical library of synthetic stellar spectra Rodríguez-Merino et al. (2005) we then derived a grid of calibrating relations for such as to link the color with the effective temperature and the -band bolometric correction (see Fig. 2). This allowed us to estimate the fundamental parameters (namely , and ) for 4706 available stars with accurate color, assuming a color excess and a distance modulus after Twarog et al. (2009). A similar approach has also been carried out for the 94 2Mass stars relying on their color, throught the Buzzoni et al. (2010) empirical calibration, as in the set of eq. 4. The 61 stars of the 2Mass sample in common with the database allowed us to assess the internal accuracy of our calibration procedure. Accordingly, we concluded that effective temperature and bolometric luminosity have been retrieved, respectively, within a dex and mag uncertainty. As a final output of our procedure, the H-R diagram of the cluster was obtained. This is shown in Fig. 3 and has been the main reference for our investigation. The upper MS of the diagram is well matched by the Padova isochrones of Bertelli et al. (2008) for Gyr, assuming a chemical mix. The Turn Off point appears to be placed at , with an effective temperature K, consistent with a spectral type G5V (Johnson, 1966).
According to the fiducial , and parameters, we attached each star in our sample the appropriate synthetic spectrum eventually obtaining the integrated SED of the cluster. In particular, high-resolution (2 Å FWHM) spectral synthesis has been carried out for the ultraviolet wavelength region, relying on the Uvblue models, while its extension to longer wavelength was accomplished at lower resolution by means of the Buzzoni (1989) synthesis code, which makes use of Kurucz’ (1993) Atlas9 grid of model atmospheres (see Fig. 5). As a main output of our synthesis procedure, integrated cluster magnitudes and broad-band colors both in the Johnson/Cousins and Gunn systems have been obtained, as summarized in Table 1. Furthermore, the full set of Fanelli et al. (1990) mid-UV narrow-band indices were computed from the high-res SED. These have been complemented with a supplementary set of indices to assess the 4000 Å Balmer break (Brodie & Hanes, 1986; Bruzual, 1983) and the strength of the main spectral features in the optical range comprised in the Lick narrow-band index system (Worthey et al., 1994) (see Table 2). The sum of all stars in our sample yields a total bolometric magnitude of , or . A residual 15% luminosity fraction, at most, may have been lost in our census residing into the faintest undetected low-MS stars (see Fig. 6). The corresponding figure for the band is , or 14300 solar luminosities, assuming from Portinari et al. (2004) .
As far as integrated cluster colors are concerned, according to Table 1, we obtain in farly good agreement with Kinman’s (1965) original estimate, and with a direct empirical check by summing up stars in the Kaluzny & Rucinski (1995) and Stetson et al. (2003) photometric catalogs, once picking up cluster locus according to our selection criteria. When compared with the color properties of standard ellipticals (Yoshii & Takahara, 1988; Fukugita et al., 1995, see Table 1), NGC 6791 appears to be a fairly good proxy. To a closer analysis, however, one has to notice significantly bluer infrared colors for the cluster, and a lower index. All these features are clearly reminiscent of a weaker photometric contribution of red-giant stars in our system. The younger age of NGC 6791, compared to standard elliptical galaxies, also reflects in a slightly stronger absorption and a shallower 4000 Å Balmer break, as reported in Table 2 (see also Fig. 8).
The UV properties of the integrated SED have been assessed both in terms of the classical color, as originally defined by Burstein et al. (1988), and the updated and AB colors to match the Galex photometric system. Once compared with extragalactic observations of elliptical galaxies, NGC 6791 appears to share the UV properties of the most active UV-upturn ellipticals, like NGC 4552 and NGC 4486 (see Fig. 7) with a fraction of 1.7% of its bolometric luminosity emitted in the ultraviolet wavelenght range, shortward of 2500 Å (see Fig. 5). This contribution is selectively supplied by the few stars hotter than K. In particular, 12 stars may have been detected during their hot HB evolution, in the form of EHB objects. While nine of them are known targets already classified by Kaluzny & Udalski (1992), three more stars are recognized in our field, being consistent with this scenario (see Paper II for further discussion). Coupled with the color– or its equivalent– the H index is found to provide a simple and effective diagnostic tool to probe the nature of the UV excess in unresolved stellar systems. A “bluer” color, as in moderately star-forming ellipticals, for instance, will always accompany an enhanced H absorption (indicatively, Å). The UV-upturn best candidates, therefore, stand out for their relatively lower H, a definite sign of quiescent evolution.
A comparison with the D’Cruz et al. (1996) theoretical stellar tracks indicates that the hot edge of the HB stellar distribution in Fig. 3 consistently agrees with the evolutionary track of a star. Accordingly, most of the Kaluzny & Udalski (1992) stars seem currently at the limiting mass to ignite Helium in their core (Dorman et al., 1995), and they may be evolving to the WD cooling sequence as AGB-manqué objects (Greggio & Renzini, 1990, see, again, Fig. 3). Quite interestingly, our arguments support the claimed evidence of Kalirai et al. (2007) for a prevailing fraction of He-rich low-mass stars with in the WD population of NGC 6791. Compared with the expected stellar mass at the Turn Off point (about , according to Grundahl et al., 2008), such a reduced WD mass range evidently calls for an efficient and pervasive mechanism of mass loss, along the PMS evolution. While stellar wind may obviously play a role, a combined series of arguments in our analysis may rather lead to prefer an alternative scenario, where mass transfer mechanisms, dealing with binary-system evolution, might likely provide a viable channel to let stellar envelope vanish along the full PMS evolutionary path (Carraro & Chiosi, 1995; Carraro et al., 1996). One point in this sense is certainly the high (%) fraction of binary stars in the cluster (Bedin et al., 2008) and, at the same time, the lack of any explicit effect of enhanced stellar wind along red-giant evolution (van Loon et al., 2008; Miglio et al., 2012). Rather than calling for any sort of “superwind” peeling-off process, as the analysis of Kalirai et al. (2007) may for instance lead to envisage, the recognized evidence of a reduced lifetime and a correspondingly scanty population of RGB+AGB stars, could more naturally be in consequence of a Helium-rich chemical mix for the cluster stellar population. By relying on the Iben (1968) parameter, in fact, red-giant number counts are consistent with , where the upper limit of the allowed range could be preferred, considering the higher statistical probability for the few bright red giants to be field interlopers.
In this framework, it is interesting to remark the excellent agreement between the implied lifetime of the different evolutionary branches in the cluster H-R diagram, as derived from the FCT theorem (Renzini & Buzzoni, 1986) and the theoretical expectations from both the Padova (Bertelli et al., 2008) and Basti (Pietrinferni et al., 2004) stellar tracks, as summarized in Table 3. Both RHB and EHB stars are therefore to be considered as a part of the same evolutionary stage, that physically coincides with the core He-burning phase, and lasts in NGC 6791 a total of Myr. One has to notice, however, that the energetic arguments, alone, cannot explain the puzzling evidence for HB stars to display a so marked mass bimodality. Again, shocking “outside-in” physical mechanisms, possibly related to binary mass transfer, might be addressed to provide a more satisfactory solution in this sense (Yong & Demarque, 2000; Yi & Yoon, 2004). If this is the real case, that applies to UV-enhanced ellipticals too, then one may be led to conclude that the UV upturn phenomenon is a quite delicate result of tuned environment conditions (i.e. higher surface brightness and more “packed” stars) and evolutionary constraints (i.e. old and metal-rich stellar populations) inside galaxies. The marginal evidence for high-mass ellipticals to better display an UV excess in their SED is a clue in this sense (Burstein et al., 1988; Yi et al., 2011).
As the expected timescale for AGB completion turns about 16-17 Myr, according to the theoretical stellar tracks, then observations lead to infer for the RGB alone a total lifetime of Myr, whose 53 Myr are spent at a brighter luminosity than the RHB clump. As for the MS properties, its reduced photometric contribution (just a 10% of the total cluster luminosity, in our sample) seems a firm result, that is not substantially recovered even by accounting for lost faint stars, and rather points to an inherently dwarf-depleted IMF, consistent or flatter than the Salpeter case.
In force of the FCT, by summing up the photometric contribution of stars along the different
PMS phases, we derive from Table 3 a total fuel consumption of
0.43 M⊙. This figure is in close agreement with the expected
He core from theoretical tracks, and with the estimated WD mass of
M⊙, indicating that
cluster stars fully exhaust (or lose) their external envelope along the full PMS
evolution. Such a tight agreement, may also lead to suspect, with Kalirai et al. (2007), that a
fraction of the cluster stellar population does not reach the minimum mass required for
stars to effectively ignite He in their cores.
References
- Ahumada & Lapasset (2007) Ahumada, J. A., & Lapasset, E. 2007, A&A, 463, 789
- Anthony-Twarog et al. (2007) Anthony-Twarog B.J., Twarog B.A., Mayer L. 2007, AJ, 133, 1585
- Baldwin et al. (1973) Baldwin, J. R., Danziger, I. J., Frogel, J. A., & Persson, S. E. 1973, ApJ, 14, L1
- Bedin et al. (2006) Bedin, L.R., Piotto, G., Carraro, G., King, I. R., & Anderson, J., 2006, A&A, 460, L27
- Bedin et al. (2008) Bedin, L. R., Salaris, M., Piotto, G., Cassisi, S., Milone, A. P., Anderson, J., & King, I. R. 2008, ApJ, 679, L29
- Bertelli et al. (2008) Bertelli, G., Girardi, L., Marigo, P., & Nasi, E. 2008, A&A, 484, 815
- Bertola et al. (1982) Bertola, F., Capaccioli, M., & Oke, J. B. 1982, ApJ, 254, 494
- Bertola et al. (1995) Bertola, F., Bressan, A., Burstein, D., Buson, L.M. et al. 1995, ApJ, 438, 680
- Bressan et al. (1994) Bressan, A., Chiosi, C., Fagotto, F. 1994, ApJS, 94, 63
- Brown et al. (1997) Brown, T.M., Ferguson, H.C., Davidsen, A.F., Dorman, B. 1997, ApJ, 482, 685
- Brown et al. (1998) Brown, T.M., Ferguson, H.C., Stanford, S.A., Deharveng, J.-M. 1998, ApJ, 504, 113
- Brown et al. (2000) Brown, T.M., Bowers, C.W., Kimble, R.A., Sweigart, A.V., Ferguson, H.C. 2000, ApJ, 532, 308
- Boesgaard et al. (2009) Boesgaard, A. M., Jensen, E. E. C., & Deliyannis, C. P. 2009, AJ, 137, 4949
- Brodie & Hanes (1986) Brodie, J. P., & Hanes, D. A. 1986, ApJ, 300, 258
- Brodie & Huchra (1990) Brodie, J. P., & Huchra, J. P. 1990, ApJ, 362, 503
- Brogaard et al. (2011) Brogaard, K., Bruntt, H., Grundahl, F., Clausen, J. V., Frandsen, S., Vandenberg, D. A., & Bedin, L. R. 2011, A&A, 525, A2
- Bruzual (1983) Bruzual A., G. 1983, ApJ, 273, 105
- Bureau et al. (2011) Bureau, M., et al. 2011, MNRAS, 414, 1887
- Burstein et al. (1988) Burstein, D., Bertola, F., Buson, L. M., Faber, S. M., & Lauer, T. R. 1988, ApJ, 328, 440
- Buzzoni (1989) Buzzoni, A. 1989, ApJS, 71, 817
- Buzzoni (1995a) Buzzoni, A. 1995a, ApJS, 98, 69
- Buzzoni (1995b) Buzzoni, A. 1995b, Fresh Views of Elliptical Galaxies, 86, 189
- Buzzoni (2005) Buzzoni, A. 2005, MNRAS, 361, 725
- Buzzoni (2007) Buzzoni, A. 2007, ASP Conf. Ser., no. 375 eds. A. Vallenari et al., (ASP: San Francisco) p. 311
- Buzzoni (2011) Buzzoni, A. 2011, MNRAS, 971
- Buzzoni & González-Lópezlira (2008) Buzzoni, A., & González-Lópezlira, R. A. 2008, ApJ, 686, 1007
- Buzzoni et al. (1992) Buzzoni, A., Gariboldi, G., & Mantegazza, L. 1992, AJ, 103, 1814
- Buzzoni et al. (1994) Buzzoni, A., Mantegazza, L., & Gariboldi, G. 1994, AJ, 107, 513
- Buzzoni et al. (1983) Buzzoni, A., Fusi Pecci, F., Buonanno, R., & Corsi, C. E. 1983, A&A, 128, 94
- Buzzoni et al. (2009) Buzzoni, A., Battistini, C., Carrasco, L., & Recillas, E. 2009, Rev Mex Astron. Astrophys. Conf. Ser., 37, 110
- Buzzoni et al. (2010) Buzzoni, A., Patelli, L., Bellazzini, M., Pecci, F. F., & Oliva, E. 2010, MNRAS, 403, 1592
- Carney et al. (2005) Carney B.W., Lee J-W., Dodson B. 2005, AJ, 129, 656
- Carraro & Chiosi (1995) Carraro, G., & Chiosi, C. 1995, The Formation of the Milky Way, 175
- Carraro et al. (1996) Carraro, G., Girardi, L., Bressan, A., & Chiosi, C. 1996, A&A, 305, 849
- Carraro et al. (1999) Carraro G., Girardi L., Chiosi C. 1999, MNRAS, 309, 430
- Carraro et al. (2006) Carraro G., Villanova S., Demarque P., McSwain M.V., Piotto G., Bedin L.R. 2006, ApJ, 643, 1151
- Castellani et al. (2006a) Castellani, V., Iannicola, G., Bono, G., Zoccali, M., Cassisi, S., & Buonanno, R. 2006, A&A, 446, 569
- Castellani et al. (2006b) Castellani, M., Castellani, V., & Prada Moroni, P. G. 2006, A&A, 457, 569
- Castelli & Kurucz (2003) Castelli, F., & Kurucz, R. L. 2003, IAU Symp. 210, Modelling of Stellar Atmospheres, eds. N. Piskunov, W.W. Weiss & D.F. Gray (San Francisco: ASP) 210
- Chaboyer et al. (1999) Chaboyer, B., Green, E. M., & Liebert, J. 1999, AJ, 117, 1360
- Chavez et al. (2007) Chavez, M., Bertone, E., Buzzoni, A., Franchini, M., Malagnini, M. L., Morossi, C., & Rodriguez-Merino, L. H. 2007, ApJ, 657, 1046
- Code & Welch (1979) Code, A. D., & Welch, G. A. 1979, ApJ, 228, 95
- Code & Welch (1982) Code, A. D., & Welch, G. A. 1982, ApJ, 256, 1
- D’Cruz et al. (1996) D’Cruz, N. L., Dorman, B., Rood, R. T., & O’Connell, R. W. 1996, ApJ, 466, 359
- D’Cruz et al. (2000) D’Cruz, N. L., Morgan, S. M., Böhm-Vitense, E. 2000, AJ, 120, 990
- Dorman et al. (1995) Dorman, B., O’Connell, R.W., Rood, R.T 1995, ApJ, 442 105
- Fanelli et al. (1990) Fanelli, M. N., O’Connell, R. W., Burstein, D., & Wu, C.-C. 1990, ApJ, 364, 272
- Fukugita et al. (1995) Fukugita, M., Shimasaku, K., & Ichikawa, T. 1995, PASP, 107, 945
- Girardi et al. (2005) Girardi, L., Groenewegen, M. A. T., Hatziminaoglou, E., & da Costa, L. 2005, A&A, 436, 895
- Gorgas et al. (1993) Gorgas, J., Faber, S. M., Burstein, D., Gonzalez, J. J., Courteau, S., & Prosser, C. 1993, ApJS, 86, 153
- Gorgas et al. (1999) Gorgas, J., Cardiel, N., Pedraz, S., & González, J. J. 1999, A&AS, 139, 29
- Goudfrooij et al. (2001) Goudfrooij, P., Alonso, M. V., Maraston, C., & Minniti, D. 2001, MNRAS, 328, 237
- Gratton et al. (2006) Gratton R., Bragaglia A., Carretta E., Tosi M., 2006, ApJ, 642, 462
- Greggio & Renzini (1990) Greggio, L., Renzini, A. 1990, ApJ, 364, 35
- Grundahl et al. (2008) Grundahl, F., Clausen, J. V., Hardis, S. & Frandsen S. 2008, A&A, 492, 171
- Hamilton (1985) Hamilton, D. 1985, ApJ, 297, 371
- Harris (1974) Harris, W. E. 1974, ApJ, 192, L161
- Iben (1968) Iben, I. 1968, Nature, 220, 143
- Iben & Renzini (1983) Iben I., Jr., Renzini A., 1983, ARA&A, 21, 271
- Johnson (1966) Johnson H. L., 1966, ARA&A, 4, 193
- Kalirai et al. (2007) Kalirai, J. S., Bergeron, P., Hansen, B. M. S., Kelson, D. D., Reitzel, D. B., Rich, R. M., & Richer, H. B., 2007, ApJ, 671, 748
- Kaluzny & Udalski (1992) Kaluzny, J., Udalski, A. 1992, AcA, 42, 29
- Kaluzny & Rucinski (1995) Kaluzny, J., Rucinski S.M. 1995, A&AS, 114, 1
- King (1966) King, I. R. 1966, AJ, 71, 64
- Kinman (1965) Kinman, T. D., 1965, ApJ, 142, 655
- Kurucz (1993) Kurucz, R. L. 1993, CD-ROM 13, Atlas9 Stellar Atmosphere Programs and 2 km/s Grid (Cambridge: Smithsonian Astrophys. Obs.)
- Landolt (1992) Landolt, A.U. 1992, AJ, 104, 340
- Landsman et al. (1998) Landsman, W., Bohlin, R.C., Neff, S.G. et al. 1998, AJ, 116 789
- Lata et al. (2002) Lata, S., Pandey, A. K., Sagar, R., & Mohan, V. 2002, A&A, 388, 158
- Liebert et al. (1994) Liebert, J., Saffer, R.A., Green, E.M. 1994, ApJ, 107, 1408
- Maraston (1998) Maraston, C. 1998, MNRAS, 300, 872
- Miglio et al. (2012) Miglio, A., Brogaard, K., Stello, D., et al. 2012, MNRAS, 419, 2077
- Miller Bertolami et al. (2008) Miller Bertolami, M. M., Althaus, L. G., Unglaub, K., & Weiss, A. 2008, A&A, 491, 253
- Montgomery et al. (1994) Montgomery, K. A., Janes, K. A., & Phelps, R. L. 1994, AJ, 108, 585
- Neff et al. (2008) Neff, S.G., Hollis, J.E. & Offenberg, J.D. 2008 “Galex Observer’s Guide”, Web edition available on line at http://galexgi.gsfc.nasa.gov/docs/galex/Documents
- Origlia et al. (2006) Origlia L., Valenti E., Rich R.M., Ferraro F.R. 2006, ApJ, 646, 499
- Paczyński (1970) Paczyński B., 1970, Acta Astr., 20, 47
- Peterson & Green (1998) Peterson, R. C., & Green, E. M. 1998, ApJ, 502, L39
- Pietrinferni et al. (2004) Pietrinferni, A., Cassisi, S., Salaris, M., & Castelli, F. 2004, ApJ, 612, 168
- Pietrinferni et al. (2006) Pietrinferni, A., Cassisi, S., Salaris, M., & Castelli, F. 2006, ApJ, 642, 797
- Pietrinferni et al. (2007) Pietrinferni, A., Cassisi, S., Salaris, M., Cordier, D., & Castelli, F. 2007, IAU Symposium, 241, 39
- Platais et al. (2011) Platais, I., Cudworth, K. M., Kozhurina-Platais, V., McLaughlin, D. E., Meibom, S., & Veillet, C. 2011, ApJ, 733, L1
- Portinari et al. (2004) Portinari, L., Sommer-Larsen, J., & Tantalo, R. 2004, MNRAS, 347, 691
- Renzini & Buzzoni (1986) Renzini, A., Buzzoni, A., 1986, ASSL Vol. 122: Spectral Evolution of Galaxies, 195
- Renzini & Fusi Pecci (1988) Renzini, A., & Fusi Pecci, F. 1988, ARA&A, 26, 199
- Rodríguez-Merino et al. (2005) Rodríguez-Merino L. H., Chavez M., Bertone E., Buzzoni A., 2005, ApJ, 626, 411
- Rucinski et al. (1996) Rucinski, S. M., Kaluzny, J., & Hilditch, R. W. 1996, MNRAS, 282, 705
- Stello et al. (2011) Stello, D., et al. 2011, ApJ, 737, L10
- Stetson (1987) Stetson, P.B., 1987, PASP, 99, 191
- Stetson et al. (2003) Stetson, P. B., Bruntt, H., & Grundahl, F. 2003, PASP, 115, 413
- Skrutskie et al. (2006) Skrutskie M. F., et al., 2006, AJ, 131, 1163
- Temi et al. (2009) Temi, P., Brighenti, F., & Mathews, W. G. 2009, ApJ, 695, 1
- Twarog et al. (2009) Twarog, B. A., Anthony-Twarog, B. J., & Edgington-Giordano, F. 2009, PASP, 121, 1312
- Twarog et al. (2011) Twarog, B. A., Carraro, G., & Anthony-Twarog, B. J., 2011, ApJ, 727, L7
- van Loon et al. (2008) van Loon, J. T., Boyer, M. L., & McDonald, I. 2008, ApJ, 680, L49
- Worthey et al. (1994) Worthey, G., Faber, S. M., Gonzalez, J. J., & Burstein, D. 1994, ApJS, 94, 687
- Wu et al. (2009) Wu, Z.-Y., Zhou, X., Ma, J., & Du, C.-H. 2009, MNRAS, 399, 2146
- Xin & Deng (2005) Xin, Y., & Deng, L. 2005, ApJ, 619, 824
- Yaron et al. (2008) Yaron, O., Kovetz, A., & Prialnik, D. 2008, IAU Symposium, 252, 261
- Yi & Yoon (2004) Yi S. K., Yoon S.-J., 2004, Ap&SS, 291, 205
- Yi et al. (2011) Yi, S. K., Lee, J., Sheen, Y.-K., et al. 2011, ApJS, 195, 22
- Yong & Demarque (2000) Yong, H., Demarque, P., Yi, S. 2000, ApJ, 539, 928
- Yoshii & Takahara (1988) Yoshii, Y., & Takahara, F. 1988, ApJ, 326, 1