Rebirth of X-ray Emission from the Born-Again Planetary Nebula A 30
Abstract
The planetary nebula (PN) A 30 is believed to have undergone a very late thermal pulse resulting in the ejection of knots of hydrogen-poor material. Using multi-epoch HST images we have detected the angular expansion of these knots and derived an age of 850 yr. To investigate the spectral and spatial properties of the soft X-ray emission detected by ROSAT, we have obtained Chandra and XMM-Newton deep observations of A 30. The X-ray emission from A 30 can be separated into two components: a point-source at the central star and diffuse emission associated with the hydrogen-poor knots and the cloverleaf structure inside the nebular shell. To help us assess the role of the current stellar wind in powering this X-ray emission, we have determined the stellar parameters and wind properties of the central star of A 30 using a non-LTE model fit to its optical and UV spectrum. The spatial distribution and spectral properties of the diffuse X-ray emission is highly suggestive that it is generated by the post-born-again and present fast stellar winds interacting with the hydrogen-poor ejecta of the born-again event. This emission can be attributed to shock-heated plasma, as the hydrogen-poor knots are ablated by the stellar winds, under which circumstances the efficient mass-loading of the present fast stellar wind raises its density and damps its velocity to produce the observed diffuse soft X-rays. Charge transfer reactions between the ions of the stellar winds and material of the born-again ejecta has also been considered as a possible mechanism for the production of diffuse X-ray emission, and upper limits on the expected X-ray production by this mechanism have been derived. The origin of the X-ray emission from the central star of A 30 is puzzling: shocks in the present fast stellar wind and photospheric emission can be ruled out, while the development of a new, compact hot bubble confining the fast stellar wind seems implausible.
1 Introduction
Planetary nebulae (PNe) consist of stellar material ejected by low- and intermediate-mass stars. In the canonical model of PN formation, the so-called interacting stellar winds (ISW) model, the envelope of a star is stripped off through a slow and dense wind and, as the star evolves off the asymptotic giant branch (AGB), it is subsequently swept up by a fast stellar wind (Cerruti-Sola & Perinotto, 1985) to form a PN (Kwok, Purton, & Fitzgerald, 1978; Balick, 1987). The dynamical structure of a PN can be very complex as the fast stellar wind interacts with a slow AGB wind whose density and velocity structure has been previously modified by the passage of the shock wave associated with a D-type ionization front (Perinotto et al., 2004; Schönberner et al., 2005a, b).
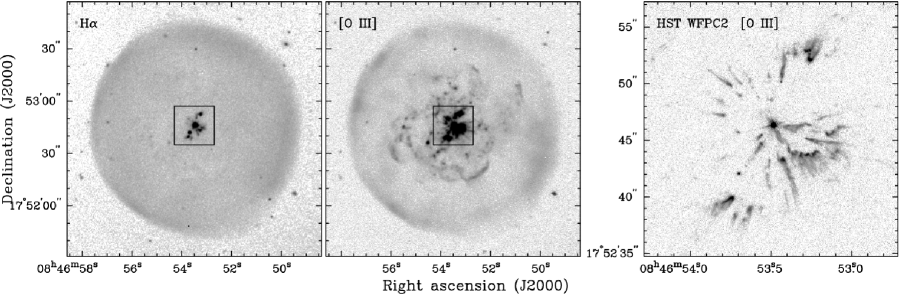
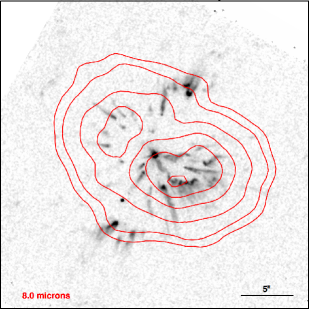
Abell 30 (a.k.a. A 30, PN G208.5+33.2) is a PN with a hydrogen-deficient central star (CSPN) of spectral type [WC]-PG1159 (also termed as “weak emission line stars”). The nebula appears in H (Figure 1-left) as a limb-brightened, presumably spherical shell with a diameter 2′, although a close inspection of its kinematics reveals that this shell has a mildly ellipsoidal shape (Meaburn & López, 1996). The spherically symmetric limb-brightened morphology, the low surface brightness and the low electron density of this shell (Guerrero & Manchado, 1996) are consistent with the expectations for an evolved object in the ISW model of PN formation (e.g., Schönberner et al., 2010). This conjecture is supported by the large kinematical age of 12,500 yr derived from the simple comparison of its angular size, expansion velocity111 Even if we accounted for the fact that the real expansion velocity of the shock front is larger by 10%–20% than the observed velocity (Schönberner et al., 2005b), the kinematical age of A 30 would still be large, 10,500 yr. (38.51.0 km s-1, Meaburn & López, 1996) and distance (1.7 kpc, Cahn et al., 1992).
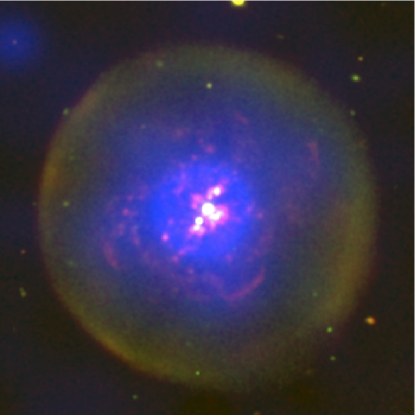
Deep [O iii] images of A 30 (Figure 1-center) reveal a different picture. The round nebular shell is filled by a delicate system of arc-like features that extend up to 30″ from the central star and depict a cloverleaf pattern (Jacoby, 1979). More remarkably, a series of knots are detected just a few arcsecs from the central star. These knots are resolved by HST Wide Field Planetary Camera 2 (WFPC2) [O iii] images (Figure 1-right) to be distributed along a disk and two bipolar outflows (Borkowski et al., 1995), a physical structure later confirmed by the spatio-kinematical study carried out by Chu, Chang, & Conway (1997). The knots are found to be extremely faint in H i recombination lines222 The [N ii] 6548,6583 and He ii 6560 to H line ratios for the bipolar knots are 2.1, 6.3, and 2.4, respectively (Wesson et al., 2003). The emission detected at the position of these knots in the H image (Figure 1-left) consists mostly of [N ii] and He ii emission, rather than H emission itself, given the 60 Å bandwidth of the H filter used for these observations. (Wesson et al., 2003) implying low content of hydrogen with a He/H abundance ratio of 10.8–11.6 and very high metal abundances of C/H0.45, N/H0.30 and O/H1.30 (Jacoby & Ford, 1983; Guerrero & Manchado, 1996; Wesson et al., 2003; Ercolano et al., 2003). These knots and the central star of A 30 are embedded in large amounts of circumstellar dust (Borkowski et al., 1994) with anomalous carbonaceous composition (Greenstein, 1981). Apparently, these hydrogen-depleted knots have been ejected only recently by the central star of A 30, in contrast to the old and hydrogen-rich outermost round shell.
The hydrogen-deficient nature of the CSPN of A 30 and the presence of hydrogen-poor ejecta near the star inspired the born-again PN scenario (Iben et al., 1983) (also known as “very late thermal pulse” or VLTP) in which the thermonuclear burning of hydrogen in the remnant stellar envelope builds up the amount of helium until its fusion into carbon and oxygen is ignited (see, e.g., Herwig et al., 1999; Althaus et al., 2005; Lawlor & MacDonald, 2006; Miller Bertolami & Althaus, 2006; Miller Bertolami et al., 2006, for recent theoretical studies of this phenomenon). Since the remnant envelope is shallow, the increase of pressure from this last helium shell flash leads to the ejection of the newly processed material in the envelope, while the stellar structure remains intact. As the remnant envelope expands, the stellar effective temperature decreases and the star returns to the AGB phase. The stellar evolution that follows this event is fast and will take the star back toward the post-AGB track in the HR diagram (see, e.g., Figures 5 and 8 in Miller Bertolami et al., 2006): the envelope of the star contracts, its effective temperature increases and a new fast stellar wind develops. In a sense, the PN is born-again.
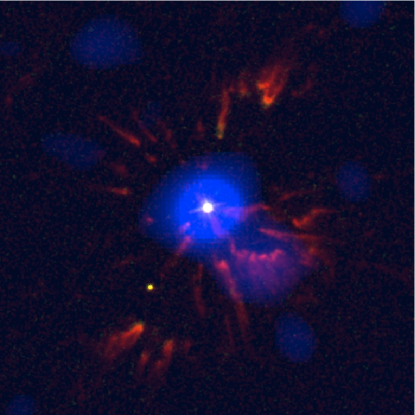
The fast stellar wind will blast the hydrogen-poor material ejected by the star during the born-again event and the subsequent born-again AGB phase. This interaction has been captured by HST WFPC2 images of the vicinity of the central star of A 30 (Borkowski et al., 1995). The hydrogen-poor knots of A 30 display a cometary appearance with either bow-shock structures pointing toward the central star or compact cores with fanning tails pointing away from the central star (Figure 1-right) whose expansion velocities increase outward up to 200 km s-1 (Meaburn & López, 1996; Chu, Chang, & Conway, 1997). Soft X-ray emission from the mixture of shocked stellar wind and evaporated material can be expected (Borkowski et al., 1995), and has been confirmed by ROSAT PSPC serendipitous observations that revealed a source of soft X-ray emission at a plasma temperature 3105 K (Chu & Ho, 1995). A follow-up ROSAT HRI observation showed a central point source and hints of diffuse emission associated with the innermost hydrogen-poor knots, although the detection of the diffuse emission is uncertain due to the low S/N ratio (Chu, Chang, & Conway, 1997).
We have obtained Chandra and XMM-Newton observations of A 30 in order to accurately determine the spatial and spectral properties of its X-ray emission. The results are analyzed in conjunction with the physical properties of its stellar wind determined from refined non-LTE model fits to optical and UV spectra. Multi-epoch HST archival images have also been used to search for proper motions of the hydrogen-poor knots in order to assess their angular expansion rate and to investigate their interactions with the fast stellar wind.
In the following, we first investigate in Sect. 2 the stellar wind properties of the CSPN of A 30, given the implications for the X-ray emission, and determine the proper motions of the hydrogen-poor knots in Sect. 3. The X-ray observations and the spatial and spectral properties of the X-ray emission are described in Sect. 4 and the results are discussed in Sect. 5. The conclusions are presented in Sect. 6.
2 Non-LTE Analysis of the CSPN of A 30
Optical and UV spectra of the CSPN of A 30 have been analyzed using calculations performed with the Potsdam Wolf-Rayet (PoWR) model atmosphere code (Hamann & Gräfener, 2004, and references therein). This code solves the non-LTE radiative transfer for a spherically expanding atmosphere, accounting for complex model atoms and line blanketing, to derive basic stellar and wind parameters. The calculations applied here include He, C, N, O, Ne, and the elements of the iron-group (the latter in the superlevel approximation).
The UV spectra of the CSPN of A 30 were observed by the Far Ultraviolet Spectroscopic Explorer (FUSE) and International Ultraviolet Explorer (IUE) satellites. Data from these observations have been retrieved from MAST, the Mikulski Archive for Space Telescopes at the Space Telescope Science Institute333 The Space Telescope Science Institute (STScI) is operated by the Association of Universities for Research in Astronomy, Inc., under NASA contract NAS5-26555.. The FUSE observations of A 30 in the spectral range 920–1180 Å consisted of the data set B0230101 obtained on 2001 April 10 with the LWRS aperture for a total useful exposure time of 4.1 ks (Guerrero & De Marco, in preparation). Similarly, the IUE observations of A 30 in the spectral range 1150–3200 Å consisted of the data sets SWP07955LL and LWR06930LL obtained on 1980 February 15 with total exposure times of 1.5 and 3.0 ks, respectively. Complementary high-dispersion optical spectra of the CSPN of A 30 were obtained using the Ultraviolet and Visual Echelle Spectrograph (UVES) on the 8m UT2 of the VLT at Paranal Observatory on 2003 February 19 in the framework of the large project 167.D-0407 (PI: Napiwotzki). The observations consisted of two 300 s exposures that covered the spectral regions 3290–4525 Å, 4605–5610 Å and 5675-6642 Å.
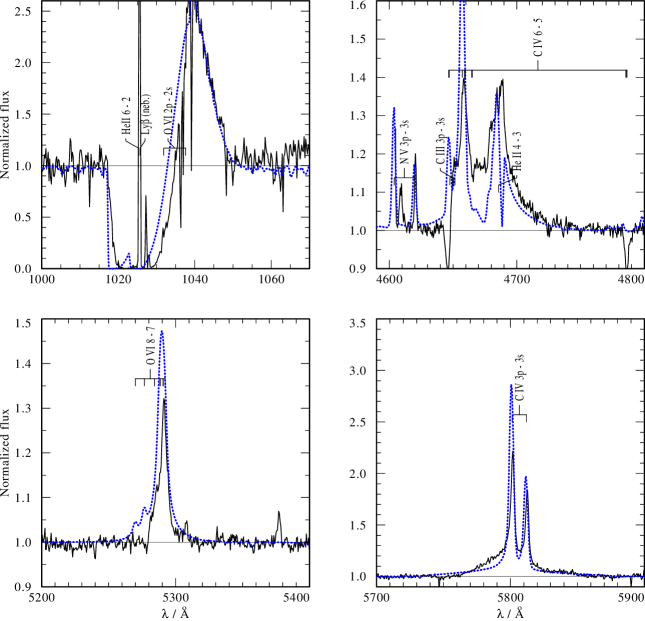
In spite of the limited number of spectral lines useful for analysis provided by the UV and optical spectra of the CSPN of A 30, a reasonable fit (see Fig. 2) is achieved for the set of parameters compiled in Table 1. For the fit we adopted a stellar luminosity of 6,000 , noting that the stellar radius, mass-loss rate and distance scale with luminosity according to the relations shown in Table 1. The distance of 1.76 kpc, similar to the statistical distance of 1.69 kpc provided by Cahn et al. (1992), will be used hereafter. The CSPN of A 30 is confirmed to be very hot ( kK), and the emission line spectrum originates from a stellar wind composed predominantly of helium, carbon and oxygen, which is typical for the [WC] spectral type.
Besides small changes in the values of the stellar temperature and helium and carbon abundances, the present results do not differ appreciably from those previously reported by Leuenhagen, Koesterke, & Hamann (1993) based on a much earlier version of our model atmosphere code without the inclusion of iron-line blanketing. The major difference between the current and earlier calculations, however, is induced by the inclusion of clumping and mass-loss rate () effects. In the “microclumping” approximation (e.g., Hamann & Koesterke, 1998), the emission line fit yields the product where , the so-called “clumping factor”, is difficult to constrain. The current calculations adopt a value of 10 for , which has been proven to be an adequate choice for massive WC stars. The only study for the wind of a CSPN (Todt et al., 2008) came to a similar result, although this parameter was poorly constrained. A value of 10 for the clumping factor leads in the present calculations to a mass-loss rate ( yr-1) 2.5 times lower than the value derived by Leuenhagen, Koesterke, & Hamann (1993).
According to our calculations, the stellar wind of the CSPN of A 30 has a He:C:N:O element number ratio 100:11:0.7:6.0, i.e., it is carbon rich with a C/O ratio 1.8. It is interesting to compare these chemical abundances with those of the hydrogen-deficient knots, where the He:C:N:O element number ratio is 100:4.0:2.7:11.6 (Wesson et al., 2003; Ercolano et al., 2003). The low C/O ratio of the hydrogen-poor knots, 0.3, is at variance with the stellar wind, and is also in contradiction to theoretical models of born-again PNe that predict C/O higher than unity (e.g., Iben et al., 1983; Herwig et al., 1999; Miller Bertolami et al., 2006).
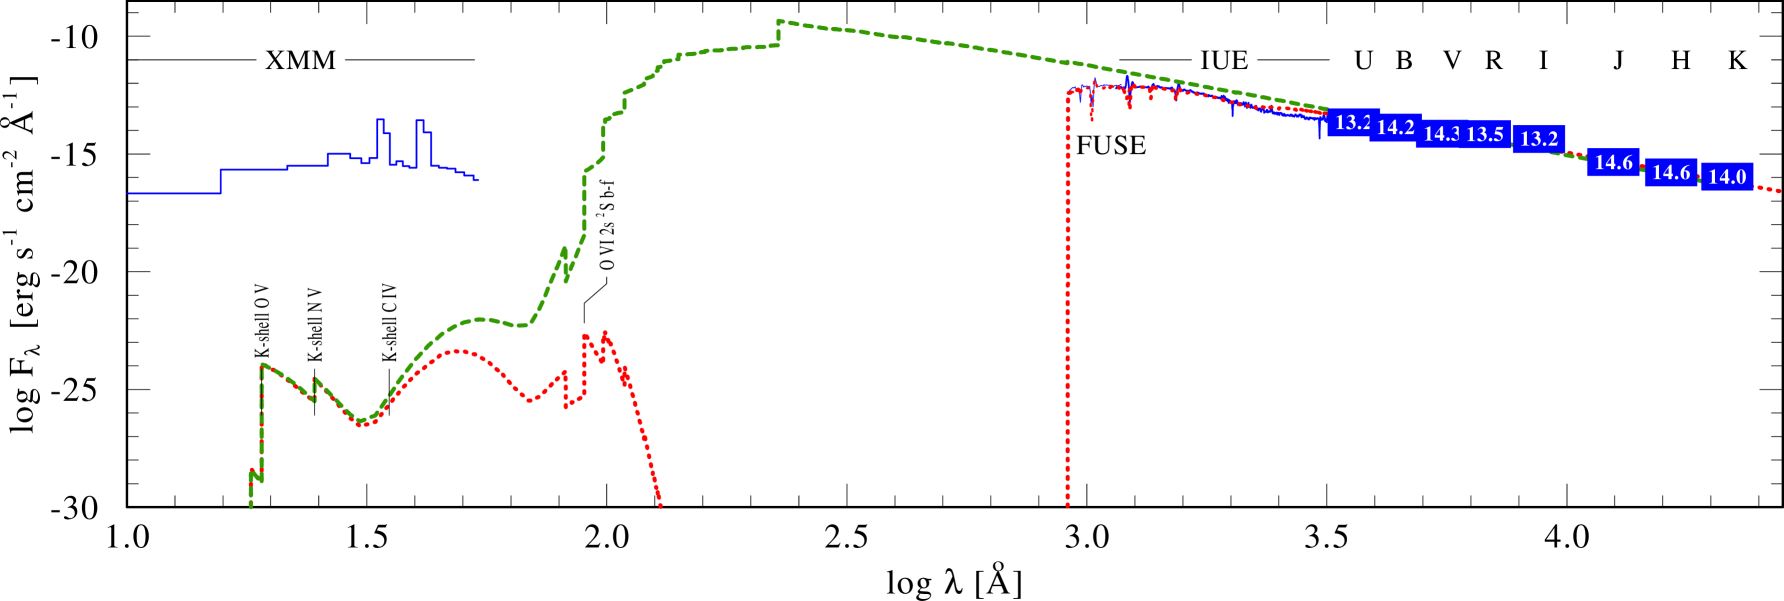
Finally, the spectral fit of the UV and optical spectra of A 30 (Fig. 2) has allowed us to build its spectral energy distribution (SED) shown in Figure 3. The fit of the SED shown in Fig. 3 requires only a small interstellar reddening with =0.18 mag that corresponds to a hydrogen column density =(6.81.9)1020 cm-2 according to the relation /=3.81021 cm-2 mag-1 prescribed by Groenewegen & Lamers (1989). We note that the interstellar extinction law of Cardelli et al. (1989) used to deredden the observed spectral data does not reproduce properly the UV absorption at 2470 Å which is attributed to carbonaceous dust (Greenstein, 1981), and thus the value of the hydrogen column density given above is suspect.
3 Proper Motions of the H-poor Knots of A 30
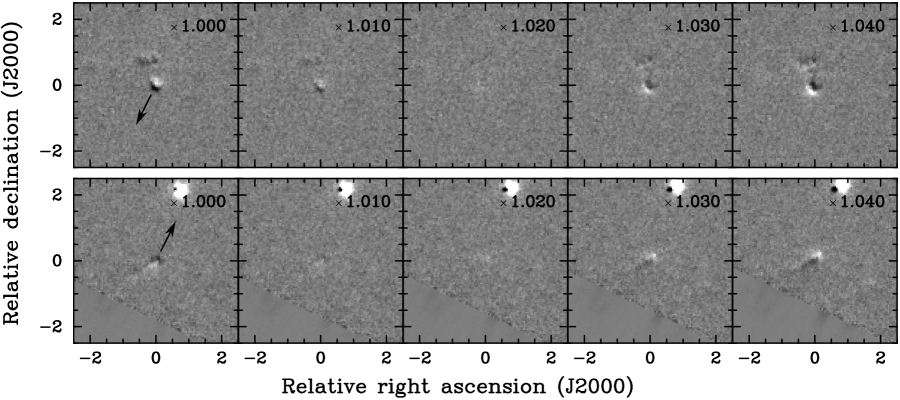
The original HST WFPC2 narrow-band [O iii] images of A 30 (Fig. 1-right) were obtained on 1994 March 6 (epoch 1994.2), but we noticed that the HST archive also contained Wide Field Camera 3 (WFC3) images obtained through the F555W filter on 2009 December 31 (epoch 2010.0). It is reasonable to compare these images, taken 15.8 yr apart, because the nebular emission registered by the F555W filter is mostly dominated by the [O iii] emission lines. Such comparison indeed unveils the proper motion of the hydrogen-poor knots of A 30, as shown in Figure 4. Following the method used by Reed et al. (1999) to study the angular expansion of NGC 6543, we have magnified the earlier epoch image (the F502N image) by several factors and produced the residual maps shown in Fig. 4. These maps suggest that the hydrogen-poor knots of A 30 have expanded 2%.
A detailed analysis of the location of both bipolar and equatorial knots along different directions in the images of the two epochs has allowed us to refine this result and conclude that the 1994.2 image needs to be magnified by 1.0190.003 in order to match the 2010.0 image. Such 1.9% expansion in a time lapse of 15.8 yr implies an expansion age of 850 yr that can be interpreted as the time since the born-again episode took place circa ad 1160.
The angular expansion rate can also be used to estimate the averaged expansion velocity of the knots in the equatorial ring. Assuming that the equatorial ring is circular in shape, its major axis lies on the plane of the sky and thus the semimajor axis of 48 implies a radius of 0.041 pc at a distance of 1.76 kpc. For an age of 850 yr, an averaged expansion velocity of 50 km s-1 is derived.
Finally, we note the presence of a star 525 from the CSPN of A 30 at PA144°. The possible physical connection of this star with the CSPN of A 30 was used by Ciardullo et al. (1999) to estimate a distance of 2020 pc toward A 30. The comparison between the 1994.2 and 2010.0 epoch images reveals a change of 015 in the position of this star relative to the location of the CSPN of A 30. This shift is much larger than the orbital motion expected in the time lapse of 15.8 yr for a companion star with the orbital separation of 10,580 AU estimated by Ciardullo et al. (1999). We therefore conclude that this star and the CSPN of A 30 do not form a binary system, but they are rather optical doubles. Consequently, the distance estimate of 2020 pc is not valid and should not be used.
4 X-ray Observations of A 30
A 30 was observed by XMM-Newton on 2009 October 21 (Observation ID 0605360101, PI: W.-R. Hamann) using the European Photon Imaging Camera (EPIC) and the Reflection Grating Spectrometer (RGS) instruments for a total exposure time of 58.2 ks. The EPIC observations were performed in Full Frame Mode with the Thin Filter. The second version of the observation data files (ODFs) generated by the XMM-Newton Science Operation Center on 2010 June 18 were processed using the XMM-Newton Science Analysis Software (SAS) 10.0.2. Reprocessed EPIC-MOS, EPIC-pn and RGS event lists were created using the SAS tools “emproc”, “epproc” and “rgsproc”, respectively, and the most up-to-date XMM-Newton calibration files available on the Current Calibration File (CCF) as of 2010 September 15. The original exposure times were 40.88, 41.08, 37.23, 57.43 and 57.47 ks for EPIC-MOS1, EPIC-MOS2, EPIC-pn, RGS1 and RGS2, respectively, but the last segment of the observations was dramatically affected by periods of high background. After excising these periods from the data, the resulting useful exposure times amount to 31.63 ks for EPIC-MOS1, 31.31 ks for EPIC-MOS2, 24.58 ks for EPIC-pn, 31.81 ks for RGS1 and 31.53 ks for RGS2.
A 30 was subsequently observed by Chandra on 2011 January 1 (Observation ID 12385, PI: Y.-H. Chu) using the array for spectroscopy of the Advanced CCD Imaging Spectrometer (ACIS-S) for a total exposure time of 96.09 ks. The nebula was imaged on the back-illuminated CCD S3 using the VFAINT mode. No periods of high background affected the data and the resulting useful exposure time amounts to 96.08 ks after excising dead-time periods. The Chandra Interactive Analysis of Observations (CIAO) software package version 4.3 was used to analyze these data.
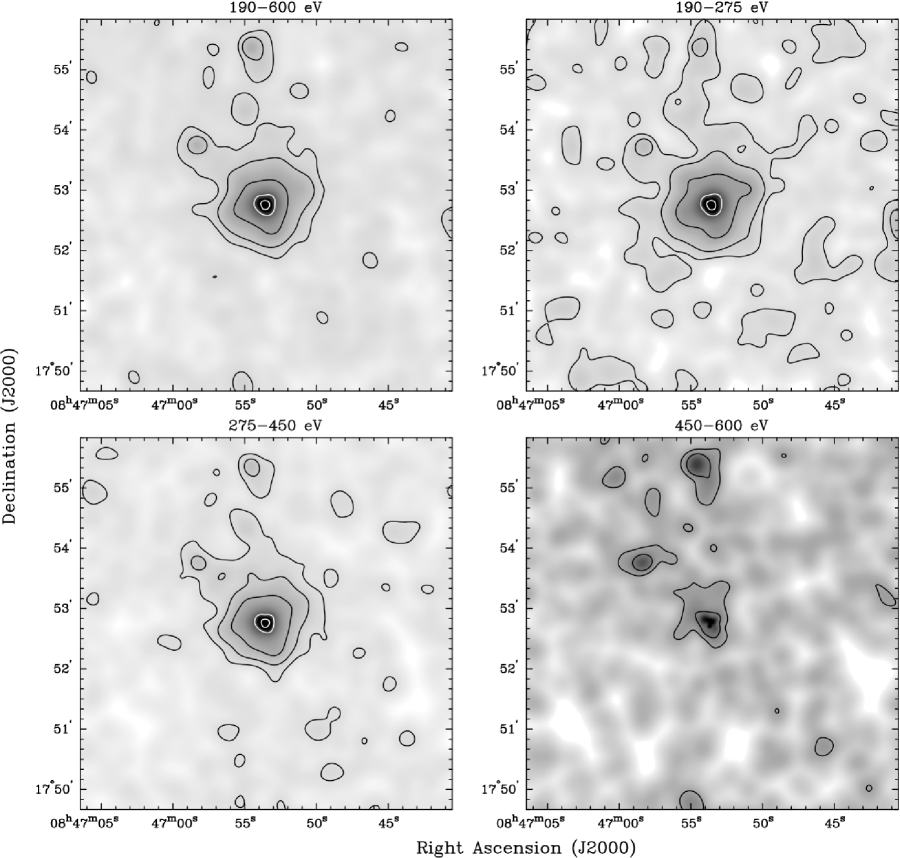
The XMM-Newton EPIC observations detect a relatively bright source at the location of the central star of A 30. An inspection of the images at different energy bands shown in Figure 5 indicates that this source is soft, with emission from the lowest energies detectable by the EPIC cameras up to 0.6 keV, above which little or no emission is seen. Similarly, the Chandra observations detected a soft source at the position of the CSPN of A 30. The EPIC-pn, EPIC-MOS and ACIS-S background-subtracted count rates and net number of counts detected in different energy ranges are provided in Table 2.
4.1 Spatial Properties of the X-ray Emission from A 30
In order to study the spatial distribution of the X-ray emission from A 30, we have produced EPIC images of A 30 in different energy bands (Figure 5) by extracting the individual EPIC-pn, EPIC-MOS1 and EPIC-MOS2 images, mosaicing them together, applying the exposure map correction, and smoothing the images. We have also produced a Chandra ACIS image in the 200-600 eV energy band. The Chandra and XMM-Newton X-ray images are compared to optical narrow-band images and previous ROSAT X-ray images in Figure 6.
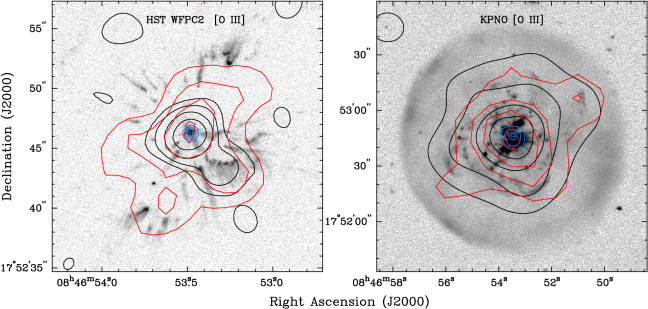
The small-scale spatial distribution of the X-ray emission is revealed by the comparison between the Chandra ACIS-S and HST WFPC2 [O iii] images shown in Figure 6-left. Most of the emission detected in the Chandra ACIS-S image corresponds to a point source coincident with the central star of A 30, but some additional emission, 8.23.5 counts, is found 4″ to the southwest of A 30 CSPN. This emission is soft, with a median energy 0.30 keV, and seems spatially coincident with an [O iii] bright knot in the equatorial ring of the hydrogen-poor ejecta. Given the extremely low count level of the ACIS-S background in the soft energy band, 0.025 counts arcsec-2, the probability that this source were a statistical fluctuation in the background is negligible, 10-6. Furthermore, Figure 6 shows that this source is coincident with one of the brightest patches of diffuse X-ray emission suggested by ROSAT HRI images (Chu, Chang, & Conway, 1997).
The large-scale spatial distribution of the X-ray emission is illustrated by the comparison between the XMM-Newton EPIC and ground-based [O iii] images shown in Figures 5 and 6-right. The X-ray emission in the XMM-Newton EPIC image peaks at the location of the central star, in agreement with the Chandra ACIS-S image. The image does not show any obvious diffuse X-ray emission associated with the round outer shell of A 30. Instead, the X-ray peak at the central star is surrounded by a “halo” of diffuse emission whose spatial distribution is consistent with that revealed by ROSAT PSPC observations at a poorer spatial resolution (Chu & Ho, 1995). There is a tantalizing correlation between the XMM-Newton EPIC X-ray contours of this diffuse X-ray emission and the “petals of the cloverleaf” pattern interior to the round outer shell.
To further assess whether this X-ray emission is extended, we have used the SAS 10.0 task “eradial” to extract a radial profile of the X-ray emission from A 30 and fit it to the theoretical XMM-Newton EPIC-pn PSF that can be described as a King function with core 55 and exponent 1.6. However, a direct fit to the radial profile has yielded inconclusive results because A 30 is located at 70″ from a chip gap in the EPIC-pn camera, and thus does not allow the extraction of a sufficiently extended radial profile to accurately assess the background level for the PSF fit. The EPIC-MOS images are not useful for this purpose as they lack sufficient statistical significance.
To overcome these difficulties, we have compared a bright, soft point source (Nova LMC1995, Orio et al., 2003) with A 30. A preliminary inspection of the soft images of A 30 and Nova LMC1995 is also inconclusive because Nova LMC1995 also seems to be surrounded by a halo of diffuse emission most likely associated with the PSF of the EPIC-pn. A close comparison of the radial profiles of A 30 and Nova LMC1995 (Figure 7-left) built using the SAS task “eradial” finally found evidence suggesting that the radial profile of A 30 departs from that of a point source at distances 13″. To reinforce this result, we have also determined the count rate in circular annuli centered on A 30 and Nova LMC1995. The comparison, shown in Figure 7-right, confirms that A 30 shows additional emission peaks at distances 13″, further strengthening the conclusion that A 30 displays extended X-ray emission. The limited spatial resolution of the XMM-Newton EPIC-pn observations, however, makes it impossible to estimate the extent and distribution of this diffuse emission within 20″ from the central star of A 30. An attempt to remove the emission from the point source has been made by using a point source model derived from the observation of Nova LMC1995 and scaled to the emission peak of the CSPN of A 30. The residual diffuse emission is basically consistent with the contours shown in Figure 6-right.
4.2 Spectral Properties of the X-ray Emission from A 30
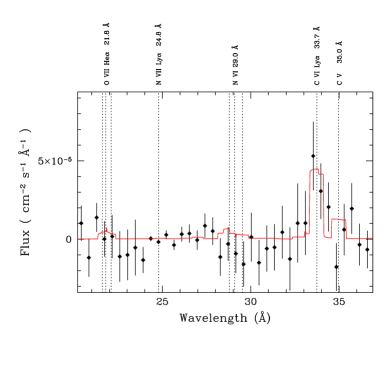
To study the spectral properties of the X-ray emission from A 30, we have extracted the EPIC-pn and EPIC-MOS background-subtracted spectra of A 30 shown in Figure 8-left. The spectra are extremely soft even when compared to those of diffuse emission from other PNe (e.g., NGC 6543, Chu et al., 2001). The EPIC-pn spectrum, which has the best signal-to-noise ratio, peaks at 0.35 keV with a shoulder or slow decline toward lower energies and a rapid drop in the energy interval from 0.35 keV to 0.5 keV. There is much fainter emission at 0.58 keV, but no further emission is detected above 0.6 keV. A comparison with optically thin plasma emission models of different chemical abundances suggests that the emission at 0.35 keV may correspond to either the C vi lines at 33.7 Å (0.37 keV) or the C v lines at 35.0 Å (0.35 keV), while the weak feature at 0.58 keV seems consistent with the O vii triplet at 21.8 Å (0.57 keV). Similarly, the rapid decline above 0.35 keV seems consistent with plasma emission models for which the contribution from the N vi 0.43 keV and N vii 0.50 keV emission lines is rather small. The RGS spectrum of A 30, despite having a limited signal-to-noise ratio (Figure 8-right), has allowed us to identify the emission peak in the EPIC-pn spectrum of A 30 as the Ly line of C vi at 33.7 Å (0.37 keV) and to confirm that there is no significant contribution from nitrogen lines.
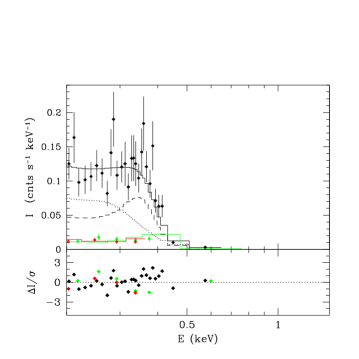
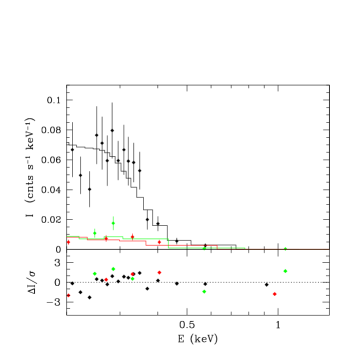
Since the analysis of the radial profile of X-ray emission from A 30 reveals extended emission, we have extracted separate spectra for the central source from a circular region of radius 12″ and for the diffuse emission from an annular region with a 20″ inner radius and a 35″ outer radius. The background-subtracted EPIC-pn and EPIC-MOS spectra of the central source and diffuse emission are shown in Figure 9 and their count rates and count numbers are listed in Table 2. The comparison of the spectra of the diffuse emission and point source suggests spectral differences, with the diffuse emission spectrum lacking the peak at 0.37 keV associated with the C vi line and having a relatively more important contribution of the O vii triplet at 0.57 keV.
4.3 Spectral Analysis
4.3.1 X-ray Emission Model for A 30
The EPIC and RGS spectra of A 30 imply the presence of emission lines, thus suggesting that the X-ray emission from A 30 can be modeled using an optically thin plasma emission model. The Astrophysical Plasma Emission Code (APEC) v1.3.1 available within XSPEC v12.3.0 (Arnaud, 1996) was used for the spectral analysis of the EPIC spectra, adopting the chemical abundances of the stellar wind derived from our non-LTE model listed in Table 1.
Alternatively we may consider charge transfer reactions between heavy ions in the stellar wind and material from the hydrogen-poor knots and dust in the central regions of A 30, as is typically detected in comets in the solar system (e.g., Lisse et al., 1996; Dennerl et al., 1997), as well as in a broad variety of astrophysical objects including the interstellar medium, stellar winds and galaxies (see Dennerl, 2010, for a review). The X-ray emission associated with charge transfer reactions in comets can be described by emission lines of the ions involved in these reactions with little or negligible continuum (“bremsstrahlung”) emission. Our model of charge transfer reactions for the X-ray emission from A 30 will consist of the emission lines in the spectral range 0.2–0.7 keV of the most important species in the stellar wind of the CSPN of A 30: C v 0.31 keV, C vi 0.37 keV, N vi 0.43 keV, N vii 0.50 keV, O vii 0.57 keV, and O viii 0.65 keV.
4.3.2 X-ray Absorption Model for A 30
The X-ray emission from the hot plasma in A 30 is certainly absorbed, but the nature, properties, and amount of the absorbing material need to be elaborated. The extinction towards the central star of A 30 seems to be relatively high: Cohen et al. (1977), Greenstein (1981), and Jeffery (1995) derived interstellar extinctions of =0.90.1 mag, =0.30 mag, and =1.18 mag, respectively, whereas we have determined it to be =0.180.05 mag. As for the extinction towards the central knots, Wesson et al. (2003) derived (H)=0.60. All these values are in sharp contrast with the low, almost negligible extinction affecting the outer shell of A 30 (Guerrero & Manchado, 1996), thus suggesting that the origin of the extinction is mostly circumstellar.
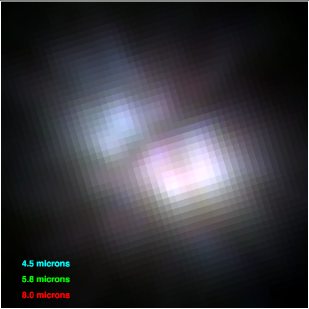
The presence of circumstellar dust is indeed revealed by mid-IR and near-IR observations of the innermost regions of A 30 (e.g., Borkowski et al., 1994; Phillips & Ramos-Larios, 2007). More recent Spitzer archival images (Hart et al., 2011) clearly show the spatial coincidence between the mid-IR emission in the IRAC bands and the disk and bipolar jet features in HST [O iii] images (Figure 10). The correspondence between the spatial distributions of dust and born-again ejecta and the anomalously high carbon composition of the dust (Greenstein, 1981; Jeffery, 1995) suggest that this dust is formed by material ejected during the VLTP event. Consequently we will assume that the absorbing material has a chemical composition similar to that of the hydrogen-poor knots, i.e., H:He:C:N:O:Ne = 1:11.2:0.47:0.29:1.33:0.56 by number (Wesson et al., 2003). Although this absorbing material presents noticeable absorptions at the energy of the carbon and oxygen K shells, we must note that at the spectral resolution of the EPIC instruments, the overall shape of the absorption curve of this metal rich material is similar, within a factor 1.5, to that of typical interstellar material.
As for the amount of absorbing material, we have performed a simultaneous spectral fit of the XMM-Newton EPIC-pn and EPIC-MOS, and ROSAT PSPC spectra of A 30 using an APEC optically thin plasma emission model with stellar wind abundances absorbed by material with the abundances of the hydrogen-poor knots. The fit is not impressively good (d.o.f.=199.6/962.1), but it clearly constrains the hydrogen column density at a value 21015 cm-2, with a 3- upper limit 11016 cm-2, for a plasma temperature of 0.0700.005 keV (Table 3) and observed flux and intrinsic luminosity in the 0.2-1.5 keV energy range of 1.010-13 erg cm-2 s-1 and 4.41031 erg s-1, respectively. Much higher column densities are proscribed by the emission detected in the softest energy channels of the EPIC spectra and very notably of the ROSAT PSPC spectrum. We note that the value of the hydrogen column density derived from this fit is significantly smaller than those typical of interstellar material for PNe, in the range 1019–1022 cm-2, because the content in helium, carbon and oxygen assumed for the absorbing material is much higher than for the interstellar gas.
Incidentally, we note that the normalization factors of the EPIC and PSPC spectra are similar, within 10%. Given the relative calibration uncertainties, the total X-ray fluxes from A 30 determined by ROSAT PSPC on 1993 May and by XMM-Newton EPIC on 2009 October are consistent with each other and imply little long-term variability.
4.3.3 Spectral Fits for Plasma Emission
The absorbed APEC optically thin plasma emission model provides a reasonable fit to the EPIC-pn and EPIC-MOS spectra of the diffuse emission for a best-fit value of the temperature =0.068 keV (=0.79106 K) at a fixed hydrogen column density of 21015 cm-2 (Table 3). The observed flux in the 0.2-1.5 keV energy range is 2.810-14 erg cm-2 s-1, and the intrinsic luminosity is 1.31031 erg s-1.
This same model does not provide a good fit (reduced ) to the EPIC-pn and EPIC-MOS spectra of the central source of A 30 because it cannot reproduce the emission peak at 0.37 keV. The addition of an emission line at this energy improves significantly the fit (Table 3) for a fixed hydrogen column density =21015 cm-2 and best-fit value of =0.0680.003 keV (=0.79106 K). For this model we derive an observed flux in the 0.2-1.5 keV energy range of 7.210-14 erg cm-2 s-1, and an intrinsic luminosity 3.11031 erg s-1.
The inclusion of an emission line at 0.37 keV is highly indicative of increased emission of the C vi line at 33.7 Å which can be attributed to an enhancement of the carbon abundances or to a higher temperature plasma component. Neither possibilities seem to work: the enhancement of carbon abundances increases both the emission of the C v and C vi lines without a net improvement of the spectral fit, whereas the inclusion of a higher temperature component produces noticeable emission above 0.45 keV which is not supported by the observed spectrum.
4.3.4 Spectral Fits for Charge Transfer Reactions
In this case, the spectral model consists of the emission lines of C v 0.31 keV, C vi 0.37 keV, N vi 0.43 keV, N vii 0.50 keV, O vii 0.57 keV, and O viii 0.65 keV at a fixed absorption hydrogen column density of 31015 cm-2. This model also yields good fits for the emission from the CSPN and the diffuse component (Table 4). The intensities of the different emission lines for the best fit models listed in Table 4 indicate that C v 0.31 keV (40.2 Å) is the prevalent line, with a significant contribution of the C vi 0.37 keV (33.7 Å) in the central source. Unfortunately, the RGS spectral coverage is limited to the 5–38 Å wavelength range and these observations did not provide confirmation of the prevalence of the C v line. Small contributions of the O vii 0.57 keV (21.8 Å) line to the diffuse emission and central source are also derived from these fits. On the other hand, the contribution from emission lines of nitrogen is found to be negligible both for the diffuse component and for the CSPN in agreement with its lower abundance in the stellar wind and born-again ejecta.
5 Discussion
The new Chandra and XMM-Newton observations of A 30 have confirmed the extremely soft X-ray emission previously detected by ROSAT PSPC and HRI (Chu & Ho, 1995; Chu, Chang, & Conway, 1997) and resolved the X-ray emission into a point source and diffuse emission. The comparison between the X-ray and optical images of A 30 allows us to unambiguously associate the X-ray point source with its CSPN. On small angular scales, as probed by Chandra and earlier suggested by ROSAT HRI images (Chu, Chang, & Conway, 1997), the spatial coincidence of the diffuse X-ray emission with the [O iii] bright knots (Figure 6-left) strongly supports the association of the diffuse X-ray emission with the innermost hydrogen-deficient knots. On larger angular scales, as probed by XMM-Newton, the diffuse X-ray emission pervades the central regions of the nebula and fills the cloverleaf structure (Figure 6-right). No diffuse X-ray emission is found in the gap between the cloverleaf structure and the edge of the outer round shell.
We next describe in detail the formation and evolution of A 30 in order to assess which processes can be involved in the production of the diffuse and point-source X-ray emission from this nebula.
5.1 Formation and Evolution of A 30
The outer shell of A 30 formed 12,500 yr ago from an ordinary AGB wind and was shaped by the stellar radiation field and hydrogen-rich fast wind of the post-AGB star. We see now the relics of this evolution: a large, nearly spherical shell of low density and moderate expansion velocity.
About 850 yr ago, the CSPN of A 30 experienced a VLTP episode which led to the sudden ejection of highly processed hydrogen-poor, carbon-rich material. At that time, the stellar envelope expanded and the star returned to the AGB phase, but shortly afterward the envelope contracted and the star moved to the post-AGB evolutionary track in time-scales as short as 5–20 yr (Iben & MacDonald, 1995; Miller Bertolami et al., 2006). We can thus expect that, during the AGB phase after the VLTP episode, a new carbon-rich wind of low speed blew into the nebular cavity. Later, as the star contracted, this carbon-rich wind accelerated up to the present terminal velocity of 4000 km s-1 revealed by UV spectra of the CSPN of A 30.
This description of the born-again event and subsequent evolution of the stellar wind of A 30 is limited by our poor understanding of the born-again and post-born-again evolution, based on the very small sample of known born-again PNe, besides A 30: A 58 (a.k.a. V605 Aql, Seitter, 1987), A 78 (Jacoby & Ford, 1983), and Sakurai’s object (a.k.a. V4334 Sgr, Duerbeck & Benetti, 1996). The duration and properties of the wind during the AGB phase after the born-again event are particularly poorly known. In Sakurai’s object, a post-born-again stellar wind with mass-loss rate up to 1.610-5 yr-1 (Tyne et al., 2002) and terminal velocity 670 km s-1 (Eyres et al., 1999) is detected just a few years after the born-again event. In A 58, the properties of the present stellar wind, with a diminished mass-loss rate of 110-7 yr-1 and a terminal velocity 2500 km s-1 (Clayton et al., 2006), indicate that 82 yr after the VLTP event the star has already returned to the post-AGB evolutive track. It thus seems that, after a born-again event, a post-born-again wind with mass-loss rates 10-5–10-6 yr-1 and terminal velocity of a few hundred km s-1 can be expected for a short phase (few years). This wind is immediately superseded by a fast stellar wind.
The post-born-again and present fast stellar winds will overtake and ablate the hydrogen-poor clumps ejected during the born-again event to produce fanning tails and cavities similar to those predicted by Steffen & López (2004). This interpretation is consistent with the nebular features moving at speeds as high as 200 km s-1 that have been associated with the fanning tails of the hydrogen-poor bipolar knots described by Meaburn & López (1996) and Chu, Chang, & Conway (1997). A close inspection of the [O iii] echelle spectra presented by Meaburn & López (1996) and those available in the “SPM Kinematic Catalogue of Galactic Planetary Nebulae” (López et al., 2012) reveals faint features along the central line of sight and associated with some cloverleaf features moving at speeds up to 400 km s-1. It is worthwhile to note that similar features, moving at speeds of 250 km s-1, are found in the hydrogen-poor ejecta of A 78 (Meaburn et al., 1998).
These features can be interpreted as signatures of the post-born-again wind in which the hydrogen-poor knots are embedded. We note that the filaments of the cloverleaf structure are not detected in the H image, thus suggesting that they consist of hydrogen-poor material. The distance of the outermost cloverleaf filaments to the central star implies a linear size of 1.11018 cm that, in conjunction with the age of 850 yr derived in Sect. 3, result in an expansion velocity 420 km s-1, very similar to the expansion velocity of the post-born-again stellar wind of 400 km s-1. This suggests that the post-born-again wind may have had a foremost contribution in blowing the cloverleaf structure.
5.2 Origin of the Diffuse X-ray Emission
The ISW model of PN formation predicts the production of a “hot bubble” (Kwok, Purton, & Fitzgerald, 1978) filled with X-ray-emitting shocked stellar wind as the result of the interaction of the CSPN fast stellar wind ( km s-1) with the previous slow and dense AGB wind ( km s-1). X-ray observations of PNe (e.g., Kastner et al., 2000; Chu et al., 2001) have detected the diffuse emission from the shocked stellar wind inside hot bubbles of PNe with X-ray luminosities in the range 71029–21032 erg s-1 (Ruiz et al., in preparation). The luminosity and temperature of the X-ray-emitting gas in PNe are satisfactorily reproduced by one-dimensional radiative-hydrodynamic models of the formation of PNe which include thermal conduction at the interface between the shocked wind and the cold outer shell (Steffen et al., 2008). Both observations and models indicate that the X-ray luminosity of PNe decays in short time-scales as the CSPN fades and the nebula expands. For a large, evolved PN such as A 30, no diffuse X-ray emission from the hot bubble enclosed by the AGB wind is expected (Guerrero et al., 2000). Furthermore, we expect the hot bubble to collapse toward the star as it is not supported any longer by the post-AGB wind once it ceased after the VLTP episode.
The correspondence between the spatial distribution of the X-ray emission in A 30 and the cloverleaf structure suggests that the same physical mechanism that generates the X-ray-emitting gas is blowing these petal-like features. The post-born-again stellar wind, with a terminal velocity of 400 km s-1 for A 30 and a mass-loss rate that could have reached up to 10-5–10-6 yr-1, may provide the power to generate the observed X-ray emission. We note, however, that hot bubbles of shocked stellar winds do not form at these wind speeds because of the very efficient line cooling of hydrogen-poor, carbon and oxygen-enriched material (Mellema & Lundqvist, 2002; Sandin et al., 2011).
The large momentum and mechanical luminosity of the current fast stellar wind of A 30 can result in strong interactions with the ejecta in hydrogen-poor knots and have the potential to power the observed diffuse X-ray emission. The volume of this cavity, 2.21054 cm3, and the emission measure of the extended component, 2.91049 cm-3 (Table 3), imply a gas density cm-3, where the gas filling factor is presumably low. The total mass of the X-ray-emitting gas would be 210 and, for a time scale of 850 yr, the averaged mass injection rate of X-ray-emitting gas is 310 yr-1, which is consistent with the mass-loss rate of the present stellar wind, 210-8 yr-1, derived in Sect. 2.
The temperature of the X-ray-emitting plasma detected in A30, keV, is much too low compared to the post-shock temperature expected from a stellar wind with a terminal velocity of 4000 km s-1. Even when heat conduction is considered in models of hot bubbles in PNe, the expected temperature of the X-ray-emitting gas for a wind with such a terminal velocity is in the range 0.13–0.43 keV (Steffen et al., 2008). We note here that the hydrogen-poor, carbon- and oxygen-rich nature of the X-ray-emitting gas implies very efficient line cooling (Mellema & Lundqvist, 2002) which can be invoked in conjunction with heat conduction to reduce the temperature of the shocked stellar wind (Steffen et al., 2012).
Alternatively, the origin of such low temperatures lies in the complex interactions between the post-born-again and present fast stellar winds of A 30 and the hydrogen-poor ejecta, as illustrated by the hydrodynamic simulations presented by Steffen & López (2004) and Pittard (2007). The hydrogen-poor knots are photoevaporated by the strong UV radiation flux of the CSPN and subsequently swept-up by the fast stellar winds, which also entrain the H-poor gas ejected after the VLTP episode to form the petal-like features seen in the outer shell. As a result, material with high metal content can be transferred to the shocked stellar wind in three different ways (see Arthur, 2007; Pittard, 2007): (1) hydrodynamic ablation, (2) conductively-driven thermal evaporation, and (3) photoevaporation. By increasing the density and damping the velocity of the stellar wind, these processes will lower the temperature of the shock-heated stellar wind (e.g., Arthur, 2012), which will be further reduced by the efficient cooling of the high metal abundances of the plasma.
5.3 Origin of the X-ray Emission at the CSPN of A 30
If we concur that the point-source of X-ray emission at the CSPN of A 30 originates from a hot plasma, its emission measure, as derived from the spectral fits in Sect. 4.3.3, is 4.81049 cm-3. Since the emitting region is unresolved by Chandra, the emission volume must be smaller than a sphere with radius 05, i.e., 11049 cm3. These figures imply a density of 4 cm-3 and a total mass of 610.
The exact mechanism responsible for the production of X-ray-emitting hot plasma at the CSPN of A 30 is uncertain. Several possibilities are considered in the following.
5.3.1 Photospheric Emission of the Hot CSPN
The photospheric emission from hot ( K) CSPNe can be detectable in the soft X-ray domain (Guerrero et al., 2000). Since the CSPN of A 30 has an effective temperature of 115,000 K, its X-ray emission may be attributed to photospheric emission. Figure 3 shows the observed SED together with the stellar model presented in Sect. 2. Whereas there is a good match between the observed SED and predicted stellar model in the UV, optical and IR regimes, besides the 2470 Å UV bump, the X-ray flux predicted by the model is ten orders of magnitude lower than the X-ray flux observed by XMM-Newton. According to the model, the photospheric X-ray emission is mainly blocked by the bound-free and K-shell opacities from C, N and O. Hence Fig. 3 leads us to the firm conclusion that the stellar photosphere of the CSPN of A 30 cannot be the origin of the observed X-rays.
5.3.2 Shocks Within the Stellar Wind
The stellar winds of CSPNe are radiatively driven, i.e., the stellar wind’s momentum is provided by radiation pressure on spectral lines. We can thus expect that the hydrodynamic instability, which is inherent to radiatively driven stellar winds, will lead to shocks embedded in the stellar wind and produce X-ray emission as for the stellar winds of OB and Wolf-Rayet stars (e.g., Feldmeier et al., 1997). The X-ray luminosity of the stellar wind of O stars is found to scale with the bolometric luminosity as (Berghöfer et al., 1997), with a scatter of about one order of magnitude. For this canonical relationship, the stellar luminosity of the CSPN of A 30, (Table 1) would imply an X-ray luminosity from the wind-shock emission of or 3.51030 erg s-1. The expected X-ray emission from wind shocks in the CSPN of A 30 is 50 times lower than observed.
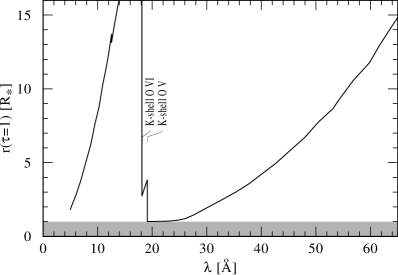
Moreover, the aforementioned - relationship is valid for (massive) O stars, but Wolf-Rayet stars are much fainter in the X-ray domain than O stars. Indeed, the first positive detection of faint X-rays from an WC/WO type star has been only recently reported (Oskinova et al., 2009). The most plausible explanation for the X-ray faintness of Wolf-Rayet stars is that their dense winds are very opaque to X-rays, which are presumed to be produced by shocks located in the zone of strong wind acceleration, deep in the wind at a few stellar radii only. To assess whether the wind-shock X-rays could emerge from the [WC]-type central star A 30, we plot in Figure 11 the prediction of our PoWR model of the CSPN of A 30 for the radius where the optical depth reaches unity vs. wavelength. The wind is basically transparent down to the photosphere at 20 Å (0.62 keV), but at longer wavelengths, the opacity increases and the wind stays optically thick out to 7 stellar radii above 50 Å (0.25 keV). The softest X-rays are expected to suffer the strongest attenuation, contrary to the properties of the observed X-ray spectrum. We thus conclude that the X-ray emission from the unresolved central source of A 30 is not due to shocks embedded in its stellar wind.
5.3.3 Born-again Hot Bubble
The mechanical luminosity () of the present stellar wind of the CSPN of A 30 derived from our PoWR model (cf. Table 1), erg s-1, is 3000 times larger than the observed X-ray luminosity. A small fraction of this mechanical luminosity would be able to power the X-ray emission which is observed at the central source of A 30. As for the diffuse X-ray emission detected in other PNe, the present stellar wind can be heated when it rams into previously ejected slower material to form a hot bubble. The situation in A 30 is different from other PNe due to its born-again history: while the hot bubble of the old, large PN has faded out, a “born-again hot bubble”, powered by the present wind, may be responsible of the X-ray emission at the central source. The observed X-ray temperature is however much lower than the expectations for a shocked stellar wind with terminal velocity of 4000 km s-1. Heat conduction and/or mass loading most certainly need to be invoked to cool the plasma to the observed low temperature.
Whereas the origin of the X-ray emission of the CSPN of A 30 in a born-again hot bubble is able to explain its luminosity, there are critical arguments against this scenario. First, the existence of a hot bubble will trap the present fast stellar wind and prevent its interaction with the hydrogen-poor knots; however, this problem can be mitigated by the post-born-again wind which may have contributed mass to the hot plasma. The second argument against the hot bubble scenario is critical. Hot bubbles in PNe fill the whole volume of the innermost shells detected in the optical (Ruiz et al., in preparation), but the X-ray emission arising from the location of the CSPN of A 30 is unresolved by Chandra. For a radius of 1.31016 cm (i.e., 05 at the distance of A 30), a hot bubble expanding with the velocity of the post-born-again wind (400 km s-1) requires a time of just 10.5 yr, implying that the transition from the post-born-again wind to the present fast stellar wind occurred some time in 1999. This is at odds with the similar X-ray fluxes detected by ROSAT PSPC on 1993 May and XMM-Newton EPIC on 2009 October, and is definitely not supported by the quick transition between the post-born-again and fast stellar winds observed in A 58 (Clayton et al., 2006). We conclude that an unresolved born-again hot bubble is difficult to sustain as the origin of the X-ray emission at the CSPN of A 30.
5.4 Charge Transfer Processes
The spectral analysis described in Sect. 4.3.4 and summarized in Table 4 implies that the observed XMM-Newton EPIC spectra of A 30 can be reproduced by a model consisting only of C v, C vi and O vii lines. Such spectral characteristics are expected if the X-ray emission is produced by charge transfer from the ions of the stellar wind to material of the hydrogen-poor knots or onto the surfaces of dust grains, as in solar system comets (Krasnopolsky, 1997; Lisse et al., 1999; Dennerl, 2010).
As for charge transfer reactions between the stellar wind and neutral material of the hydrogen-poor knots, these are unlikely as we expect the knots to be surrounded by dense ionized outflows (Harrington & Feibelman, 1984; Borkowski et al., 1995) that will impede the stellar wind to penetrate deep into the neutral core of the knot. Ion-ion charge transfer processes, considered for the production of X-ray emission in the winds of hot stars (Pollock, 2012), is plausible as the large kinetic energy of the ions in the stellar wind of A 30 can overcome the Coulumb repulsion of carbon and oxygen ions in the knots. On the other hand, neutralization of highly ionized ions on the surface of dust grains (e.g., Borkowski & Szymkowiak, 1997) can operate because the production of hot dusty plasmas can be expected in the interaction of the fast wind with the born-again ejecta.
We note that these processes must compete with others that can be pressumably important, such as recombinations of the ions of the stellar wind that will reduce the number of available highly-ionized species. An upper limit of the X-ray luminosity produced by charge transfer reactions can be computed from the following relation (Dennerl, 2010):
| (1) |
where is the wind terminal velocity, is the wind ion density at the location of the neutral material, is the fraction of ions capable of releasing an X-ray photon in a charge-exchange reaction, is the photon energy, and is the cross-section of the hydrogen-poor knots. The terminal velocity of the wind ranges from 400 km s-1 for the post-born-again wind up to 4000 km s-1 for the present fast stellar wind, whereas their ion density ranges from 10 to 0.001 cm-3, respectively. According to the spectral fit carried out in Sect. 4.3.4, the spectrum of the diffuse emission of A 30 is dominated by the C v 0.31 keV line. Using the energy of the C v line, assuming all carbon atoms are found as C vi with a particle fraction of 0.09 derived from the chemical abundances of the wind, and adopting a ring-like structure 5″ in radius and 05 tall for the estimate of the cross-section, the expected X-ray luminosity is 2.61029 erg s-1 for the present fast stellar wind and 2.61032 erg s-1 for the post-born-again wind. These figures show that the post-born-again wind may produce significant X-ray emission through charge transfer reactions, whereas the present fast stellar wind can not.
A similar result can be reached for the X-ray emission at the CSPN, where the greater density of the stellar wind at close locations of the CSPN (0.12 cm-3 at 05 from the CSPN) is compensated by the smaller cross-section, so that the maximum attainable X-ray luminosity would be 5.71030 erg s-1. We conclude that, albeit charge transfer can play a role in the production of some the observed X-ray emission, it is unlikely that this mechanism is solely responsible for all observed X-ray flux at the CSPN.
6 Conclusions
We have used Chandra and XMM-Newton X-ray observations and HST multi-epoch archival images of A 30 to investigate the hot gas content and the expansion of the innermost regions of this born-again PN. Optical and UV high-dispersion spectra have been used, in conjunction with the PoWR non-LTE model atmosphere code, to derive the stellar and wind properties of its central star.
The large, nearly spherical outer shell of low density of A 30 meets the expectations of the ISW model of PN formation for an old, evolved object, in agreement with its kinematical age of 10,000–13,000 yr. Since then, the CSPN of A 30 experienced a VLTP event and ejected highly processed material that is detected as large amounts of carbon-rich dust and a series of hydrogen-poor, carbon- and oxygen-rich knots distributed along an expanding equatorial disk and two bipolar outflows. The determination of the proper motions of these knots has allowed us to derive their expansion rate and to obtain an expansion age of 850 yr that we interpret as the lapse of time since the born-again event.
The CSPN of A 30 presently exhibits a fast stellar wind with terminal velocity 4000 km s-1 and a low mass-loss rate, 210 yr-1. A careful examination of archival [O iii] echelle data of A 30 reveals the occurrence of faint nebular features along the line of sight of the CSPN and the cloverleaf-shaped filaments that expand at speeds up to 400 km s-1. These features can be interpreted as the signatures of the post-born-again wind. A comparison with the other known born-again CSPNe (A 58, A 78 and VV4334 Sgr) suggests that the onset of the post-born-again wind occurred soon after the born-again event, with time-scales as short as a few years. This post-born-again wind is soon superseded by the present fast stellar wind. Whereas this is an incomplete picture of the evolution of the stellar wind during the born-again and post-born-again phases, we note that the present model calculations do not offer a more detailed view of this transition.
The above descriptions indicate that A 30 is a complex object composed of a system of three nested winds: a post-AGB wind that formed a typical PN shell, a medium-speed born-again and post-born-again wind consisting of processed, hydrogen-poor material, and a present high-speed, hydrogen-poor wind. A 30 is thus a unique system to study the effects of various types of wind-interactions.
The exquisite spatial resolution of Chandra and unprecedented sensitivity of XMM-Newton have allowed us to resolve the X-ray emission from A 30 into a point-source at its central star and diffuse emission associated with the innermost hydrogen-poor knots and with the cloverleaf structure inside the nebular shell. The diffuse X-ray emission from A 30 originates in the interactions of the present fast stellar wind and post-born-again wind with the hydrogen-poor ejecta. After the born-again event, the hydrogen-poor, carbon-rich post-born-again wind blew a cavity into the nebula that resulted in the cloverleaf structure. The interactions of this wind and the present fast stellar wind with clumps of low speed and carbon-rich dust from the born-again event result in processes of shock-heating and mass-loading of the stellar winds and ablation of the hydrogen-poor knots that produce X-ray-emitting plasma. Diffuse X-ray emission may also result from charge transfer reactions between the stellar winds and the hydrogen-poor ejecta in knots and dust.
The origin of the point-source of X-ray emission at the central star of A 30 is unclear. It is unlikely to result from shocks in the stellar wind, as in OB stars, or from the hot CSPN photospheric emission. The development of a “born-again hot bubble” may explain this emission, but its small size is puzzling.
References
- Althaus et al. (2005) Althaus, L. G., Serenelli, A. M., Panei, J. A., et al. 2005, A&A, 435, 631
- Arnaud (1996) Arnaud, K.A. 1996, Astronomical Data Analysis Software and Systems V, 101, 17
- Arthur (2007) Arthur, S. J. 2007, Diffuse Matter from Star Forming Regions to Active Galaxies, 183
- Arthur (2012) Arthur, S. J. 2012, MNRAS, in press
- Balick (1987) Balick, B. 1987, AJ, 94, 671
- Beiersdorfer et al. (2003) Beiersdorfer, P., Boyce, K. R., Brown, G. V., et al. 2003, Science, 300, 1558
- Berghöfer et al. (1997) Berghöfer, T. W., Schmitt, J. H. M. M., Danner, R., & Cassinelli, J. P. 1997, A&A, 322, 167
- Bodewits et al. (2004) Bodewits, D., Juhász, Z., Hoekstra, R., & Tielens, A. G. G. M. 2004, ApJ, 606, L81
- Borkowski et al. (1994) Borkowski, K. J., Harrington, J. P., Blair, W. P., & Bregman, J. D. 1994, ApJ, 435, 722
- Borkowski et al. (1995) Borkowski, K. J., Harrington, J. P., & Tsvetanov, Z. I. 1995, ApJ, 449, L143
- Borkowski & Szymkowiak (1997) Borkowski, K. J., & Szymkowiak, A. E. 1997, ApJ, 477, L49
- Cahn et al. (1992) Cahn, J. H., Kaler, J. B., & Stanghellini, L. 1992, A&AS, 94, 399
- Cardelli et al. (1989) Cardelli, J.A., Clayton, G.C., & Mathis, J.S. 1989, ApJ, 345, 245
- Cerruti-Sola & Perinotto (1985) Cerruti-Sola, M., & Perinotto, M. 1985, ApJ, 291, 237
- Chu, Chang, & Conway (1997) Chu, Y.-H., Chang, T.H., & Conway, G.M. 1997, ApJ, 482, 891
- Chu et al. (2001) Chu, Y.-H., Guerrero, M. A., Gruendl, R. A., Williams, R. M., & Kaler, J. B. 2001, ApJ, 553, L69
- Chu & Ho (1995) Chu, Y.-H., & Ho, C.-H. 1995, ApJ, 448, L127
- Ciardullo et al. (1999) Ciardullo, R., Bond, H. E., Sipior, M. S., et al. 1999, AJ, 118, 488
- Cohen et al. (1977) Cohen, M., Hudson, H. S., Odell, S. L., & Stein, W. A. 1977, MNRAS, 181, 233
- Clayton et al. (2006) Clayton, G. C., Kerber, F., Pirzkal, N., et al. 2006, ApJ, 646, L69
- Dennerl (2010) Dennerl, K. 2010, Space Sci. Rev., 157, 57
- Dennerl et al. (1997) Dennerl, K., Englhauser, J., & Trümper, J. 1997, Science, 277, 1625
- Duerbeck & Benetti (1996) Duerbeck, H. W., & Benetti, S. 1996, ApJ, 468, L111
- Ercolano et al. (2003) Ercolano, B., Barlow, M. J., Storey, P. J., et al. 2003, MNRAS, 344, 1145
- Eyres et al. (1999) Eyres, S. P. S., Smalley, B., Geballe, T. R., et al. 1999, MNRAS, 307, L11
- Feldmeier et al. (1997) Feldmeier, A., Puls, J., & Pauldrach, A. W. A. 1997, A&A, 322, 878
- Greenstein (1981) Greenstein, J. L. 1981, ApJ, 245, 124
- Groenewegen & Lamers (1989) Groenewegen, M. A. T., & Lamers, H. J. G. L. M. 1989, A&AS, 79, 359
- Guerrero et al. (2000) Guerrero, M. A., Chu, Y.-H., & Gruendl, R. A. 2000, ApJS, 129, 295
- Guerrero & Manchado (1996) Guerrero, M. A., & Manchado, A. 1996, ApJ, 472, 711
- Hamann & Gräfener (2004) Hamann, W.-R., & Gräfener, G. 2004, A&A, 427, 697
- Hamann & Koesterke (1998) Hamann, W.-R., & Koesterke, L. 1998, A&A, 335, 1003
- Harrington & Feibelman (1984) Harrington, J. P., & Feibelman, W. A. 1984, ApJ, 277, 716
- Hart et al. (2011) Hart, A., Hora, J., Cerrigone, L., et al. 2011, Asymmetric Planetary Nebulae 5 conference, eds. A.A. Zijlstra, F. Lykou, I. McDonald, and E. Lagadec, Jodrell Bank Centre for Astrophysics, 18
- Herwig et al. (1999) Herwig, F., Blöcker, T., Langer, N., & Driebe, T. 1999, A&A, 349, L5
- Iben et al. (1983) Iben, I., Jr., Kaler, J. B., Truran, J. W., & Renzini, A. 1983, ApJ, 264, 605
- Iben & MacDonald (1995) Iben, I., Jr., & MacDonald, J. 1995, White Dwarfs, 443, 48
- Jacoby (1979) Jacoby, G.H. 1979, PASP, 91, 754
- Jacoby & Ford (1983) Jacoby, G. H., & Ford, H. C. 1983, ApJ, 266, 298
- Jeffery (1995) Jeffery, C. S. 1995, A&A, 299, 135
- Kastner et al. (2000) Kastner, J. H., Soker, N., Vrtilek, S. D., & Dgani, R. 2000, ApJ, 545, L57
- Krasnopolsky (1997) Krasnopolsky, V. 1997, Icarus, 128, 368
- Kwok, Purton, & Fitzgerald (1978) Kwok, S., Purton, C. R., & Fitzgerald, P. M. 1978, ApJ, 219, L125
- Lawlor & MacDonald (2006) Lawlor, T. M., & MacDonald, J. 2006, MNRAS, 371, 263
- Leuenhagen, Koesterke, & Hamann (1993) Leuenhagen, U., Koesterke, L., & Hamann, W.-R. 1993, Acta Astronomica, 43, 329
- Lisse et al. (1999) Lisse, C. M., Christian, D., Dennerl, K., et al. 1999, Icarus, 141, 316
- Lisse et al. (1996) Lisse, C. M., Dennerl, K., Englhauser, J., et al. 1996, Science, 274, 205
- López et al. (2012) Lṕez, J.A., Richer, M.G., García-Díaz, M.T., et al. 2012, Revista Mexicana Astronomía y Astrofísica, vol 48, 3
- Meaburn & López (1996) Meaburn, J., & López, J.A. 1996, ApJ, 472, L45
- Meaburn et al. (1998) Meaburn, J., López, J.A., Bryce, M., & Redman, M.P. 1998, A&A, 334, 670
- Mellema & Lundqvist (2002) Mellema, G., & Lundqvist, P. 2002, A&A, 394, 901
- Miller Bertolami & Althaus (2006) Miller Bertolami, M. M., & Althaus, L. G. 2006, A&A, 454, 845
- Miller Bertolami et al. (2006) Miller Bertolami, M. M., Althaus, L. G., Serenelli, A. M., & Panei, J. A. 2006, A&A, 449, 313
- Orio et al. (2003) Orio, M., Hartmann, W., Still, M., & Greiner, J. 2003, ApJ, 594, 435
- Oskinova et al. (2009) Oskinova, L. M., Hamann, W.-R., Feldmeier, A., Ignace, R., & Chu, Y.-H. 2009, ApJ, 693, L44
- Perinotto et al. (2004) Perinotto, M., Schönberner, D., Steffen, M., & Calonaci, C. 2004, A&A, 414, 993
- Phillips & Ramos-Larios (2007) Phillips, J. P., & Ramos-Larios, G. 2007, AJ, 133, 347
- Pittard (2007) Pittard, J. M. 2007, Diffuse Matter from Star Forming Regions to Active Galaxies, 245
- Pollock (2012) Pollock, A.M.T. 2012, AN, 333, 351
- Reed et al. (1999) Reed, D. S., Balick, B., Hajian, A. R., et al. 1999, AJ, 118, 2430
- Sandin et al. (2011) Sandin, C., Steffen, M., Schönberner, D., Rühling, U., & Hamann, W. R. 2011, Asymmetric Planetary Nebulae 5 conference, held in Bowness-on-Windermere, U.K., 20 - 25 June 2010, A. A. Zijlstra, F. Lykou, I. McDonald, and E. Lagadec, eds. (2011) Jodrell Bank Centre for Astrophysics,
- Schönberner et al. (2010) Schönberner, D., Jacob, R., Sandin, C., & Steffen, M. 2010, A&A, 523, A86
- Schönberner et al. (2005a) Schönberner, D., Jacob, R., & Steffen, M. 2005a, A&A, 441, 573
- Schönberner et al. (2005b) Schönberner, D., Jacob, R., Steffen, M., et al. 2005b, A&A, 431, 963
- Seitter (1987) Seitter, W. C. 1987, The Messenger, 50, 14
- Steffen et al. (2012) Steffen, M., Sandin, C., Jacob, R., & Schönberner, D. 2012, in IAU Symp. 283, Planetary Nebulae, an Eye to the Future, ed. A. Manchado, D. Schönberner, & L. Stanghellini (Cambridge: Cambridge Univ. Press), in press
- Steffen et al. (2008) Steffen, M., Schönberner, D., & Warmuth, A. 2008, A&A, 489, 173
- Steffen & López (2004) Steffen, W., & López, J. A. 2004, ApJ, 612, 319
- Todt et al. (2008) Todt, H., Hamann, W.-R., & Gräfener, G. 2008, Clumping in Hot-Star Winds, 251
- Tyne et al. (2002) Tyne, V. H., Evans, A., Geballe, T. R., et al. 2002, MNRAS, 334, 875
- Wesson et al. (2003) Wesson, R., Liu, X.-W., & Barlow, M. J. 2003, MNRAS, 340, 253


| Parameter | Value | Comments |
|---|---|---|
| Stellar parameters | ||
| 3.78 | Adopted | |
| Clumping factor, | 10 | Adopted |
| (kpc) | 1.76 | |
| (mag) | 0.18 | |
| aa The stellar radius refers by definition to the point where the radial Rosseland optical depth is 20. () | 0.20 | |
| bb is defined as the effective temperature related to the radius . (K) | 115,000 | |
| (km s-1) | 4000 | |
| () | 2.010-8 | |
| Abundances (mass fractions) | ||
| He | 0.63 | |
| C | 0.20 | |
| N | 0.015 | |
| O | 0.15 | |
| Fe (+ iron group) | 0.0016 | |
| Instrument | Background-subtracted count rate | Net counts | |||
|---|---|---|---|---|---|
| 190-600 eV1 | 190-275 eV | 275-450 eV | 450-600 eV | 190-600 eVaa For ACIS-S, the low energy cutoff is not 190 eV, but 200 eV. | |
| (counts ks-1) | (counts ks-1) | (counts ks-1) | (counts ks-1) | (counts) | |
| Point source and diffuse emission | |||||
| EPIC-pn | 50.41.6 | 19.70.9 | 28.31.1 | 1.570.31 | 115040 |
| EPIC-MOS1 | 7.70.6 | 21916 | |||
| EPIC-MOS2 | 6.60.5 | 18615 | |||
| ACIS-S | 1.800.14 | 17213 | |||
| Point source | |||||
| EPIC-pn | 29.71.1 | 67526 | |||
| EPIC-MOS1 | 4.40.4 | 14012 | |||
| EPIC-MOS2 | 3.40.3 | 10510 | |||
| Diffuse emission | |||||
| EPIC-pn | 14.30.9 | 32520 | |||
| EPIC-MOS1 | 2.20.3 | 719 | |||
| EPIC-MOS2 | 1.70.3 | 558 | |||
| Region | EMaa Emission measure, EM = . | /d.o.f. | |||
|---|---|---|---|---|---|
| (cm-2) | (keV) | (cm-3) | (photon cm-2 s-1) | ||
| A 30 | (22)1015 | 0.0700.005 | 9.21049 | 2.08 (=199.6/96) | |
| CSPNbb Adopted value of the hydrogen column density. | 21015 | 0.0680.003 | 4.81049 | (5.00.6)10-5 | 1.11 (=46.5/42) |
| Diffusebb Adopted value of the hydrogen column density. | 21015 | 0.068 | 2.91049 | 1.38 (=42.7/31 |
| Region | /d.o.f. | |||||||
|---|---|---|---|---|---|---|---|---|
| (cm-2) | (photon cm-2 s-1) | |||||||
| CSPNaa Adopted value of the hydrogen column density. | 21015 | 7.210-5 | 6.710-5 | 110-8 | 510-9 | 1.610-6 | 4.710-8 | 1.35 (=37.8/28) |
| Diffuseaa Adopted value of the hydrogen column density. | 21015 | 4.010-5 | 9.510-6 | 110-8 | 110-8 | 7.510-7 | 210-7 | 1.23 (=49.0/40) |