First Science Observations with SOFIA/FORCAST: 6 to 37 µm Imaging of the Central Orion Nebula
Abstract
We present new mid-infrared images of the central region of the Orion Nebula using the newly commissioned SOFIA airborne telescope and its 5 – 40 µm camera FORCAST. The 37.1 µm images represent the highest resolution observations ( 4″) ever obtained of this region at these wavelengths. After BN/KL (which is described in a separate letter in this issue), the dominant source at all wavelengths except 37.1 µm is the Ney-Allen Nebula, a crescent-shaped extended source associated with D Ori (catalog * tet01 Ori D). The morphology of the Ney-Allen nebula in our images is consistent with the interpretation that it is ambient dust swept up by the stellar wind from D Ori (catalog * tet01 Ori D), as suggested by Smith et al. (2005). Our observations also reveal emission from two “proplyds” (proto-planetary disks), and a few embedded young stellar objects (YSOs; IRc 9 (catalog 2MASS J05351380-0521596), and OMC1S IRS1, 2, and 10). The spectral energy distribution for IRc 9 (catalog 2MASS J05351380-0521596) is presented and fitted with standard YSO models from Robitaille et al. (2007) to constrain the total luminosity, disk size, and envelope size. The diffuse, nebular emission we observe at all FORCAST wavelengths is most likely from the background photodissociation region (PDR) and shows structure that coincides roughly with H and [N II] emission. We conclude that the spatial variations in the diffuse emission are likely due to undulations in the surface of the background PDR.
1 Introduction
Because of its relative proximity and its favorable location on the near side of its parent molecular cloud, the Orion Nebula (M42 (catalog ), NGC1976 (catalog )) has long been studied as the archetype of massive star formation. Its infrared characteristics have been key to our understanding of the flow of energy and the role of dust in such a region. Extended thermal emission from warm dust in the vicinity of the Trapezium OB star cluster that powers the Orion Nebula was discovered at 11.6 and 20 µm by Ney & Allen (1969). More detailed observations of this “Ney-Allen Nebula” were subsequently carried out between 8 and 13 µm by Gehrz et al. (1975), who showed that the emission peaks on D Ori (catalog * tet01 Ori D) (HD37023 (catalog ), B0.5V) and argued that the primary heating mechanism for the grains in this region is resonantly trapped Lyman- radiation. Using somewhat higher spatial resolution observations (3″), Hayward (1994) observed the Orion Nebula at multiple wavelengths from 7.6 to 24.3 µm, and used the spectral energy distributions (SEDs) on representative sightlines to confirm an earlier claim by Forrest et al. (1976) of the presence of a second, cooler, extended emission component. Hayward showed that the cool component (110 K vs. 300 K for the warm component) peaks to the West of D Ori (catalog * tet01 Ori D), and concluded that it arises from the back wall of the H II region blister and is primarily heated by radiation from C Ori (catalog * tet01 Ori C) (HD37022 (catalog ), O4-6pv). An overview of the geometry of the Orion Nebula and the “Main Ionization Front” (MIF) is given by O’Dell (2001).
Recent high-resolution mid-IR observations of the Orion Nebula have revealed a wealth of new detail (Smith et al., 2005; Robberto et al., 2005; Kassis et al., 2006). The warm dust component is resolved largely into limb-brightened dust arcs around proplyds, and the brightest dust arc111 Usage of the term “Ney-Allen Nebula” has evolved to now refer uniquely to this bright feature, which lies at the peak of the extended structure discovered by Ney & Allen (1969).—that around D Ori (catalog * tet01 Ori D)—is either a consequence of that star being located close to the background cloud (Smith et al., 2005) or is a photoevaporated circumstellar disk (Robberto et al., 2005). The remaining, mostly cool dust emission emerges as a complex of streaks, gaps, arcs, and protostellar jets.
In this letter we report on a study of the Orion Nebula with the Stratospheric Observatory for Infrared Astronomy (SOFIA) using the mid-IR facility camera FORCAST. In this study, we extend the relatively high-resolution view of the diffuse emission in this region to longer wavelengths than have previously been reported, and focus on the Ney-Allen Nebula (catalog ) and the proplyds. Our report also includes brief descriptions of emission from the infrared source IRc 9 (catalog 2MASS J05351380-0521596) and the cluster of young stellar objects in OMC1 South. Results for the active star formation region surrounding the Becklin-Neugebauer source and the Kleinmann-Low Nebula are reported separately in this issue (De Buizer et al., 2012).
2 Observations and Analysis
The SOFIA observations of Orion were performed on the nights of 30 November and 3 December 2010 using the FORCAST instrument (Adams et al., 2010). FORCAST is a dual-array mid-infrared camera capable of taking images with two filters simultaneously. The short wavelength camera utilizes a 256256 pixel Si:As array optimized for 5–25 µm, while the long wavelength camera utilizes a 256256 pixel Si:Sb array optimized for 25-40 µm (Herter et al., 2012). After correction for focal plane distortion, FORCAST effectively samples at 0.768 per pixel, which yields an approximately 3.43.2 instantaneous field-of-view.
Observations were obtained in the 6.6, 7.7, 19.7, 31.5, and 37.1 µm filters at an aircraft altitude of 43000 ft. The chopping secondary of SOFIA was driven at 2 Hz, with a chop throw of 7. Such large throws were necessary to assure that the sky reference beam was completely off the extended Orion nebula complex and sampling “empty” sky areas for background subtraction. For the same reasons the telescope was nodded 10 away from the Orion nebula. With this setup, Orion was sampled in only one of the four chop-nod beams, and therefore the final effective on-source exposure times for the observations were 150 s at 6.6 and 7.7 µm, 450 s at 19.7 µm, 300 s at 31.5 µm, and 420 s at 37.1 µm.
Because all FORCAST data were taken in the dichroic mode, we were able to determine relative astrometry using images from the two wavelengths that were observed simultaneously. Data were taken with the following filter pairs: 19.7 µm/37.1 µm, 19.7 µm/31.1 µm, 6.6 µm/37.1 µm, and 7.7 µm/37.1 µm. Therefore the relative astrometry of all filters was determined precisely by bootstrapping from the 19.7 µm/37.1 µm pair. We estimate that the relative astrometry between filters is known to better than 0.5 pixels (0.38). Absolute astrometry for each image was fixed by assuming that the peak of the BN source at 19.7 µm is the same as the peak at 7 mm given by Rodríguez et al. (2005), R.A.(J2000)=05h35m14.119s, Dec(J2000)=-05d22m22.785s.
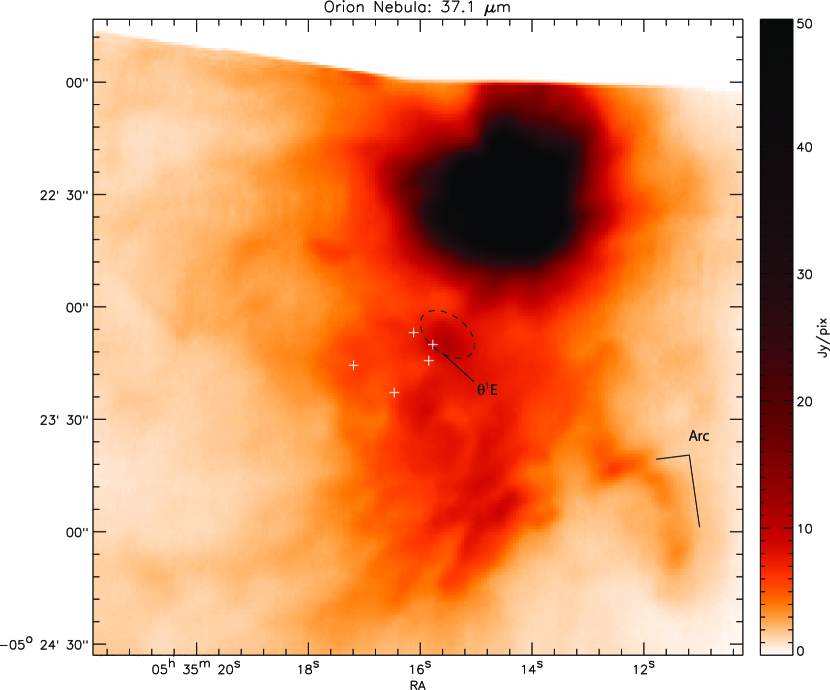
The FORCAST images were calibrated to a flux density per pixel using a standard instrument response derived from measurements of standard stars and solar system objects over several short science and basic science flights (Herter et al., 2012). The color correction from a flat spectrum source to that of the Orion sources is . The estimated uncertainty in the calibration due to variations in flat field, water vapor burden, and altitude is approximately . Flux calibrated images for the 7.7, 19.7, and 37.1 µm data are shown in Figs. 1, 2, and 3: the images at 6.6 µm suffered from poor image quality and are not shown.
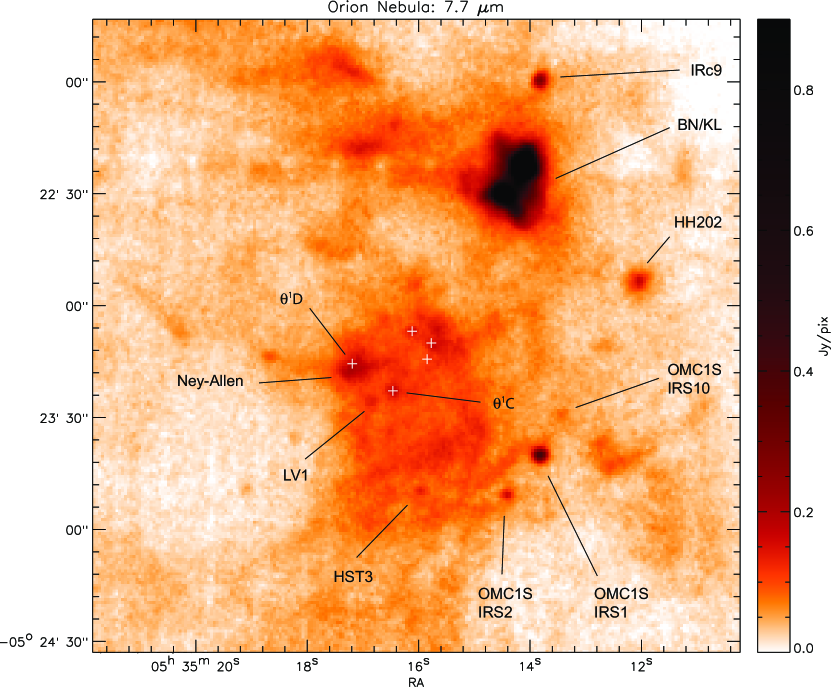
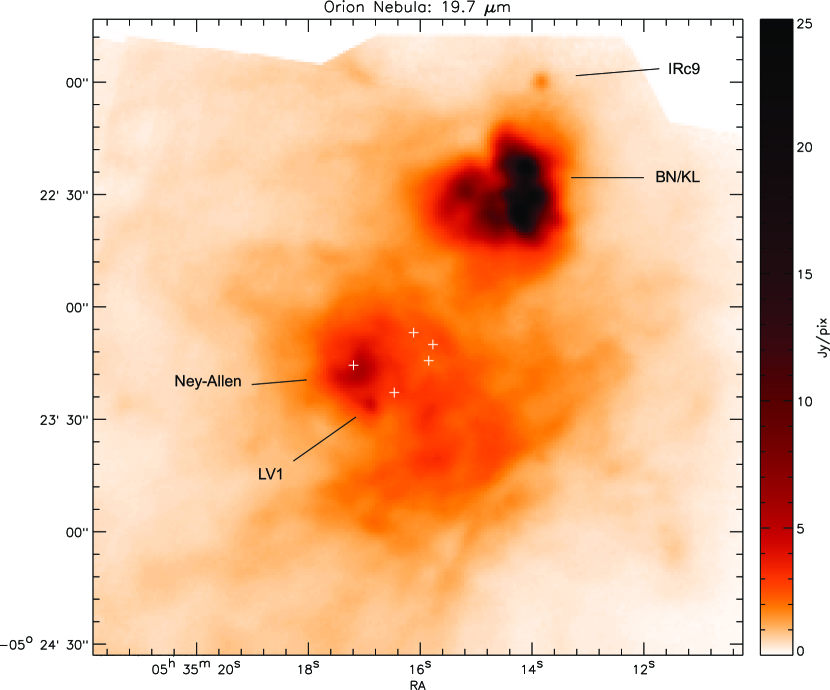
Our FORCAST images at 7.7 µm reveal a number of compact sources which are consistent with IRAC images of the Orion Nebula available from the Spitzer Legacy Archive and coincide with a number of known objects in the region (see Fig. 1). Of the known sources detected at 7.7 µm, only LV1 (catalog OW94 168-326E) and IRc 9 (catalog 2MASS J05351380-0521596) are visible at 19.7 µm, and no known compact sources are detected at 31.5 and 37.1 µm. Source fluxes (or upper limits) measured from our FORCAST images at 19.7, 31.5, and 37.1 µm for IRc 9 (catalog 2MASS J05351380-0521596) and LV1 (catalog OW94 168-326E) are included in the SEDs shown in Figure 4.

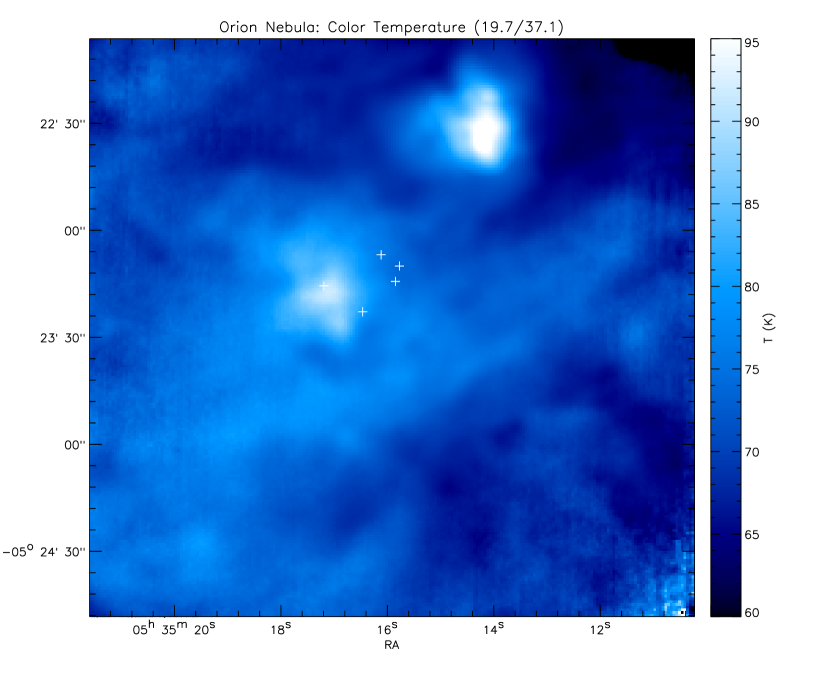
A temperature map of the region was generated from the 19.7 and 37.1 µm images using a least-squares procedure to fit the observed surface brightnesses in each pixel to the model
| (1) |
where is the blackbody function. We have adopted the Mathis extinction law for the wavelength dependence of () and is evaluated for 19.7 µm (Fig. 5). The surface brightnesses at each wavelength were given equal weight. The model corresponds to the solution of the radiative transfer equation for emission/absorption of material along the line of sight. The median dust temperature throughout the central part of the nebula is 70K and the emission is optically thin. The Ney-Allen Nebula (catalog ) is the warmest region in the nebula (besides BN/KL), with a color temperature in excess of 90K (see discussion in Section 3.1). These temperatures are significantly colder than those reported by Hayward (1994) for both the warm ( K) and cold ( K) dust components. This is to be expected, however, since our study utilizes longer wavelengths than Hayward (1994) and hence is more sensitive to colder dust.
3 Discussion
3.1 Ney-Allen Nebula
The dominant feature of the Trapezium region is the Ney-Allen Nebula (catalog ), which is bright in all the FORCAST filters except for 37 µm, where it is very difficult to distinguish from variations in the background emission (Fig. 3). The morphology of Ney-Allen is clearly wavelength-dependent in our FORCAST images: At 7.7 µm, it is an elongated source (approximately 4″ 7″), offset by 2.2 arcsec from D Ori (catalog * tet01 Ori D) (see Fig 1); in the images at 19 and 31 µm, it is a crescent surrounding the position of D Ori (catalog * tet01 Ori D) with the apex pointing roughly toward a PA of 220°. The crescent shape is also apparent at N and Q bands (Robberto et al., 2005), and 11.7 µm (Smith et al., 2005). In addition, the diameter of the crescent increases with wavelength, from approximately 5.5″ at 19 µm to 8.2″ at 31 µm, suggesting a radial temperature gradient indicative of heating by the central source, D Ori (catalog * tet01 Ori D). The same increase in size with wavelength (exceeding the increase in PSF size as a function of wavelength) is also evident in IRAC images of the Trapezium available from the Spitzer Legacy Archive.
Robberto et al. (2005) suggested that the Ney-Allen emission could be due to dust that was evaporated from a massive circumstellar disk associated with D Ori (catalog * tet01 Ori D). Smith et al. (2005) argue against this interpretation citing lack of evidence for such a disk (though it is possible that the disk is now completely dissipated). Since the axis of symmetry of the Ney-Allen crescent aligns very closely with the direction of proper motion for D Ori (catalog * tet01 Ori D) (217°), Smith et al. (2005) instead postulated that the Ney-Allen emission is due to dust swept up in the bow shock between the stellar wind of D Ori (catalog * tet01 Ori D) – a B0.5V star (Mason et al., 1998) – and the ambient nebular material. Our SOFIA-FORCAST observations are consistent with this interpretation. Because D Ori (catalog * tet01 Ori D) is the only member of the Trapezium to show such a compressed shell, then, if this scenario is correct, it is probably in a relatively high density portion of the overall nebula. This suggests that D Ori (catalog * tet01 Ori D) is much closer to the background dense cloud than are the other members of the Trapezium, and may even be plunging into the background PDR (Smith et al., 2005).
3.2 Proplyds
Two of the compact sources detected in the 7.7 µm images (HST3 (catalog OW94 159-350) and LV1 (catalog OW94 168-326E)) are known proplyds—externally illuminated, low-mass young stellar objects whose circumstellar disks are being photoablated by the strong EUV and FUV radiation from C Ori (catalog * tet01 Ori C) (O’Dell et al., 1993; Bally et al., 1998). LV1 (catalog OW94 168-326E) is also visible in the 19.7 and 31.5 µm images, but is indistinguishable from the nebular background at 37.1 µm. At 19.7 µm LV1 (catalog OW94 168-326E) appears slightly elongated in the NE–SW direction (Fig. 2); the same orientation as the wind-wind bow shock (the stand-off shock between the proplyd evaporative flow and the stellar wind from C Ori (catalog * tet01 Ori C)) that is seen in both HST [O III] and H images (Bally et al., 1998) and at 11.7 µm (Smith et al., 2005). This suggests that dust from the proplyd circumstellar disk is entrained in the evaporative flow and then “piles up” at the wind-wind shock where it is heated by the UV radiation from C Ori (catalog * tet01 Ori C) and emits strongly in the mid-IR. Both HST3 and LV1 (catalog OW94 168-326E) are detected in 3.6 cm radio continuum (Zapata et al., 2004); only HST3 is detected in the COUP X-Ray survey (Getman et al., 2005).
We have combined our mid-IR flux measurements with IRAC fluxes (Megeath, 2012), and additional ground-based mid-IR measurements (Smith et al., 2005) to generate the mid-IR SED for LV1 (catalog OW94 168-326E) shown in Fig. 4. Interpretation of this SED is difficult, however, for two reasons:
-
1.
LV1 (catalog OW94 168-326E) is a known double (Graham et al., 2002, and references therein), so mid-IR dust emission can arise from a circumstellar disk around either source and from the observed interaction zone between the two sources;
-
2.
mid-IR emission from the wind-wind shock cannot be spatially separated from the binary proplyd emission.
Models of externally illuminated disks constructed by Robberto et al. (2002) show that the mid-IR emission from 10 to 40 µm is dominated by emission from the disk interior (peaking at µm) and emission from the superheated atmosphere (peaking at µm). These models tend to peak around 30 – 60 µm, which is not observed for LV1 (catalog OW94 168-326E) (the peak in the LV1 (catalog OW94 168-326E) SED appears to be around 20 µm), suggesting that the mid-IR emission is dominated by a combination of the superheated disk atmosphere(s) of the two LV1 (catalog OW94 168-326E) components and the dust piled up in the wind bow shock. LV1 (catalog OW94 168-326E) also has a modest 10 µm silicate emission feature (Shuping et al., 2006), which is also a strong component of the superheated disk atmosphere (Robberto et al., 2002).
3.3 Embedded Young Stellar Objects
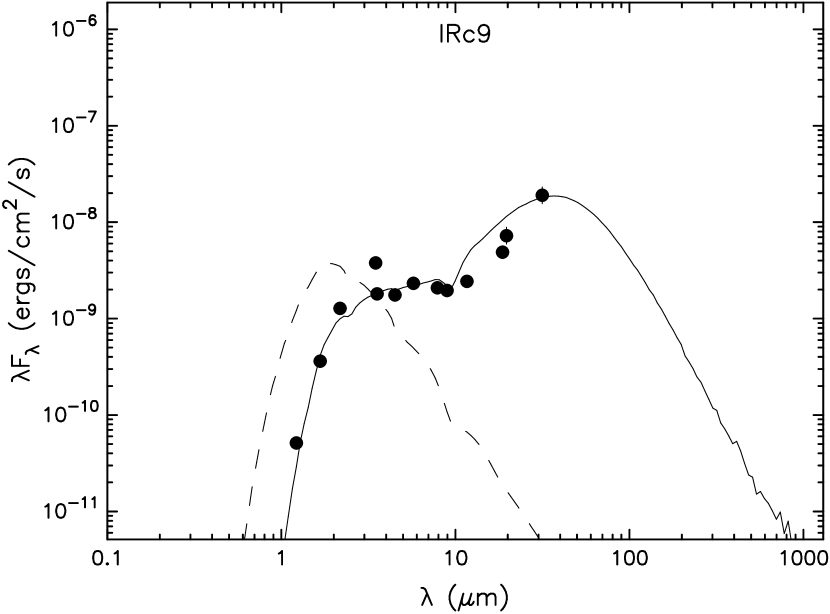
Roughly 30″ north of the BN/KL region is the relatively isolated infrared source IRc 9 (catalog 2MASS J05351380-0521596) (Wynn-Williams & Becklin, 1974; Downes et al., 1981). IRc 9 (catalog 2MASS J05351380-0521596) is thought to be an embedded, luminous young stellar object (YSO) with a massive circumstellar disk (Smith & Bally, 2005): The near- to mid-IR SED shown in Fig. 4 is consistent with this interpretation. Model SEDs of young stellar objects were fit to the SED of IRc 9 (catalog 2MASS J05351380-0521596) using the Online YSO SED Fitting tool (Robitaille et al., 2007) with best fit shown in Fig. 4. The Robitaille et al. (2007) models assume a single central stellar source with different combinations of axisymmetric circumstellar disks, infalling flattened envelopes and outflow cavities. The fitting procedure interpolates the model fluxes to the apertures used in the measurements, scaling them to a given distance range of a source, which in this case is taken to be 416 pc (Kim et al., 2008), and the line-of-sight extinction . We adopted a range of from 2.0 to 10.0, based on the OMC1 extinction map (Scandariato et al., 2011). While these models yield estimates of physical parameters which are highly degenerate in general, they are fairly good at estimating the total luminosity of sources, which is our primary interest.
The best fit SED models for IRc 9 (catalog 2MASS J05351380-0521596) have a total bolometric luminosity of 110 to 215 L☉, which is somewhat higher than the value found by Smith & Bally (2005), but agrees with their conclusion that IRc 9 (catalog 2MASS J05351380-0521596) is the progenitor of an early-A (or late-B) ZAMS star with 3—4 M☉. The best fit models also indicate that the bulk of the emission longward of 10 µm is due to a large circumstellar envelope ( AU), whereas the flux from 3—10 µm is primarily from a much smaller circumstellar disk ( AU). This suggests that the spatially resolved 8.8 to 18.3 µm emission observed by Smith & Bally (2005) and attributed to a large circumstellar disk, may in fact be the inner regions ( AU) of an envelope.
In addition to IRc 9 (catalog 2MASS J05351380-0521596) we also detect three of the infrared sources in the OMC1-S region (IRS1 (catalog SBSMH 1), IRS2 (catalog SBSMH 2), IRS10 (catalog SBSMH 10)), also thought to be YSOs (Fig. 1). At longer wavelengths, detection and flux measurement of the OMC1-S sources is not clear due to confusion with variations in the background emission. Limiting fluxes based on variations in the nebular background, however, suggest that 20 – 40 µm emission from the OMC1-S sources may be significant. We compared the 19, 31, and 37 µm limiting fluxes to flux measurements from Spitzer (Megeath, 2012) and found that the SEDs from 4.5 through 31 µm are consistent with Class I or “flat spectrum” protostars, though it is not possible to rule out the possibility that they are highly-reddened Class II sources. The bright 7.7 µm source SW of the BN/KL region coincides with HH202 (catalog ), a shock-excited region thought to be associated with an outflow or jet from OMC1-S IRS1 (catalog SBSMH 1) (Smith et al., 2004). In contrast, HH202 (catalog ) is very weak at 6.6 µm and not detected in the 19, 31, and 37 µm images at all, strongly suggesting that the 7.7 µm excess is due to PAH emission.
3.4 Diffuse Emission
The diffuse emission observed in our FORCAST images is generally a combination of emission from dust in both the background MIF and the H II region itself. The observed 19.7/37.1 µm color temperature values across the nebula (Fig. 5) are consistent with cool dust in the background PDR. The structures apparent in our 19.7 and 37.1 µm images are consistent with higher-resolution ground-based Q-band (20 µm) observations obtained by Robberto et al. (2005). The filamentary structure SW of the Trapezium coincides roughly with bright [N II] and H emission features (O’Dell & Yusef-Zadeh, 2000) and also with 8.4 and 1.5 GHz radio continuum emission (Dicker et al., 2009). Robberto et al. (2005) concluded that the filaments in the mid-IR correspond to undulations or folds in the background PDR surface that cause limb-brightening and shadowing effects—similar to the Orion Bar but on a smaller scale.
The diffuse emission drops significantly in the OMC1S region in all of our FORCAST images. The 19.7/37.1 color temperature drops significantly as well, indicating reduced UV heating in this region. We interpret this as a shadowing effect wherein the bright folds and undulations NE of OMC1S correspond to dense material that blocks the UV radiation field from C Ori (catalog * tet01 Ori C). This is consistent with the interpretation of OMC1S as a cold, dense region of gas and dust embedded within the H II region (O’Dell et al., 2009). We suggest that the formation of the embedded protostars in OMC1S may have been triggered by advancing shock waves when the Orion Nebula was first forming.
The 37.1 µm image presented here is the highest spatial resolution image of the Orion Nebula at this wavelength to date. There are a number of features in the 37.1 µm image that have no counterparts at shorter wavelengths. Most prominent, is a 60″ arc of emission to the west of OMC1S (see Fig. 3). This feature is not evident in narrow-band emission (O’Dell & Yusef-Zadeh, 2000), but is present in the 1.5 GHz radio continuum (Dicker et al., 2009). The arc coincides with a region of low color temperature as well (Fig. 5). Interpretation of this arc is unclear, but it seems plausible that it is heated internally by the embedded OMC1S protostars.
Most of the other structures observed at 37 µm coincide with bright regions of [NII] and H emission, seen both in natural (Bally et al., 1998) and extinction-corrected images (O’Dell & Yusef-Zadeh, 2000). In particular, there is a very bright extended source just NW of the Trapezium (also noted by Wynn-Williams et al. (1984) in their low-resolution 30 µm image) which corresponds to one of the brightest regions in the nebula in H and [N II] emission (O’Dell & Yusef-Zadeh, 2000). Some of the diffuse structures at 37.1 µm are also coincident with fluctuations in the color temperature (Fig. 5). These two phenomena suggest that these are all perturbations in the surface of the background PDR. One possible exception, however, is the emission WSW of C Ori (catalog * tet01 Ori C), which coincides with roughly 5 known proplyds, including the prominent sources LV4, 5, and 6 (Bally et al., 1998). We suggest that this is emission from dust that is entrained in the photoablation flows off the circumstellar disks around these sources and then heated by the UV radiation field of C Ori (catalog * tet01 Ori C).
References
- Adams et al. (2010) Adams, J. D., Herter, T. L., Gull, G. E., Schoenwald, J., Henderson, C. P., Keller, L. D., De Buizer, J. M., Stacey, G. J., & Nikola, T. 2010, in Society of Photo-Optical Instrumentation Engineers (SPIE) Conference Series, Vol. 7735, Society of Photo-Optical Instrumentation Engineers (SPIE) Conference Series
- Bally et al. (1998) Bally, J., Sutherland, R. S., Devine, D., & Johnstone, D. 1998, AJ, 116, 293
- De Buizer et al. (2012) De Buizer, J. M., Morris, M., Becklin, E. E., Zinnecker, H., Herter, T. L., Adams, J. D., Shuping, R. Y., & Vacca, W. D. 2012, ApjL, SOFIA Special Issue
- Dicker et al. (2009) Dicker, S. R., Mason, B. S., Korngut, P. M., Cotton, W. D., Compiègne, M., Devlin, M. J., Martin, P. G., Ade, P. A. R., Benford, D. J., Irwin, K. D., Maddalena, R. J., McMullin, J. P., Shepherd, D. S., Sievers, A., Staguhn, J. G., & Tucker, C. 2009, ApJ, 705, 226
- Downes et al. (1981) Downes, D., Genzel, R., Becklin, E. E., & Wynn-Williams, C. G. 1981, ApJ, 244, 869
- Forrest et al. (1976) Forrest, W. J., Houck, J. R., & Reed, R. A. 1976, ApJ, 208, L133
- Gehrz et al. (1975) Gehrz, R. D., Hackwell, J. A., & Smith, J. R. 1975, ApJ, 202, L33
- Getman et al. (2005) Getman, K. V., Flaccomio, E., Broos, P. S., Grosso, N., Tsujimoto, M., Townsley, L., Garmire, G. P., Kastner, J., Li, J., Harnden, Jr., F. R., Wolk, S., Murray, S. S., Lada, C. J., Muench, A. A., McCaughrean, M. J., Meeus, G., Damiani, F., Micela, G., Sciortino, S., Bally, J., Hillenbrand, L. A., Herbst, W., Preibisch, T., & Feigelson, E. D. 2005, ApJS, 160, 319
- Graham et al. (2002) Graham, M. F., Meaburn, J., Garrington, S. T., O’Brien, T. J., Henney, W. J., & O’Dell, C. R. 2002, ApJ, 570, 222
- Hayward (1994) Hayward, T. L. 1994, ApJ, 429, 726
- Herter et al. (2012) Herter, T. L., Adams, J. D., De Buizer, J. M., E., G. G., Schoenwald, J., Henderson, C. P., Keller, L. D., Nikola, T., Stacey, G., & Vacca, W. D. 2012, ApjL, SOFIA Special Issue
- Kassis et al. (2006) Kassis, M., Adams, J. D., Campbell, M. F., Deutsch, L. K., Hora, J. L., Jackson, J. M., & Tollestrup, E. V. 2006, ApJ, 637, 823
- Kim et al. (2008) Kim, M. K., Hirota, T., Honma, M., Kobayashi, H., Bushimata, T., Choi, Y. K., Imai, H., Iwadate, K., Jike, T., Kameno, S., Kameya, O., Kamohara, R., Kan-Ya, Y., Kawaguchi, N., Kuji, S., Kurayama, T., Manabe, S., Matsui, M., Matsumoto, N., Miyaji, T., Nagayama, T., Nakagawa, A., Oh, C. S., Omodaka, T., Oyama, T., Sakai, S., Sasao, T., Sato, K., Sato, M., Shibata, K. M., Tamura, Y., & Yamashita, K. 2008, PASJ, 60, 991
- Mason et al. (1998) Mason, B. D., Gies, D. R., Hartkopf, W. I., Bagnuolo, Jr., W. G., ten Brummelaar, T., & McAlister, H. A. 1998, AJ, 115, 821
- Megeath (2012) Megeath, S. T. 2012, in prep.
- Muench et al. (2002) Muench, A. A., Lada, E. A., Lada, C. J., & Alves, J. 2002, ApJ, 573, 366
- Ney & Allen (1969) Ney, E. P. & Allen, D. A. 1969, ApJ, 155, L193
- O’Dell (2001) O’Dell, C. R. 2001, PASP, 113, 29
- O’Dell et al. (2009) O’Dell, C. R., Henney, W. J., Abel, N. P., Ferland, G. J., & Arthur, S. J. 2009, AJ, 137, 367
- O’Dell et al. (1993) O’Dell, C. R., Wen, Z., & Hu, X. 1993, ApJ, 410, 696
- O’Dell & Yusef-Zadeh (2000) O’Dell, C. R. & Yusef-Zadeh, F. 2000, AJ, 120, 382
- Robberto et al. (2002) Robberto, M., Beckwith, S. V. W., & Panagia, N. 2002, ApJ, 578, 897
- Robberto et al. (2005) Robberto, M., Beckwith, S. V. W., Panagia, N., Patel, S. G., Herbst, T. M., Ligori, S., Custo, A., Boccacci, P., & Bertero, M. 2005, AJ, 129, 1534
- Robitaille et al. (2007) Robitaille, T. P., Whitney, B. A., Indebetouw, R., & Wood, K. 2007, ApJS, 169, 328
- Rodríguez et al. (2005) Rodríguez, L. F., Poveda, A., Lizano, S., & Allen, C. 2005, ApJ, 627, L65
- Scandariato et al. (2011) Scandariato, G., Robberto, M., Pagano, I., & Hillenbrand, L. A. 2011, A&A, 533, A38
- Shuping et al. (2006) Shuping, R. Y., Kassis, M., Morris, M., Smith, N., & Bally, J. 2006, ApJ, 644, L71
- Smith & Bally (2005) Smith, N. & Bally, J. 2005, ApJ, 622, L65
- Smith et al. (2004) Smith, N., Bally, J., Shuping, R. Y., Morris, M., & Hayward, T. L. 2004, ApJ, 610, L117
- Smith et al. (2005) Smith, N., Bally, J., Shuping, R. Y., Morris, M., & Kassis, M. 2005, AJ, 130, 1763
- Wynn-Williams & Becklin (1974) Wynn-Williams, C. G. & Becklin, E. E. 1974, PASP, 86, 5
- Wynn-Williams et al. (1984) Wynn-Williams, C. G., Genzel, R., Becklin, E. E., & Downes, D. 1984, ApJ, 281, 172
- Zapata et al. (2004) Zapata, L. A., Rodríguez, L. F., Kurtz, S. E., & O’Dell, C. R. 2004, AJ, 127, 2252