Trajectory entanglement in dense granular materials
Abstract
The particle-scale dynamics of granular materials have commonly been characterized by the self-diffusion coefficient . However, this measure discards the collective and topological information known to be an important characteristic of particle trajectories in dense systems. Direct measurement of the entanglement of particle space-time trajectories can be obtained via the topological braid entropy , which has previously been used to quantify mixing efficiency in fluid systems. Here, we investigate the utility of in characterizing the dynamics of a dense, driven granular material at packing densities near the static jamming point . From particle trajectories measured within a two-dimensional granular material, we typically observe that is well-defined and extensive. However, for systems where , we find that (like ) is not well-defined, signifying that these systems are not ergodic on the experimental timescale. Both and decrease with either increasing packing density or confining pressure, independent of the applied boundary condition. The related braiding factor provides a means to identify multi-particle phenomena such as collective rearrangements. We discuss possible uses for this measure in characterizing granular systems.
pacs:
45.70.Mg; 45.70.-n; 81.05.RmKeywords: Granular matter, Mixing, Topological braid entropy, Dynamical heterogeneities (Experiments)
1 Introduction
Recently, there have been extensive efforts to draw parallels between dense granular systems, foams, emulsions, and glassy molecular systems [1, 2]. For such systems approaching the glass/jamming transition, the dynamics slow down due to an increasing intrication of the available phase space, with rearrangements taking the form of cage jumps [3, 4, 5, 6, 7, 8]. In this regime, particles are trapped by their neighbors at short timescales and resume diffusive behavior at long timescales due to eventual loss of correlation in the succession of jumps. Such jumps involve cooperatively-rearranging regions which induce dynamical heterogeneities [9, 10], and the particles pass each other only rarely. The growth in size of these rearranging regions is believed to be associated with the rigidity and loss of ergodicity exhibited by fragile glasses.
Unlike glassy molecular systems, granular materials permit the tracking of individual particles. The average dynamics have traditionally been characterized by the mean squared displacement, . When the experimental timescale is long enough compared to the viscous timescale, permitting a complete decorrelation in the particle motion, it is possible to calculate the self-diffusion constant . This coefficient is a single-particle measure in which all information regarding relative motions of particles is discarded. In contrast, recent experiments and simulations [3, 8, 11, 12, 13, 14, 15, 16, 17, 18] have shown that the dynamics near the glass transition become heterogeneous in both space and time. As such, it is necessary to take relative motions into account when formulating the correct average description of the state. To this end, multi-particle scalars have been developed, including the four-point susceptibility [12, 13, 14]. However, to our knowledge, no scalars have been introduced which characterize mixing effects, which may be relevant to quantifying the cooperative motion of particles.
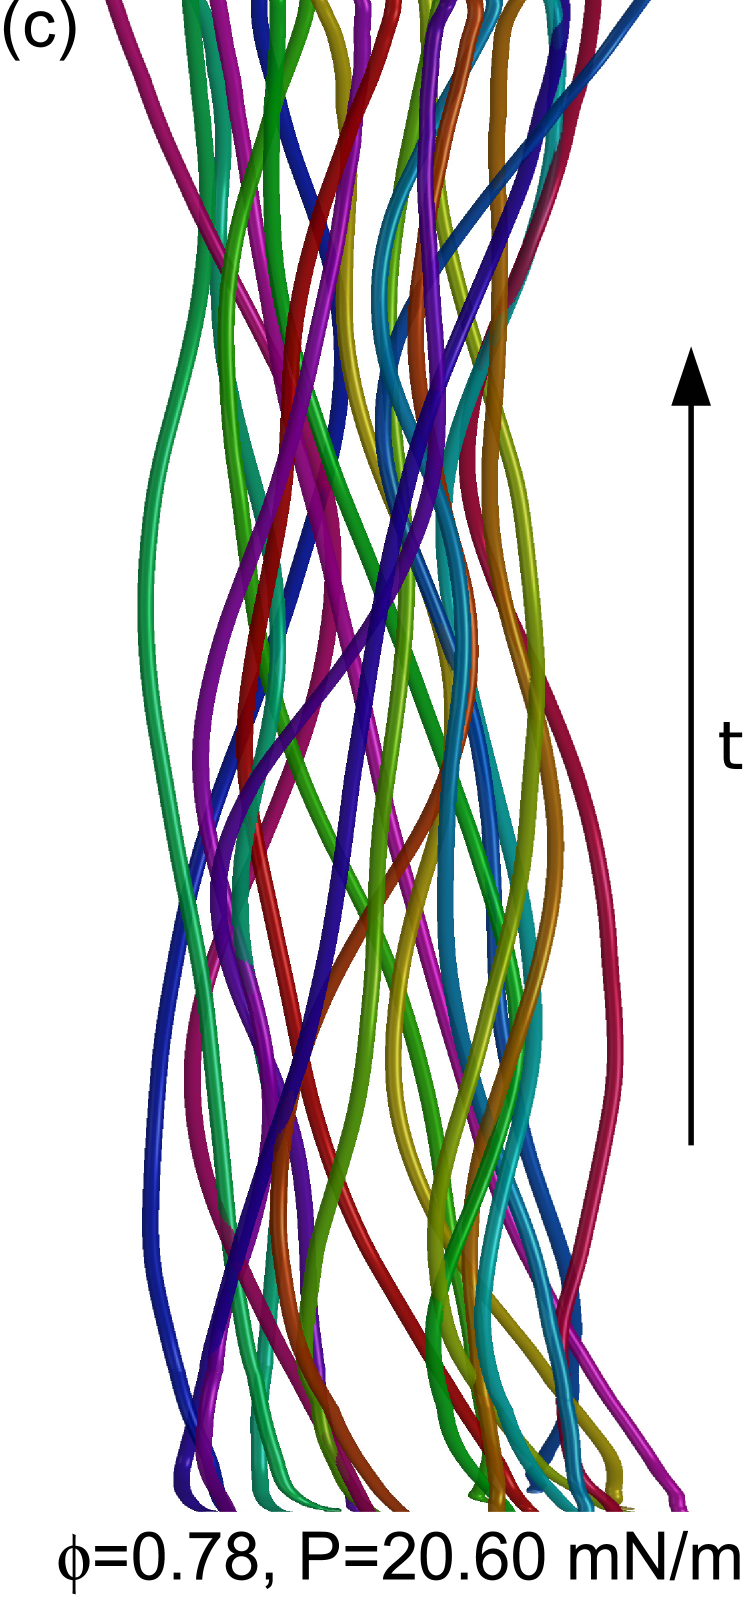
The central observation of this paper is that the trajectories of a two-dimensional assembly of grains take the form of a braid when plotted in a space-time diagram, as shown in Figure 1. Each strand of the braid represents the space-time trajectory of a single particle in the system, with the length of the braid corresponding to time and the entanglement of the strands arising from dynamics. The topological braid entropy, , is a measure of the degree of this entanglement. This approach has been successfully used to analyze the mixing efficiency in two-dimensional fluid flows [19, 20, 21, 22, 23, 24]. Specifically, the degree of lagrangian chaos created by the motion of rods in a fluid is quantitatively related to the topology of the corresponding braid. We anticipate that this notion might also be applicable to characterizing caging and dynamical heterogeneity in granular systems, by providing a quantitative measure of how close a system is to departing from ergodicity.
Here, we experimentally investigate the behavior of the average topological braid entropy extracted from the long-time dynamics of particles in a dense, driven granular material, examining the dependence on boundary conditions (constant pressure, CP, and constant volume, CV) and the inter-particle friction coefficient . We analyze the dynamics with two methods: a single-particle method (the self-diffusion constant, ) and a topological multi-particle method (the braid entropy, ). We find that both and are sensitive to the packing density and pressure of the system in the same qualitative way. However, at high and , both and are inaccessible due to insufficiently long experimental timescales or ill-definedness. In contrast, the braiding factor can be readily computed and offers an instantaneous view of the magnitude and intermittency of the rearrangements in the system.
2 Experiment
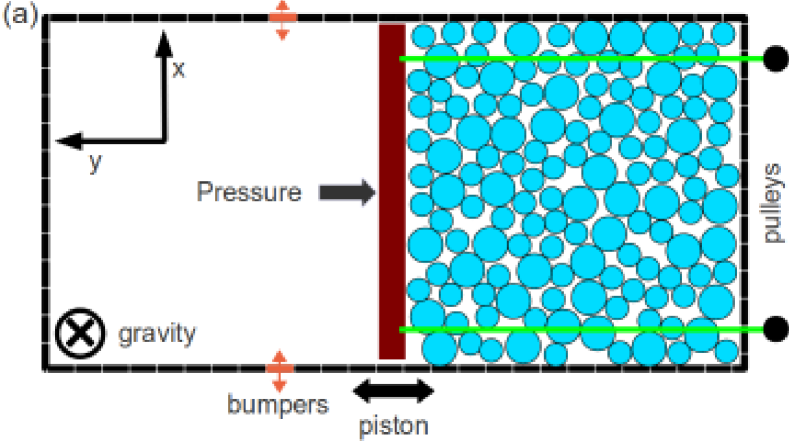
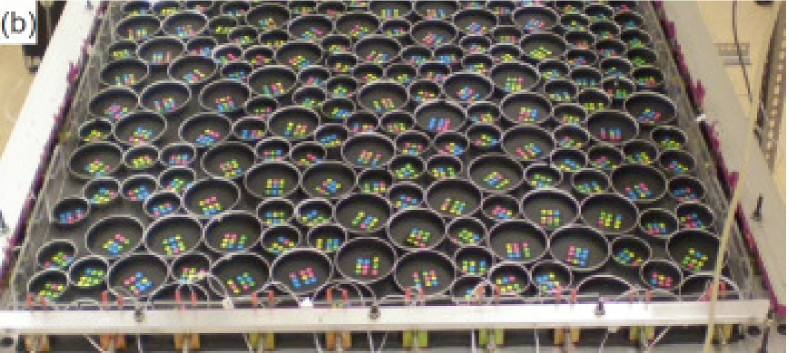
We conduct experiments on a two-dimensional granular assembly supported upon a nearly-frictionless horizontal air table and agitated by bumpers around the boundary. The granular material is bi-disperse, consisting of large and small particles with diameter of mm and mm and mass of g and g, respectively. The concentration of small/large grains is fixed at , so as to occupy similar areas. The apparatus is shown in Figure 1.
The boundary condition and the inter-particle friction can be changed for each experimental run. The boundary condition is established by the configuration of the piston (). By attaching weights to the piston via a low-friction pulley, the system is confined under constant pressure (CP) with a range of pressures mN/m. The constant volume (CV) boundary condition is established by fixing the piston to the table, where a range of packing densities to is explored by removing units of particles (two small and one large), maintaining the relative concentration. The inter-particle friction is selected by changing the material around the particles’ outer edge, with for PTFE (Teflon) wrapping, for bare polystyrene, and for rubber.
Around the boundary, an array of bumpers agitates the system on three sides. Bumpers are triggered pairwise via a computer at a high frequency ( Hz) to keep particles in motion despite energy dissipated in collisions. A triggered pair consists of a bumper and its corresponding bumper on the opposite wall. We have previously measured [25] that the effect of this driving system is to provide a thermal-like bath which maintains the granular material at constant average kinetic energy. More information on the driving and kinetics of the system can be found in references [25, 26, 27].
Images are taken or seconds apart depending on the -dependent dynamical timescales [26]. We record the positions of particles and map trajectories in time using unique particle identifiers [26]. The unique identifiers allow a relatively large , so we can confidently track the trajectories of individual particles and thereby be certain that topological dynamics do not erroneously result from the exchange of particle identities due to tracking mistakes. The packing density is calculated as with the particle radius and its local Voronoi cell area, calculated with Voro++ [28]. The average is taken over all particles in the central area of the table to reduce ordering effects induced by the boundaries [25, 29].
3 Results
3.1 Self-diffusion
The diffusion behavior is quantified using the mean-squared displacement
| (1) |
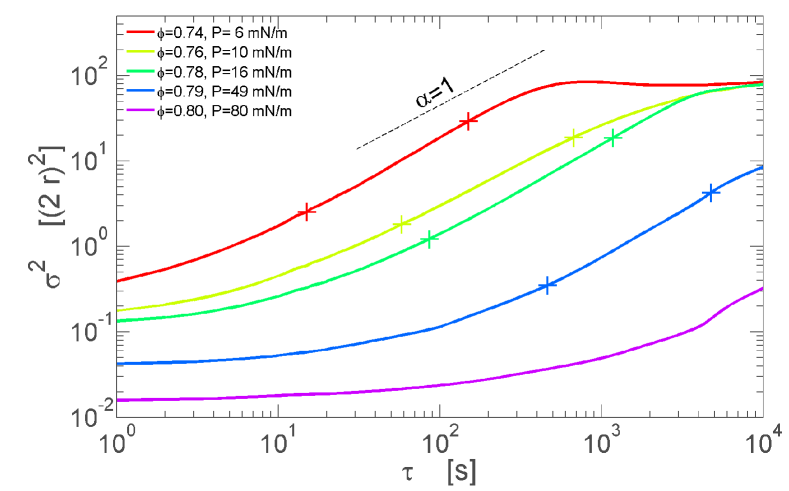
where the average is performed over all particles and all times . As can be seen in Figure 2, the slope of is not constant for all timescales . It is useful to define a local curve , where the value of characterizes the average individual dynamics associated with that . For short timescales (), the trajectories remain sub-diffusive, with . This arises because the particles are locally confined, or caged, by neighboring particles [3, 4]. At longer timescales (), each particle has experienced multiple cage-breaking events and thus resumes diffusive behavior. For timescales at which , we can measure the two-dimensional self-diffusion coefficient . Finally, if the diffusion process is fast enough, a typical particle covers a distance of many particle diameters within the duration of the experiment. In such cases, the exponent can again fall below unity at long times, due to the finite size of the experiment. This effect is visible in Figure 2 for the lowest at which we perform experiments.
In general, it is possible to calculate using for experiments which are of long enough duration to reach the regime. For this system, we find that this regime is reached even at values of near static random loose packing [26]. A convenient means to measure is to specify a tolerance on which defines a diffusive regime, marked by symbols in Figure 2. We calculate by fitting to the largest continuous region where the smoothed derivative of has a slope . The diffusive timescale is the timescale at which the particle motion first achieves diffusive behavior. With increasing packing density , becomes longer, as seen in Figure 2. For systems with large and , the range of over which was used to find (marked with crosses in Figure 2) becomes less than a decade.
Given the constraint that and the finite duration of our experiment s, it is not always possible to calculate a diffusion constant for systems with large or . One such example (, mN/m) is shown in Figure 2. A more conservative tolerance specification on would further decrease the experiments for which we could calculate a meaningful value of . In many experiments where we would wish to quantify the self-diffusion of particles, is in fact poorly-defined.
3.2 Braid entropy
The braid entropy is a measure of the degree of entanglement of trajectories [20, 22, 23]. To define it, first consider an imaginary rubber band enclosing the strings at the bottom of the braid shown in Figure 1c. As we slide the rubber band upwards, its length will tend to grow, as it is caught on the strings and is not allowed to traverse them. If the trajectories are chaotic, then will grow exponentially; the growth rate is then related to the Lyapunov exponent of a dynamical system. The braid entropy is defined as the asymptotic growth rate of ,
| (2) |
maximized over the choice of rubber band. This rubber band viewpoint is well-illustrated by taffy pullers and dough-kneading devices, where material is made to stretch exponentially by repeated folding [30]. The length is called the braiding factor.
When trajectories arise from a continuous dynamical system, then the braid entropy is a lower bound on the topological entropy of the system. The topological entropy is a measure of the loss of information about the identity of trajectories — it is an entropy in the sense of information theory. As more trajectories are included, the braid entropy converges to the topological entropy [31]. However, in a granular medium such as the one considered here, there is no underlying continuous dynamical system: the braid entropy is not necessarily related to some intrinsic topological entropy.
We follow the method described in [23] to calculate a good approximation to the braid entropy. This is a symbolic approach based on earlier work [32, 33] where a braid is first converted into its algebraic group representation for a particular choice of projection axis, and then used to measure the growth of hypothetical loops similar to the rubber band described above. We calculate the braiding factor using the trajectories of particles. Because particles can enter and leave the region captured by the camera, this choice of number provides a compromise between having too many particles with missing points in the trajectory, and too few particles with the maximum trajectory duration. We find that this choice of is sufficient for to capture the dynamics of the whole system, as will be discussed in more detail below.
The algebraic group representation is constructed from a list of the crossing times and identities of the particles involved in each crossing. Linear interpolation is used to determine the instant of crossing along the projection line, and thus obtain the braid generators. The experimental data is sufficiently well-resolved for this method [23] to accurately capture crossings.
The braid entropy (see Equation 2) is measured from the growth rate of the logarithm of the braiding factor. To obtain a single value for a particular run, we calculate a linear fit to . This entropy will be well-defined if meets three conditions: grows linearly in time, is an extensive quantity, and is independent of the choice of projection axis. We can directly check each of these conditions.
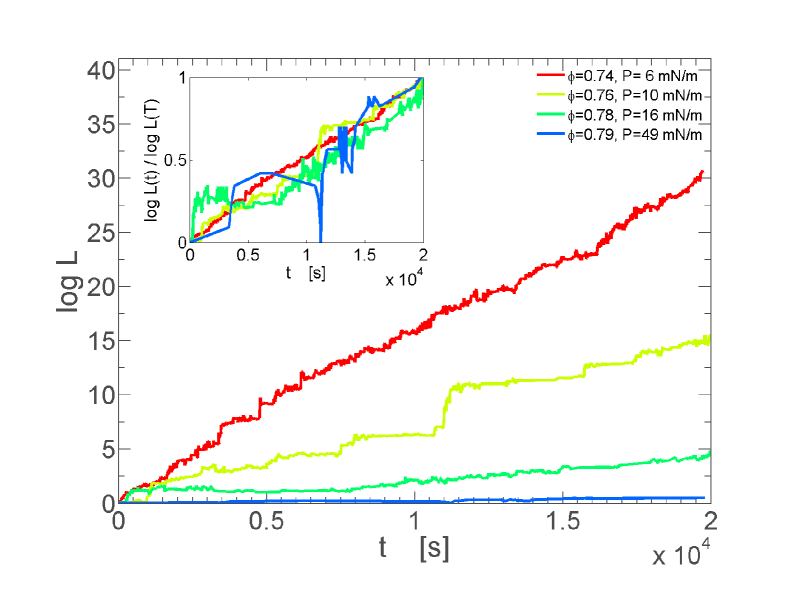
In Figure 3, we show for systems identical to Figure 2, omitting the (, mN/m) system as too few persistent crossings occur. We find grows, on average, linearly with time for . In the inset, is divided by its value at the maximum time, to highlights how the degree of linearity present at different values of .
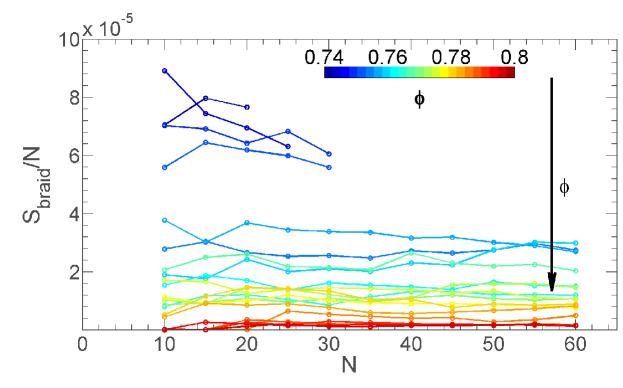
To test the extensivity of , we repeat the calculation described above for different numbers of particle trajectories, and test whether is a constant. Figure 4 shows the results of this test for a series of CP experiments at different . For , we observe that is quite flat, independent of boundary condition, , , and . This observation is consistent with being an extensive quantity. For very small ensembles of trajectories, (less than 10% of the system size), we find that the braid is too sparse to be representative of the dynamics of the system. In addition, it is difficult to test for extensivity in systems with low . In this regime, particles have a larger diffusion constant and are therefore more likely to enter and leave the region being monitored by the camera. Therefore, it is not possible to find particles which all satisfy the constraint on the minimum duration of continuous trajectories required to make a calculation of .
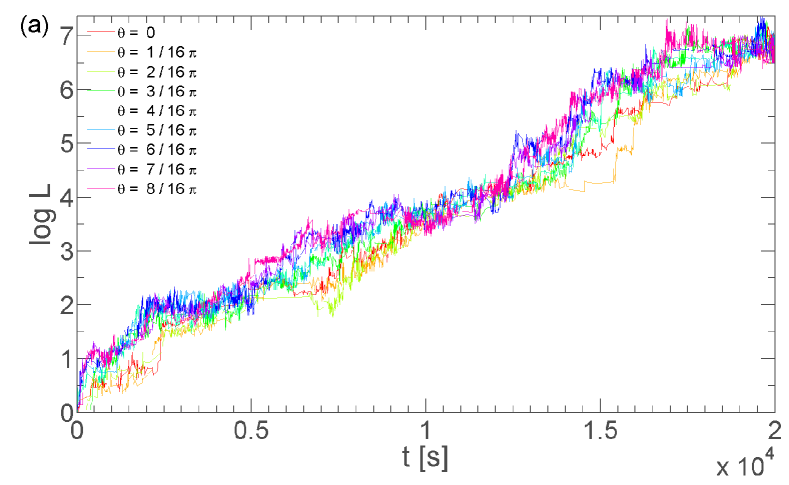
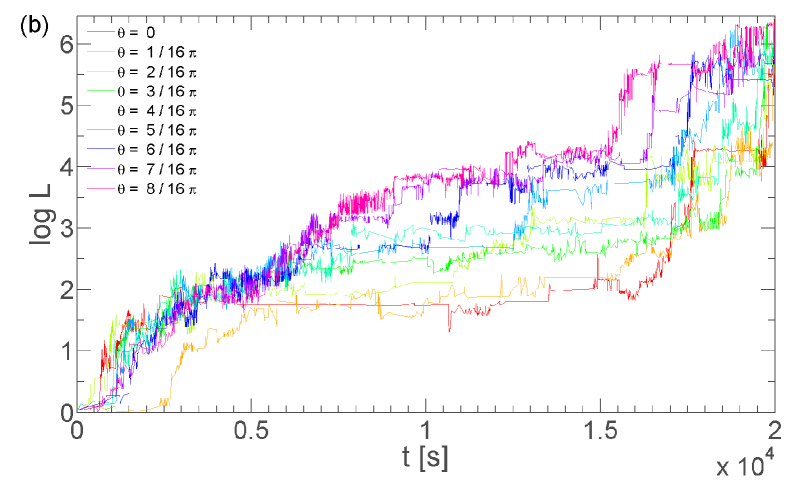
We compute for projections along axes oriented from to , and compare the results in Figure 5 for two characteristic systems, both confined at CP and with but at different and . For the example at low , we observe that is quite linear, even on short timescales, and that the choice of projection axis has little effect on the slope of or . However, in the higher- example, grows more quickly for the -projection than for the -projection, where the difference in entropy is . Increasing decreases the difference in entropy between projections. In the limit of long experiment duration, such differences in calculated entropies would be expected to vanish.
In examining the runs at large and large , we note the occurrence of two important features in : flat regions and steep increases. In Figure 5b (representative of such systems), we observe that may remain constant for an extended period of time, as in this case for the interval s. Such a flat curve signifies that particles are not exchanging neighbors. The second feature to note in Figure 5b is the sharp increases in beginning around s, for all choices of projection axis. Such steps correspond to a large number of crossings, no matter the chosen orientation, and therefore signify a collective rearrangement of particles (cage-breaking event). Another such event can be seen in Fig. 3 just after sec. Due to these events, the slope of can be much larger on short timescales. As such, the assumption that grows linearly in time is not valid for short timescales. However, we find is well-defined for systems where (, ) as is linear on the experimental timescale, extensive, and independent of axis of projection.
3.3 Comparison
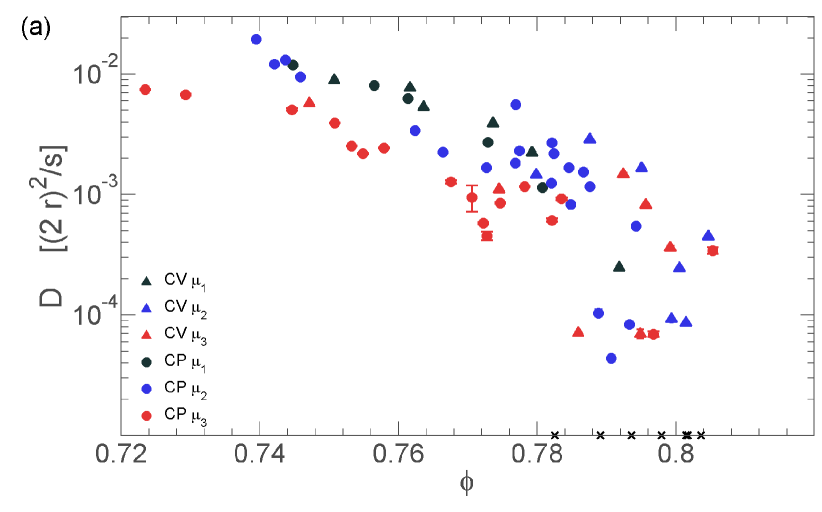
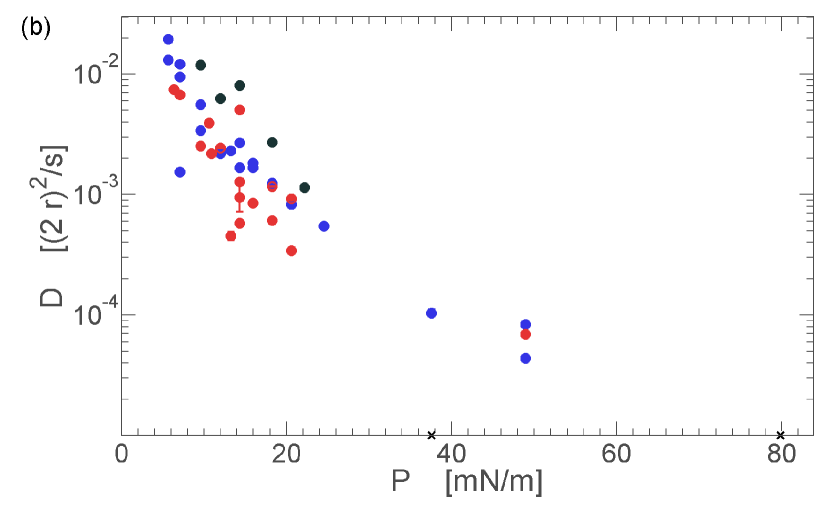
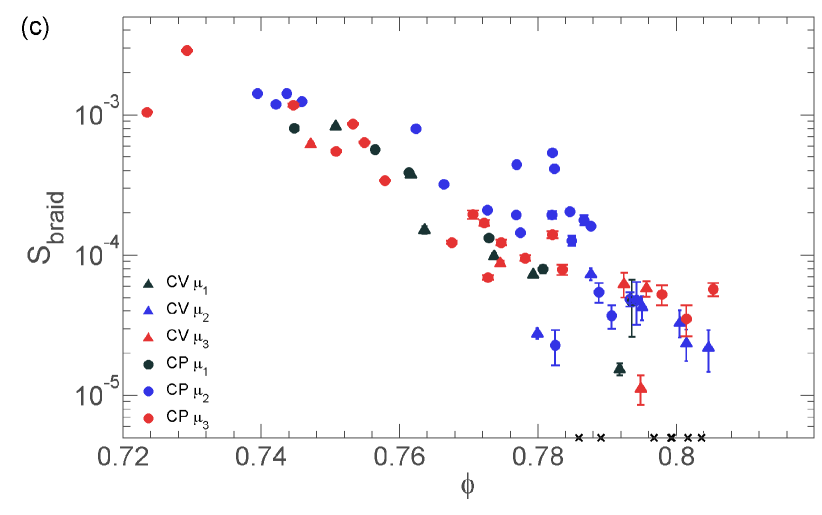
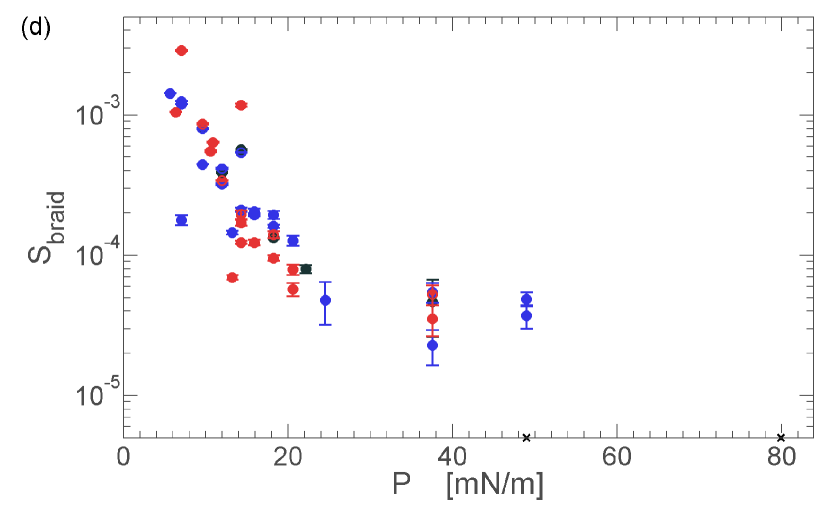
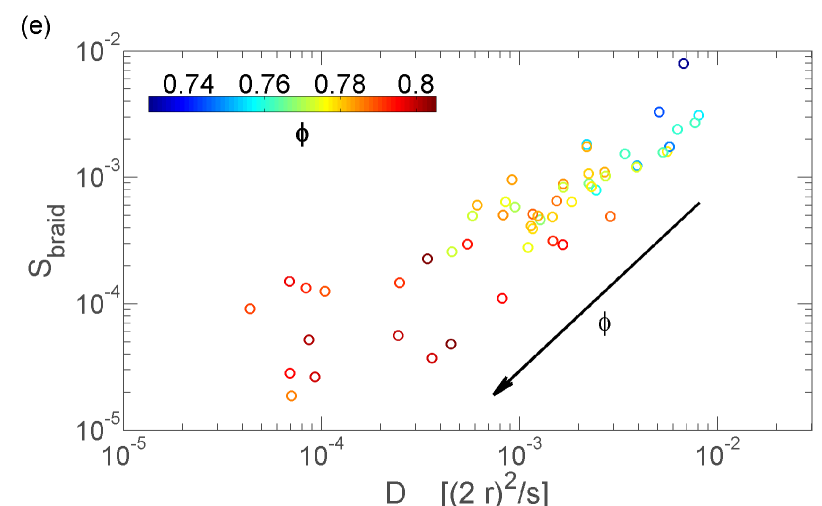
Based on prior work [4, 34, 26], we expect to decrease as increases. Indeed, in Figure 6ab, decreases with increasing and , independent of boundary condition (CP and CV). Similarly, we find that decreases with increasing and , as shown in Figure 6cd, respectively. Error bars represent the average standard error of from the set of 9 projections on axes oriented from to , where the magnitude of the standard error of is and does not depend on and . We observe little dependence on the inter-particle friction coefficient on and , though qualitatively decreases with increasing .
As discussed earlier, an experimental measurement of using requires a constraint on the value of to be used to find , which was selected to be . For systems with high , this constraint was not met and therefore is poorly defined, as shown in Figure 6ab. Similarly, is also poorly-defined for high systems as no longer grows linearly within the experimental timescale. For systems with and mN/m, neither nor are useful for measuring the dynamics even with long experimental timescales of s ( hr).
4 Discussion & Conclusion
We have investigated the behavior of the global braid entropy associated with the long-time dynamics of a dense granular assembly, and find it to be a well-defined quantity. Notably, was observed to be extensive, making it a promising candidate to play a role in the elaboration of a proper equation of state for dense granular systems. The breakdown in the measurement of coincides with the loss of diffusive dynamics, which is to be expected due to the association of the onset of caging behavior with a loss of ergodicity. The measurement of both and the single-particle diffusion coefficient provide a quantitative measure of the degree to which slower individual dynamics also results in poorer mixing. In spite of the fact that is a single-particle measurement, we find that it is a good predictor of the degree of mixing. One benefit of characterizing the average dynamics with instead of is that no arbitrary fitting parameters are necessary: the method is fully specified by the trajectories themselves.
In addition to providing a measure of the average behavior, the braiding factor provides a simple way to identify temporal events governing the dynamics (the crossings). In particular, displays increasing intermittency as the packing density or pressure is increased, with successions of plateaus and jumps indicative of collective neighborhood changes, or structural rearrangements. In fact, this departure from linearity can provide a measure of the chaoticity/ergodicity of the dynamics. The duration required to reach an acceptable degree of linearity, independent of projection axis, is a measurement of a characteristic dynamical timescale of the system. From this point of view, the experimental timescales over which we have investigated our dense granular systems were comparable or larger than this equilibration time, with the exception of the highest and systems we tested. For our experimental timescale, a loss of ergodicity was observed for systems with close proximity to the static jamming transition.
This investigation represents a first step towards a more systematic and controlled characterization of the braid entropy in two-dimensional granular systems. The braiding factor may be a means of obtaining system trajectories which could be analyzed with the recently developed thermodynamics of histories [35]. Quantitative benchmarking of in thermal and glassy systems, together with a complete comparison with the usual dynamical susceptibilities are promising directions for future investigations.
References
References
- [1] Andrea J. Liu and Sidney R. Nagel. The jamming transition and the marginally jammed solid. Annual Review of Condensed Matter Physics, 1(1):347–369, August 2010.
- [2] M van Hecke. Jamming of soft particles: geometry, mechanics, scaling and isostaticity. Journal of Physics: Condensed Matter, 22(3):033101, January 2010.
- [3] Eric R Weeks. Three-dimensional direct imaging of structural relaxation near the colloidal glass transition. Science, 287(5453):627–631, January 2000.
- [4] Eric R Weeks and D. Weitz. Properties of cage rearrangements observed near the colloidal glass transition. Physical Review Letters, 89(9):1–4, August 2002.
- [5] O. Pouliquen, M. Belzons, and M. Nicolas. Fluctuating particle motion during shear induced granular compaction. Physical Review Letters, 91(1):1–4, July 2003.
- [6] K Vollmayr-Lee. Single particle jumps in a binary Lennard-Jones system below the glass transition. Journal of Chemical Physics, 4781, 2004.
- [7] G. Marty and Olivier Dauchot. Subdiffusion and cage effect in a sheared granular material. Physical Review Letters, 94(1):1–4, January 2005.
- [8] P. M. Reis, R. A. Ingale, and Mark D Shattuck. Caging dynamics in a granular fluid. Physical Review Letters, 98(18):1–4, April 2007.
- [9] Luca Cipelletti and Laurence Ramos. Slow dynamics in glassy soft matter. Journal of Physics: Condensed Matter, 17(6):R253–R285, February 2005.
- [10] David Chandler and Juan P Garrahan. Dynamics on the way to forming glass: bubbles in space-time. Annual Review of Physical Chemistry, 61:191–217, March 2010.
- [11] L Berthier, G Biroli, J-P Bouchaud, L Cipelletti, D El Masri, D L’Hôte, F Ladieu, and M Pierno. Direct experimental evidence of a growing length scale accompanying the glass transition. Science, 310(5755):1797–800, December 2005.
- [12] Olivier Dauchot, G. Marty, and G. Biroli. Dynamical heterogeneity close to the jamming transition in a sheared granular material. Physical Review Letters, 95(26):1–4, December 2005.
- [13] Aaron S. Keys, Adam R. Abate, Sharon C. Glotzer, and Douglas J. Durian. Measurement of growing dynamical length scales and prediction of the jamming transition in a granular material. Nature Physics, 3(4):260–264, March 2007.
- [14] Frédéric Lechenault, Olivier Dauchot, Giulio Biroli, and Jean-Philippe Bouchaud. Critical scaling and heterogeneous superdiffusion across the jamming/rigidity transition of a granular glass. Europhysics Letters, 83(4):46003, August 2008.
- [15] Raphaël Candelier, Olivier Dauchot, and G. Biroli. Building blocks of dynamical heterogeneities in dense granular media. Physical Review Letters, 102(8):1–4, February 2009.
- [16] Raphaël Candelier and Olivier Dauchot. Journey of an intruder through the fluidization and jamming transitions of a dense granular media. Physical Review E, 81(1):1–12, January 2010.
- [17] A. Duri, T. Autenrieth, L.-M. Stadler, O. Leupold, Y. Chushkin, G. Grübel, and C. Gutt. Two-dimensional heterogeneous dynamics at the surface of a colloidal suspension. Physical Review Letters, 102(14):1–4, April 2009.
- [18] Raphaël Candelier, A. Widmer-Cooper, J. Kummerfeld, Olivier Dauchot, G. Biroli, P. Harrowell, and D. Reichman. Spatiotemporal hierarchy of relaxation events, dynamical heterogeneities, and structural reorganization in a supercooled liquid. Physical Review Letters, 105(13):1–4, September 2010.
- [19] Philip L. Boyland, Hassan Aref, and Mark A. Stremler. Topological fluid mechanics of stirring. Journal of Fluid Mechanics, 403:277–304, January 2000.
- [20] Jean-Luc Thiffeault. Measuring topological chaos. Physical Review Letters, 94(8):1–4, March 2005.
- [21] Emmanuelle Gouillart, Jean-Luc Thiffeault, and Matthew D Finn. Topological mixing with ghost rods. Physical Review E, 73(3):1–8, March 2006.
- [22] Jean-Luc Thiffeault and Matthew D Finn. Topology, braids and mixing in fluids. Philosophical transactions. Series A, Mathematical, physical, and engineering sciences, 364(1849):3251–66, December 2006.
- [23] Jean-Luc Thiffeault. Braids of entangled particle trajectories. Chaos, 20(1):017516, March 2010.
- [24] M. R. Allshouse and J.-L. Thiffeault. Detecting coherent structures using braids. Physica D, 241(2):95–105, 2012.
- [25] Kiri Nichol and Karen E. Daniels. Equipartition of rotational and translational energy in a dense granular gas. Phys. Rev. Lett., 108:018001, Jan 2012.
- [26] Frédéric Lechenault and Karen E Daniels. Equilibration of granular subsystems. Soft Matter, 6(13):3074, 2010.
- [27] James Puckett, Frédéric Lechenault, and Karen Daniels. Local origins of volume fraction fluctuations in dense granular materials. Physical Review E, 83(4):1–8, April 2011.
- [28] Chris H Rycroft. VORO++: a three-dimensional voronoi cell library in C++. Chaos, 19(4):041111, December 2009.
- [29] Kenneth W. Desmond and Eric R Weeks. Random close packing of disks and spheres in confined geometries. Physical Review E, 80(5):051305, November 2009.
- [30] M. D. Finn and J.-L. Thiffeault. Topological optimisation of rod-stirring devices. SIAM Review, 53(4):723–743, December 2011.
- [31] Stephen M. Cox and Matthew D. Finn. Two-dimensional Stokes flow driven by elliptical paddles. Physics of Fluids, 19(11):113102, 2007.
- [32] I. A. Dynnikov. On a Yang–Baxter map and the Dehornoy ordering. Russian Math. Surveys, 57(3):592–594, 2002.
- [33] J.-O. Moussafir. On computing the entropy of braids. Func. Anal. and Other Math., 1(1):37–46, 2006.
- [34] A. R. Abate and D. J. Durian. Approach to jamming in an air-fluidized granular bed. Phys. Rev. E, 74:031308, Sep 2006.
- [35] J.P. Garrahan, R.L. Jack, V. Lecomte, E. Pitard, K. van Duijvendijk, and F. van Wijland. First-order dynamical phase transition in models of glasses: an approach based on ensembles of histories. Journal of Physics A: Mathematical and Theoretical, 42:075007, 2009.