The geometry effects of an expanding Universe on the detection of cool neutral gas at high redshift
Abstract
Recent high redshift surveys for 21-cm absorption in damped Lyman- absorption systems (DLAs) take the number of published searches at to 25, the same number as at , although the detection rate at high redshift remains significantly lower (20% cf. 60%). Using the known properties of the DLAs to estimate the unknown profile widths of the 21-cm non-detections and including the limits via a survival analysis, we show that the mean spin temperature/covering factor degeneracy at high redshift is, on average, double that of the low redshift sample. This value is significantly lower than the previous factor of eight for the spin temperatures and is about the same factor as in the angular diameter distance ratios between the low and high redshift samples. That is, without the need for the several pivotal assumptions, which lead to an evolution in the spin temperature, we show that the observed distribution of 21-cm detections in DLAs can be accounted for by the geometry effects of an expanding Universe. That is, as yet there is no evidence of the spin temperature of gas rich galaxies evolving with redshift.
Subject headings:
quasars: absorption lines — radio lines: galaxies — galaxies: star formation — galaxies: evolution — galaxies: ISM — cosmology: observations1. Introduction
The 21-cm transition of hydrogen (H i) traces the cool component of neutral gas throughout the Universe, the raw material fuelling star formation. In emission, the low probability of the 21-cm spin-flip transition compounded by the inverse square law, renders this essentially undetectable at . In absorption, however, this sensitivity limit can be avoided since the line strength is independent of distance, depending only upon the column density of the absorbing gas and the flux from the background emission source. Nevertheless, detections remain rare with only 77 H i 21-cm absorption systems known at — 35 associated with the quasar host galaxy ()111Summarised in Curran & Whiting (2010), with the addition of three new associated absorbers reported in Curran et al. (2011a, c)., in addition to 42 systems located at some intermediate redshift along the sight-line to the quasar ()222Summarised in Curran (2010), with the addition of those reported by Curran et al. (2011b); Srianand et al. (2012).. These intervening absorbers occur in known or candidate333Usually in Mg ii absorption systems at , thus not being sufficiently redshifted to be detected in the optical band by ground-based telescopes. damped Lyman- absorption systems (DLAs, defined by their large neutral hydrogen column densities, ). Currently there are 1500 DLAs known (Curran et al., 2002; Noterdaeme et al., 2009), which could contain over 80% of the neutral gas mass density of the Universe (Prochaska et al., 2005).
The velocity integrated optical depth of the 21-cm absorption, , is related to the total neutral hydrogen column density via (Wolfe & Burbidge, 1975)
| (1) |
where [K] is the mean harmonic spin temperature of the gas, is the depth of the line (or r.m.s. noise in the case of a non-detection) and & the flux density and covering factor of the background continuum source, respectively. This latter parameter accounts for the possibility that the absorbing gas may not fully cover all of the background radio emission444Optical spectra from QSOs come from continuum sources pc in diameter, whereas radio sources can exceed pc (see Wolfe et al. 2005). and so all of the measured flux, , may not be intercepted, decreasing the sensitivity of the observation.
In both the associated and intervening cases the detections occur overwhelmingly at . For the associated systems, is generally not known, although Curran et al. (2008) attribute the lack of absorption at high redshift to the traditional optical selection of targets biasing searches towards the most luminous objects at these large distances, where the ultra-violet luminosity ionises the neutral gas.
In the optically thin regime (),555Which applies to all but one of the known 21-cm absorbers (Roberts et al., 1976). Equ. 1 reduces to , thus giving a degeneracy in the spin temperature/covering factor ratio (), for the DLAs where the column density is known. Therefore, since there is a mix of detections and non-detections in DLAs at , whereas at H i 21-cm tends not to be detected, Kanekar & Chengalur (2003) suggest an evolution in the spin temperature of the gas, where this is exclusively high at high redshift. This has direct bearing on the relative proportions of the cold and warm neutral media (e.g. Kanekar & Chengalur 2003; Srianand et al. 2012) and thus the reservoir of raw material available for star formation in the early Universe.
However, the conclusion that the spin temperature evolves with redshift relies on the assumption of a covering factor for each DLA, and Curran et al. (2005) have shown that, if the degeneracy is left intact, is not the order of magnitude larger at , as suggested by the distribution of Kanekar & Chengalur (2003). Furthermore, Curran & Webb (2006) suggest that geometry effects introduced by an expanding Universe could contribute to the distribution, indicating that the covering factor may actually be the dominant parameter. Since then there have been further high redshift searches (Curran et al., 2010; Srianand et al., 2012)666From the Sloan Digital Sky Survey DLA Data Releases 1–3 (Prochaska et al., 2005) and the SDSS DR7 DLA Data Release 7 (Noterdaeme et al., 2009), respectively.. This takes the number of confirmed DLAs and sub-DLAs searched for 21-cm to 25 at , the same number as at , thus allowing us to adequately address the spin temperature versus covering factor issue.
2. New H i 21-cm absorption search results
Although there are now equal numbers of 21-cm searches above and below , the detection rate at remains considerably lower (5 out of 25) than for the lower redshift sample (14 out of 25). Since the velocity integrated optical depth of the 21-cm absorption, normalised by the total neutral hydrogen column density, is proportional to (Sect. 1), this suggests that either is generally higher at or that is generally lower, or a combination of both, elevating the ratio at high redshift,
In order to obtain limits to the line strengths for the non-detections we must assign a profile width to each absorber. This is usually assumed, but here we estimate the full-width half maximum (FWHM) of the profile from the 21-cm FWHM—Mg ii 2796 Å equivalent width correlation for the detections, specifically FWHM [] [Å] (Curran et al., 2007b). Where the Mg ii equivalent widths are not available (generally at where the transition is redshifted out of the optical band), we estimate the putative FWHM via the metallicity—Mg ii equivalent width correlation (Murphy et al., 2007), specifically (Curran et al., 2007b). When neither the Mg ii equivalent width nor metallicity are available, we assign a FWHM of , the mean of the detections.777Excluding the FWHM = 240 outlier due to the absorber in the complex sight-line towards 3C 336 (Curran et al., 2007a).
Given the FWHM of the putative line, in order to obtain the best signal-to-noise ratio, based upon the detection of a single channel we would smooth the data to a spectral resolution of FWHM. This has the effect of improving/degrading the measured r.m.s noise, and thus the optical depth, by a factor of . The newly derived integrated optical depth of the line is thus
| (2) |
where is the peak optical depth of the putative line. This has the overall effect of scaling the previously published integrated optical depths, where these are calculated per channel, by
| (3) |
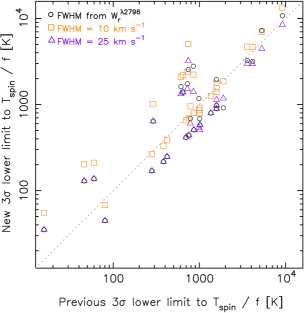
We therefore recalculate the limits from the published r.m.s. noise levels and spectral resolutions and in Fig. 1 show the effect this has on the limits compared to the previous values. For the method prescribed above (shown as circles), the largest change is for the absorber towards PKS 0118–272, for which the limit climbs from K (Kanekar & Chengalur, 2001) to K and, on average, the scaled values are 160 K “warmer” than those published. As seen from the figure, however, the new limits are mostly concentrated close the line, with equal numbers of points to either side.
Curran et al. (2007b) attribute the correlation between the velocity spreads of the 21-cm and Mg ii profiles to the neutral and singly ionised gas being spatially coincident in 21-cm detected DLAs. However, given the possibility that much of the ionised magnesium could arise in warm photoionised gas, and is thus not tracing the same sight-line as the 21-cm, in Fig. 1 we also show the limits derived from assuming a single FWHM. For 10 (e.g. Srianand et al. 2012), we find the largest difference to be 4300 K, with a mean rise of 600 K and for 25 , the largest difference is 2500 K, with a mean decrease of 120 K. Thus, scalings implementing the mean FWHM of the detections have less of an effect than using 10 , although either method is preferable to the inhomogeneously calculated published values, since each is consistent in smoothing the data to the FWHM and thus calculating the limit per smoothed channel.
In Fig. 2 we show the newly derived limits against the absorption redshift.
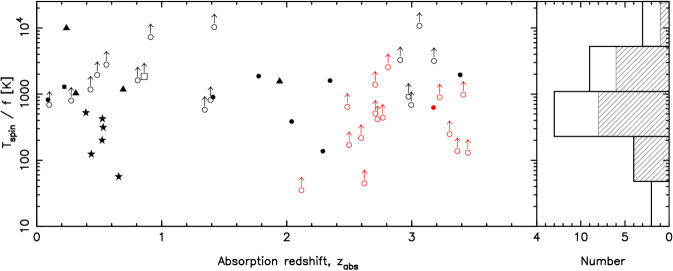
Applying a survival analysis to the lower limits in , via the asurv package (Isobe et al., 1986), we obtain mean values of and . That is, the mean value of at is double that at (3600 cf. 1800 K). This is considerably less than the ratio of 8.0 between the two redshift regimes (8100 cf. 1020 K) found by applying the survival analysis to the spin temperatures of Kanekar & Chengalur (2003). Since our recalculation of the limits has actually slightly increased the mean value of the spin temperature/covering factor degeneracy, we attribute this significant difference to the covering factor being left as a free parameter.
3. Spin Temperature or Covering Factor
The addition of the new data, together with our treatment of the non-detections, indicates that a factor of only in the spin temperature/covering factor ratio between the two redshift regimes need be accounted for. However, it remains unclear whether or is the dominant factor.
There have been several attempts to quantify the covering factor through Very Long Baseline Array (VLBA) imaging of the background quasar, in which is estimated as the ratio of the compact unresolved component’s flux to the total radio flux (e.g. Briggs & Wolfe 1983; Kanekar et al. 2009; Srianand et al. 2012). From this, Kanekar et al. (2009) conclude that for the 21-cm searches, and hence low covering factors cannot explain the dearth of detections at high redshift. However, this method gives no information on the extent of the absorber nor on how effectively it covers the emission. Neither does it give information on the depth of the line when the extended continuum emission is resolved out.
So although an evolution in spin temperature with redshift is implied, this method invokes several crucial assumptions which could even lead to unphysical results (e.g. the pc obtained for the extent of PKS 0405–331 at 398 MHz, Kanekar et al. 2009). On the other hand, due to the effects of an expanding Universe, objects at are always close to a single angular diameter distance ( Mpc), irrespective of redshift (e.g. Hogg 1999). Beyond , the angular diameter distance decreases with increasing redshift, which will lead to a natural imbalance between the low and high-z DLA samples. In the small angle approximation the covering factor can be defined as
| (4) |
where is the angle subtended by the background emission and and the linear sizes of the cool absorbing gas and background 21-cm emission, respectively (Fig. 3).
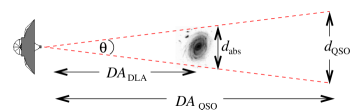
Since absorbers at are always at a similar angular diameter distance as the background quasar (), these will therefore, for a given system, always have a lower coverage than a counterpart with (Curran & Webb, 2006), an inequality which can only exist at .
In Fig. 4 we show the angular diameter distance ratio, , versus the absorption redshift for the 21-cm searches.
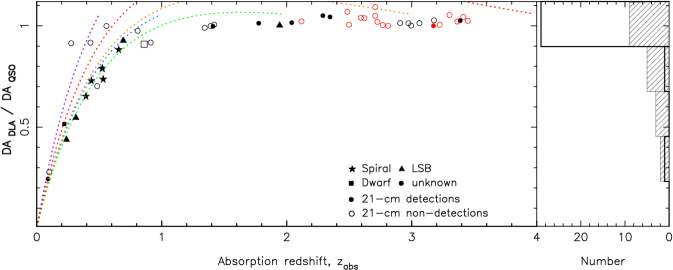
Note that this distribution is free from any assumptions (including our own with regard to the FWHMs of the non-detections). From this we see a mix of at low redshift (the low values are due to DLAs towards much higher redshift quasars), whereas values at are exclusively high. That is, a reproduction of the “spin temperature” distribution of Kanekar & Chengalur (2003). At least the pattern if not the magnitude, given that Kanekar & Chengalur (2003) suggest that the average spin temperature at is eight times that at , which is clearly not reproduced in Fig. 4.
Referring to Sect. 2, however, we only require at to be about double that at in order to account for the distribution. From Equ. 4, for a given absorber and emitter size, , and we find mean values of and , a ratio of 1.6. It is therefore apparent that the distribution in angular diameter distance ratios, and their effect on the covering factor, is close to that required to account for the observed distribution.
Updating the statistics with the new results, we find a binomial probability of of obtaining at least 9 out of 11 detections at and 29 out of 39 non-detections at , by chance.888 is the cut used by Curran & Webb (2006) and, although arbitrary, this is the lowest ratio which gives an appreciable enough sample size in the lower bin. When a ratio of 0.9 is used there are 38 DLAs with and 12 with , which increases the significance of the correlation to . That is, a significance of , lending weight to the argument that large angular diameter distance ratios are correlated with the non-detection of 21-cm absorption. Since there is no physical link between the spin temperature and angular diameter distance ratio, this suggests that, in the absence of any knowledge of the absorption cross-section in relation to the emitter extent, the covering factor plays a much more major rôle than the spin temperature in the detection of 21-cm absorption.
4. Discussion and Summary
With the advent of 21-cm absorption searches in high redshift DLAs there has been much debate on whether an evolution in spin temperature or lower covering factors are responsible for the relatively low number of detections at . New searches of SDSS DLAs, which occult the sight-lines to radio-loud quasars, take the number searched at these redshifts to the same as at , giving much needed data with which to address this issue. By giving the 21-cm non-detections a more thorough analysis than in other studies, through estimating the FWHMs of the non-detected profiles from the observed optical properties and applying a survival analysis to the lower limits in , we find:
-
1.
That mean the spin temperature/covering factor ratio at is only double that found at . This is significantly lower than the factor of eight in spin temperature, determined from previous estimates of the covering factor.
-
2.
This reduced factor can be accounted for by the effects of an expanding Universe, where the angular diameter distance at is always close to, and sometimes exceeds, that of the background radio source. That is, the high redshift DLAs are always disadvantaged in how effectively they can intercept the background radio flux for a given DLA–QSO pair.
-
3.
Since the non-detections tend to be associated with high ratios in the DLA–QSO angular diameter distances (), whereas the detections are associated with low ratios (), at all redshifts, this strongly suggests that the coverage of the background radio source by the absorber is the dominant factor.
This runs contrary to previous studies which estimate the covering factor via VLBA imaging, which support an evolution in the spin temperature. However, these estimates are based upon several pivotal assumptions, whereas the angular diameter distance ratios are not.
We therefore suggest that there is no evidence for the spin temperature to increase with redshift,
which implies no evolution in the fraction of the warm neutral gas content of DLAs.
Curran et al. (2007b)
find a –metallicity anti-correlation. If the spin temperature does not evolve
with redshift, as does the metallicity (Prochaska et al., 2003; Curran et al., 2004), this may imply that the metallicity is proportional
to the covering factor, which could be due to the larger absorbing cross-sections of the larger galaxies, as evident through the
spirals which have the largest metallicities and the lower values
of (Curran et al., 2010).
This research has made use of the NASA/IPAC Extragalactic Database (NED) which is operated by the Jet Propulsion Laboratory, California Institute of Technology, under contract with the National Aeronautics and Space Administration. This research has also made use of NASA’s Astrophysics Data System Bibliographic Service and asurv Rev 1.2 (Lavalley et al., 1992), which implements the methods presented in Isobe et al. (1986). The Centre for All-sky Astrophysics is an Australian Research Council Centre of Excellence, funded by grant CE11E0090.
References
- Briggs & Wolfe (1983) Briggs, F. H. & Wolfe, A. M. 1983, ApJ, 268, 76
- Curran (2010) Curran, S. J. 2010, MNRAS, 402, 2657
- Curran et al. (2005) Curran, S. J., Murphy, M. T., Pihlström, Y. M., Webb, J. K., & Purcell, C. R. 2005, MNRAS, 356, 1509
- Curran et al. (2010) Curran, S. J., Tzanavaris, P., Darling, J. K., Whiting, M. T., Webb, J. K., Bignell, C., Athreya, R., & Murphy, M. T. 2010, MNRAS, 402, 35
- Curran et al. (2007a) Curran, S. J., Tzanavaris, P., Murphy, M. T., Webb, J. K., & Pihlström, Y. M. 2007a, MNRAS, 381, L6
- Curran et al. (2007b) Curran, S. J., Tzanavaris, P., Pihlström, Y. M., & Webb, J. K. 2007b, MNRAS, 382, 1331
- Curran & Webb (2006) Curran, S. J. & Webb, J. K. 2006, MNRAS, 371, 356
- Curran et al. (2002) Curran, S. J., Webb, J. K., Murphy, M. T., Bandiera, R., Corbelli, E., & Flambaum, V. V. 2002, PASA, 19, 455
- Curran et al. (2004) Curran, S. J., Webb, J. K., Murphy, M. T., & Carswell, R. F. 2004, MNRAS, 351, L24
- Curran et al. (2011a) Curran, S. J., Whiting, M., Murphy, M. T., Webb, J. K., Bignell, C., Polatidis, A. G., Wiklind, T., Francis, P., & Langston, G. 2011a, MNRAS, 413, 1165
- Curran & Whiting (2010) Curran, S. J. & Whiting, M. T. 2010, ApJ, 712, 303
- Curran et al. (2011b) Curran, S. J., Whiting, M. T., Tanna, A., Bignell, C., & Webb, J. K. 2011b, MNRAS, 413, L86
- Curran et al. (2011c) Curran, S. J., Whiting, M. T., Webb, J. K., & Athreya, A. 2011c, MNRAS, 414, L26
- Curran et al. (2008) Curran, S. J., Whiting, M. T., Wiklind, T., Webb, J. K., Murphy, M. T., & Purcell, C. R. 2008, MNRAS, 391, 765
- Hogg (1999) Hogg, D. W. 1999, astro-ph/9905116
- Isobe et al. (1986) Isobe, T., Feigelson, E., & Nelson, P. 1986, ApJ, 306, 490
- Kanekar & Chengalur (2001) Kanekar, N. & Chengalur, J. N. 2001, A&A, 369, 42
- Kanekar & Chengalur (2003) —. 2003, A&A, 399, 857
- Kanekar et al. (2009) Kanekar, N., Lane, W. M., Momjian, E., Briggs, F. H., & Chengalur, J. N. 2009, MNRAS, 394, L61
- Lavalley et al. (1992) Lavalley, M. P., Isobe, T., & Feigelson, E. D. 1992, in BAAS, Vol. 24, 839–840
- Murphy et al. (2007) Murphy, M. T., Curran, S. J., Webb, J. K., Ménager, H., & Zych, B. J. 2007, MNRAS, 376, 673
- Noterdaeme et al. (2009) Noterdaeme, P., Petitjean, P., Ledoux, C., & Srianand, R. 2009, A&A, 505, 1087
- Prochaska et al. (2003) Prochaska, J. X., Gawiser, E., Wolfe, A. M., Castro, S., & Djorgovski, S. G. 2003, ApJ, 595, L9
- Prochaska et al. (2005) Prochaska, J. X., Herbert-Fort, S., & Wolfe, A. M. 2005, ApJ, 635, 123
- Roberts et al. (1976) Roberts, M. S., Brown, R. L., Brundage, W. D., Rots, A. H., Haynes, M. P., & Wolfe, A. M. 1976, AJ, 81, 293
- Srianand et al. (2012) Srianand, R., Gupta, N., Petitjean, P., Noterdaeme, P., Ledoux, C., Salter, C. J., & Saikia, D. J. 2012, MNRAS, accepted (arXiv:1112.1438)
- Wolfe & Burbidge (1975) Wolfe, A. M. & Burbidge, G. R. 1975, ApJ, 200, 548
- Wolfe et al. (2005) Wolfe, A. M., Gawiser, E., & Prochaska, J. X. 2005, ARA&A, 43, 861