Near-Field Resonance at Far-Field Anti-Resonance: Plasmonically Enhanced Light Emission with Minimum Scattering Nanoantennas
Abstract
We demonstrate that a periodic array of optical antennas sustains a resonant Near-Field (NF) and an anti-resonant Far-Field (FF) at the same energy and in-plane momentum. This phenomenon arises in the context of coupled plasmonic lattice resonances, whose bright and dark character is interchanged at a critical antenna length. The energies of these modes anti-cross in the FF, but cross in the NF. Hence, we observe an extremely narrow bandwidth emission enhancement from quantum dots in the proximity of the array, while the antennas scatter minimally into the FF. Simulations reveal that a standing wave with a quadrupolar field distribution is the origin of this dark collective resonance.
pacs:
73.20.Mf, 42.25.Fx, 73.21.-b, 85.35.BeResonance phenomena are at the heart of nearly any approach towards controlling the emission, manipulation, or detection of light. A resonance frequency is commonly identified as that for which the response of a system is enhanced. For a plane wave excitation, this implies that more energy is removed from an incident beam at resonance than off resonance. In the presence of surface electromagnetic waves, the definition of a resonance requires a careful reconsideration, since the spectrum of radiation may be different in the Near-Field (NF) with respect to the Far-Field (FF) Shchegrov et al. (2000); Bryant et al. (2008); Ross and Lee (2009). Such differences have a profound significance for the field of metallic nano-optics, partly because the emergence of optical antennas has been largely fueled by an increased capability to manipulate optical near fields Novotny and van Hulst (2011). The basis for achieving such a control relies on the excitation of surface plasmon polaritons - collective oscillations of the free electrons in the metal driven by an electromagnetic field. However, not all surface plasmon modes are visible in the FF spectrum. In 2001, a class of plasmonic modes which manifest as resonances that can be excited or observed in the NF but not in the FF, so-called dark modes, were theoretically predicted Stockman et al. (2001). These dark resonances have attracted much interest in recent years Hentschel et al. (2010); Stockman (2010), as they hold supreme qualities for the realization of SPASERS Bergman and Stockman (2003); Li et al. (2005), subwavelength guiding of optical radiation with suppressed radiative losses Liu et al. (2009a), plasmonic analogs of electromagnetically induced transparency Zhang et al. (2008); Yannopapas et al. (2009); Liu et al. (2009b); Kekatpure et al. (2010), and cloaked sensors Alù and Engheta (2009). In particular, theoretical work by Alù and Engheta suggests that it is possible to strongly suppress the FF radiation from a nanoantenna while preserving an enhanced NF sensitivity Alù and Engheta (2009, 2010) - an optical counterpart to radio frequency minimum scattering antennas. As pointed out by García de Abajo in Ref. de Abajo (2009), by having an enhanced interaction with its local environment but a minimum interaction with distant sources and detectors, such a minimum scattering antenna is effectively seeing without being seen.
In this Letter, we experimentally demonstrate that a periodic array of plasmonic nanoantennas displays a local minimum in its FF extinction but a maximum in the average NF enhancement in the plane of the array. This is evidenced from an enhanced emission of quantum dots in the vicinity of the array at an energy and in-plane momentum for which the FF extinction is minimized. Hence, a NF resonance co-exists in energy and in-plane momentum with a FF anti-resonance. Finite Difference in Time Domain (FDTD) simulations show that this phenomenon is based on the coupling of two counter-propagating surface polaritons whose energies anti-cross in the FF extinction but cross in the NF enhancement. A standing wave with a quadrupolar, i.e., dipole forbidden, field distribution is formed at the NF crossing energy. This results in a collective resonance which is dark in the FF, but bright in the NF.
For the experiments, we have fabricated a mm2 periodic array of gold nanoantennas onto a silica substrate by means of electron beam lithography. The antennas have dimensions nm3, and the lattice constants are nm and nm. We spin-coated a 600 nm layer of PbS/CdS core/shell Quantum Dots (QDs) in a polystyrene matrix, hereafter referred as the QD layer, on top of the array. The QDs emit at a peak energy of eV with a full width at half maximum of eV. Further details on their synthesis and optical properties may be found in the supplemental information sup (a).
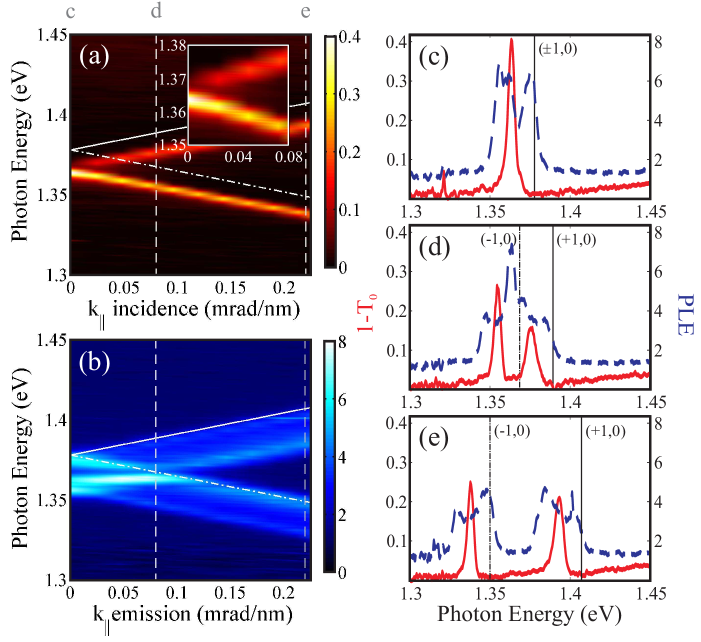
Figure 1(a) shows the measured variable angle FF extinction, defined as , with the zeroth order transmission through the sample normalized to the transmission through the substrate and QD layer. The measurements are shown as a function of the incident photon energy and the wave vector component parallel to the long axis of the antennas, , where is the magnitude of the free space wave vector and is the angle of incidence. The incident light is polarized parallel to the short axis of the nanoantennas, i.e., s-polarized. The () and () Rayleigh anomalies are indicated by the white solid and dash-dotted lines, respectively. They represent the conditions for which the corresponding diffraction orders are radiating in the plane of the array. Their dispersion is calculated from the conservation of the parallel component of the wave vector, expressed as , with the magnitude of the scattered wave vector, the wave vector components parallel to the surface, the integers (, ) defining the order of diffraction, and ,) the reciprocal lattice vector. An effective refractive index of n=1.50 due to the underlying substrate and the QD layer was used to calculate the Rayleigh anomalies. The two peaks in extinction following the dispersion of the Rayleigh anomalies on the low energy side correspond to the excitation of Surface Lattice Resonances (SLRs), which are collective Fano resonances arising from the diffractive coupling of localized surface plasmons Zou and Schatz (2004); Kravets et al. (2008); Auguié and Barnes (2008); Chu et al. (2008); Vecchi et al. (2009a, b); Giannini et al. (2010). The mutual coupling of SLRs leads to an anti-crossing in their dispersion relation, i.e., the opening of a frequency gap close to Rodriguez et al. (2011). The inset of Fig. 1(a) displays a magnified view of the gap. Notice that the dispersion of the bright (-1,0) SLR flattens and the extinction increases near the anti-crossing. This indicates the formation of standing waves with an enhanced density of optical states at the band edge. A narrowing linewidth and diminishing extinction are observed for the (+1,0) SLR, which are the signature of subradiant damping Ropers et al. (2005); Rodriguez et al. (2011).
Figure 1(b) shows the measured variable angle PhotoLuminescence Enhancement (PLE), defined as , with and the emission from the QD layer inside and outside the nanoantenna array, respectively. The sample was excited by the 514 nm line of an Ar/Kr laser at a fixed angle () of incidence, and the s-polarized emission was collected as a function of the angle that the detector subtends with respect to the normal. The PLE is shown as a function of the emitted photon energy and wave vector component parallel to the long axis of the antennas, . Although the PLE displays features approximately resembling those in extinction (albeit broader), a detailed inspection reveals an unusual non-correspondence for some values of . To illustrate this, we plot in Figs. 1(c)-(e) the spectra in Figs. 1(a) and 1(b) at three values of , with the extinction as solid red lines and the PLE as dashed blue lines, respectively. At (Fig. 1(c)), a single peak in extinction associated with the bright (-1,0) SLR arises at eV. The PLE displays two peaks with a -fold enhancement: one at eV corresponding to the bright (-1,0) SLR, and another at eV corresponding to the dark (+1,0) SLR. We attribute the enhancement of the QD emission by the (+1,0) SLR, which is dark in the FF, to the local nature of the excitation. As it was shown in a recent work Rodriguez et al. (2011), the dark and bright character of SLRs has its origin in the symmetry of the modes. However, the QD emitters are sensitive to the local field rather than the global symmetry of the array, which allows for their interaction with dark modes Stockman et al. (2001). Figure 1(d) shows the spectra at mrad/nm, where the extinction displays peaks at eV and eV corresponding to the (+1,0) and (-1,0) SLRs, respectively. The PLE also shows two broad features centered at approximately the same energies, but more striking is the narrow (60 meV full width at half maximum) feature at eV leading to a -fold enhancement of the QD emission. Notice that at the same energy the FF extinction is very low. It is remarkable that at an energy and in-plane momentum for which the nanoantennas scatter minimally when probed from the FF there is an emission enhancement that is superior to the one observed for the bright mode at . The physics behind this NF resonance at a FF anti-resonance is the focus of this work. For comparison, we show in Fig. 1(e) the measurements at mrad/nm, where two broad features in the PLE are observed near the energies of the () SLRs in extinction, as previous work has shown Vecchi et al. (2009a).
In what follows, we elucidate by means of FDTD simulations the conditions leading to the NF resonance at a FF anti-resonance. We investigate gold nanoantenna arrays with the same lattice constants as in the experiments, surrounded by a fully homogeneous environment of n=1.46. The dielectric function of gold is taken from Ref. Palik (1985), and fitted in the range of interest with a Drude model. The incident light has an in-plane momentum and a polarization vector as in the experiments.
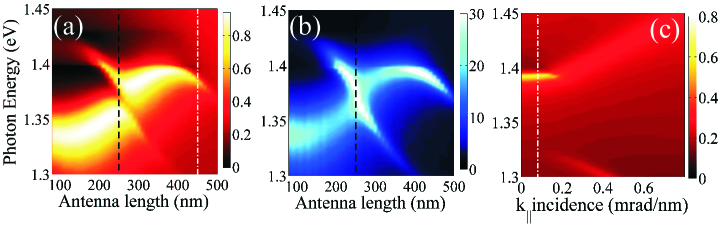
Figure 2 shows simulations results for the (a) FF extinction and (b) average NF Intensity Enhancement (IE) defined as IE , with the total electric field at a plane intersecting the antennas at their mid-height and the incident field. The antenna dimensions are nm3, and the spectral response to a plane wave with mrad/nm is shown as a function of the antenna length . Besides , all other parameters are kept constant. The high and low energy resonances in both figures are the () and () SLRs, respectively. Their extinction and NF IE vary with the antenna length as a consequence of retardation and radiative damping. Notice that for nm the (+1,0) SLR is bright, i.e., it has a high extinction, whereas the (-1,0) SLR is dark, i.e., it has a narrowing linewidth and a low extinction. The extinction of the (-1,0) SLR vanishes for nm. To exemplify the FF dispersion diagram in the long antenna regime, we show in Fig. 2(c) the variable angle extinction spectra calculated for an array of antennas with dimensions nm3. We clarify that the spectra in Fig. 2(c) at mrad/nm and in Fig. 2(a) at nm (both denoted by a white dash-dotted line) are identical. The dispersion diagram in Fig. 2(c) shows that, as the two SLR bands approach each other near normal incidence, the high energy band flattens and the extinction and linewidth of the low energy band vanish. This results in the opening of a large gap. As observed in Fig. 2(a) and 2(b), the properties of the high and low energy SLRs bands are interchanged for nm. Thus, in the short antenna regime the flattening of the band occurs for the (-1,0) SLR, while subradiant damping onsets for the (+1,0) SLR. This explains why in a recent work the (+1,0) SLR was bright and the (-1,0) SLR was dark Rodriguez et al. (2011) (as in Fig. 2(c)), whereas in the measurements presented here (Fig. 1) this behavior is reversed. These results demonstrate that the onset of subradiant damping can be modified, or even halted for a given band, by designing the antenna length. Furthermore, a remarkable phenomenon arises at the critical antenna length for which the properties of SLRs are swapped, which occurs for nm nm. In this regime, the FF displays an energy anti-crossing characteristic of coupled surface modes, but the NF displays a crossing of the two bands. At this point the NF is resonant at an energy and in-plane momentum for which the FF is anti-resonant.
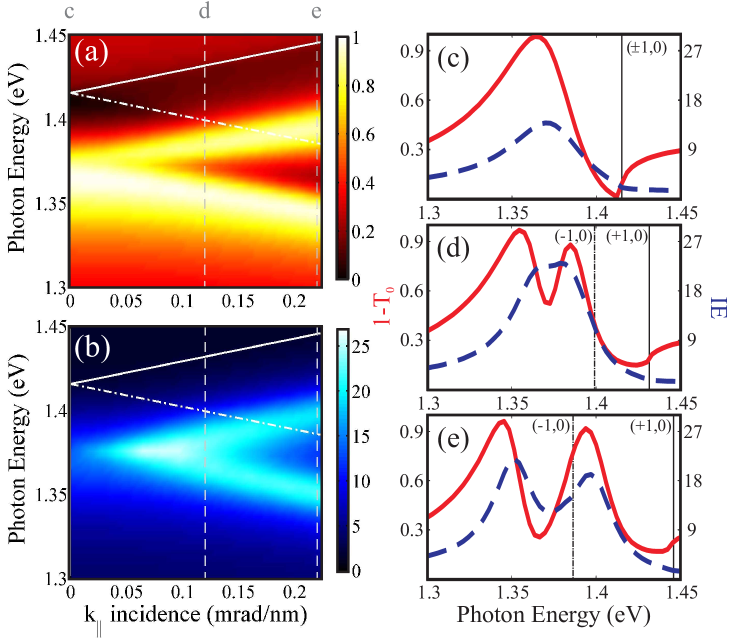
The connection between the above spectra as a function of the antenna length and the experimental results of Fig. 1 is elucidated in Fig. 3 by considering FDTD simulations for antennas of nm. This length is indicated by the black dashed lines in Figs. 2(a) and 2(b), and it is very close to the one in the experiments. The value of was adjusted slightly to obtain resonances at the same energies as in the experiment, since differences in geometry (especially near the antenna corners) and in the dielectric function of gold result in deviations from experiments. All other parameters in the simulation are identical to the ones discussed for Fig. 2, except that now the spectra are calculated as function of the incident for a fixed antenna length. The FF extinction is shown in Fig. 3(a), and the NF IE is shown in Fig. 3(b). As in the experiments, the (,0) SLRs are red-shifted with respect to the Rayleigh anomalies in extinction. The NF IE displays similar features, but they are broader, and shifted towards higher with respect to the FF. The latter condition leads to a maximum NF IE at a nonzero , as we show next by making cuts of Figs. 3(a) and 3(b) at three values of . At normal incidence, Fig. 3(c) shows a single extinction peak attributed to () SLRs. The NF also displays a single peak because the dark mode can not be excited by the plane wave due to its antisymmetric character Rodriguez et al. (2011). In Fig. 3(d) we consider mrad/nm, where the NF displays a single peak at an energy for which the FF displays a dip between two peaks. At this energy a NF resonance coincides with a FF anti-resonance. Note that the same behavior can be observed for mrad/nm (the value inspected in the experiments), but with a more intense NF at the expense of a shallower extinction dip. This trade-off between NF enhancement and diminished extinction has its origin in absorption by the metal. As we will show ahead, destructive interference may minimize the FF scattering, but the intensified NF increases the absorption and therefore sets a lower limit on the extinction. In view of this, it is not entirely clear to us why the extinction is significantly lower in the experiments than in the simulations. However, a qualitative agreement is observed, whereby the PLE is intensified where the response to the plane wave is minimized. Finally, Fig. 3(e) shows the spectra at mrad/nm, where two distinct resonances are observed in both the FF and the NF. By comparing Figs. 3(d) and 3(e) it can be recognized that the single NF peak in Fig. 3(d) corresponds to a point of degeneracy. The (+1,0) SLR is red-shifted and the (-1,0) SLR is blue-shifted with respect to the FF such that their energies are equal in the NF. The origin of this degeneracy can be traced to the degeneracy of the () Rayleigh anomalies at normal incidence, which is linearly lifted as increases.
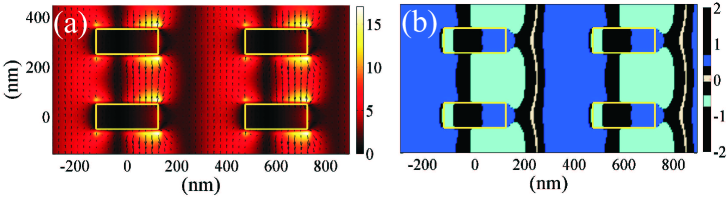
The suppressed FF scattering and simultaneous intense NF can be understood by considering the electric field amplitude and phase response of the array. This is shown in Fig. 4 for the energy of the dip in extinction in Fig. 3(d). Figure 4(a) shows in color scale the total electric field enhancement, i.e., . The scattered field is represented by the arrows. The 4 hot-spots near the corners of the antennas and the resultant field pattern indicate that the excited mode has a quadrupolar character, i.e., it is dipole forbidden. However, the enhancement on the right side of each antenna is larger than on the left side. This results in a non-vanishing dipole moment, allowing the excitation of this mode and the finite extinction observed in Fig. 3(d). Figure 4(b) shows the differences in phase between the scattered and incident fields, i.e., . Two values, which are () (light blue) and () (dark blue), are predominant throughout space. Their difference, , is very close the out of phase condition. Therefore, we observe in Fig. 4(b) that inside the antennas has a difference of with respect to in the dielectric surroundings, resulting in a collective suppression of the FF scattering by destructive interference. Furthermore, this spatial distribution of the phase corresponds to the formation of a standing wave, arising from the interaction of two counter-propagating surface polaritons in the plasmonic crystal. This can be observed in the movies of the total electric field provided in the supplemental information sup (b), where two counter-propagating surface polaritons are observed at the high and low energy extinction peaks, and a quadrupolar standing wave is observed at the extinction dip, all referring to the spectrum in Fig. 3(d). These results elucidate the nature of a minimum scattering antenna array with an enhanced local field, which can be seen by the QDs emission without being seen in the FF.
In conclusion, we have demonstrated that differences in the far-field and near-field spectra of radiation of optical antenna arrays can be exploited to create a medium with large local field enhancements but minimized extinction. This local field enhancement allowed us to observe an extremely narrow bandwidth emission enhancement of quantum dots in the vicinity of the array with a simultaneous minimum in extinction. Dark plasmonic resonances hold remarkable features for modified light emission and sensing, both of which depend on the local field rather than on the global symmetry of the array determining the FF extinction. Our results demonstrate that dipole inactive or dark modes are capable of enhancing the performance of photonic devices to a level comparable, or even superior, to bright modes.
This work was supported by the Netherlands Foundation Fundamenteel Onderzoek der Materie (FOM) and the Nederlandse Organisatie voor Wetenschappelijk Onderzoek (NWO), and is part of an industrial partnership program between Philips and FOM. O. T. A. J. acknowledges support from the Dutch Technology Foundation STW, which is the applied science division of NWO, and the Technology Programme of the Ministry of Economic Affairs (project number 10301). A. O. acknowledges the Institute for the Promotion of Innovation through Science and Technology in Flanders (IWT-Vlaanderen). Z. H. acknowledges BelSPo (IAP 6.10, photonics@be) and the FWO-Vlaanderen (project nr. G.0794.10) for research funding.
References
- Shchegrov et al. (2000) A. V. Shchegrov, K. Joulain, R. Carminati, and J.-J. Greffet, Phys. Rev. Lett. 85, 1548 (2000).
- Bryant et al. (2008) G. W. Bryant, F. J. Garcia de Abajo, and J. Aizpurua, Nano Lett. 8, 631 (2008).
- Ross and Lee (2009) B. M. Ross and L. P. Lee, Opt. Lett. 34, 896 (2009).
- Novotny and van Hulst (2011) L. Novotny and N. van Hulst, Nat. Phot. 5, 83 (2011).
- Stockman et al. (2001) M. I. Stockman, S. V. Faleev, and D. J. Bergman, Phys. Rev. Lett. 87, 167401 (2001).
- Hentschel et al. (2010) M. Hentschel, M. Saliba, R. Vogelgesang, H. Giessen, A. P. Alivisatos, and N. Liu, Nano Lett. 10, 2721 (2010).
- Stockman (2010) M. I. Stockman, Nature 467, 541 (2010).
- Bergman and Stockman (2003) D. J. Bergman and M. I. Stockman, Phys. Rev. Lett. 90, 027402 (2003).
- Li et al. (2005) K. Li, X. Li, M. I. Stockman, and D. J. Bergman, Phys. Rev. B 71, 115409 (2005).
- Liu et al. (2009a) M. Liu, T.-W. Lee, S. K. Gray, P. Guyot-Sionnest, and M. Pelton, Phys. Rev. Lett. 102, 107401 (2009a).
- Zhang et al. (2008) S. Zhang, D. A. Genov, Y. Wang, M. Liu, and X. Zhang, Phys. Rev. Lett. 101, 047401 (2008).
- Yannopapas et al. (2009) V. Yannopapas, E. Paspalakis, and N. V. Vitanov, Phys. Rev. B 80, 035104 (2009).
- Liu et al. (2009b) N. Liu, L. Langguth, T. Weiss, J. Kästel, M. Fleischhauer, T. Pfau, and H. Giessen, Nat. Mat. 8, 758 (2009b).
- Kekatpure et al. (2010) R. D. Kekatpure, E. S. Barnard, W. Cai, and M. L. Brongersma, Phys. Rev. Lett. 104, 243902 (2010).
- Alù and Engheta (2009) A. Alù and N. Engheta, Phys. Rev. Lett. 102, 233901 (2009).
- Alù and Engheta (2010) A. Alù and N. Engheta, Metamaterials 4, 153 (2010).
- de Abajo (2009) F. J. G. de Abajo, Physics 2, 47 (2009).
- sup (a) See Supplemental Materials at (link) for synthesis and optical details of colloidal PbS/CdS core/shell quantum dots.
- Zou and Schatz (2004) S. Zou and G. C. Schatz, J. Chem. Phys. 121, 12606 (2004).
- Kravets et al. (2008) V. G. Kravets, F. Schedin, and A. N. Grigorenko, Phys. Rev. Lett. 101, 087403 (2008).
- Auguié and Barnes (2008) B. Auguié and W. L. Barnes, Phys. Rev. Lett. 101, 143902 (2008).
- Chu et al. (2008) Y. Chu, E. Schonbrun, T. Yang, and K. B. Crozier, Appl. Phys. Lett. 93, 181108 (2008).
- Vecchi et al. (2009a) G. Vecchi, V. Giannini, and J. Gómez Rivas, Phys. Rev. Lett. 102, 146807 (2009a).
- Vecchi et al. (2009b) G. Vecchi, V. Giannini, and J. Gómez Rivas, Phys. Rev. B 80, 201401 (2009b).
- Giannini et al. (2010) V. Giannini, G. Vecchi, and J. Gómez Rivas, Phys. Rev. Lett. 105, 266801 (2010).
- Rodriguez et al. (2011) S. R. K. Rodriguez, A. Abass, B. Maes, O. T. A. Janssen, G. Vecchi, and J. Gómez Rivas, Phys. Rev. X 1, 021019 (2011).
- Ropers et al. (2005) C. Ropers, D. J. Park, G. Stibenz, G. Steinmeyer, J. Kim, D. S. Kim, and C. Lienau, Phys. Rev. Lett. 94, 113901 (2005).
- Palik (1985) E. Palik, Handbook of optical constants of solids (Academic Press, New York, 1985).
- sup (b) See Supplemental Materials at (link) for movies of the total electric field in the plane of the antennas at the high and low energy extinction peaks, and at the near-field resonance / far-field anti-resonance.