Late-Time Optical Emission From Core-Collapse Supernovae
Abstract
Ground-based optical spectra and Hubble Space Telescope images of ten core-collapse supernovae (CCSNe) obtained several years to decades after outburst are analyzed with the aim of understanding the general properties of their late-time emissions. New observations of SN 1957D, 1970G, 1980K, and 1993J are included as part of the study. Blueshifted line emissions in oxygen and/or hydrogen with conspicuous line substructure are a common and long-lasting phenomenon in the late-time spectra. Followed through multiple epochs, changes in the relative strengths and velocity widths of the emission lines are consistent with expectations for emissions produced by interaction between SN ejecta and the progenitor star’s circumstellar material. The most distinct trend is an increase in the strength of [O III]/([O I]+[O II]) with age, and a decline in H/([O I]+[O II]) which is broadly consistent with the view that the reverse shock has passed through the H envelope of the ejecta in many of these objects. We also present a spatially integrated spectrum of the young Galactic supernova remnant Cassiopeia A (Cas A). Similarities observed between the emission line profiles of the 330 yr old Cas A remnant and decades old CCSNe suggest that observed emission line asymmetry in evolved CCSN spectra may be associated with dust in the ejecta, and that minor peak substructure typically interpreted as ‘clumps’ or ‘blobs’ of ejecta may instead be linked with large-scale rings of SN debris.
Subject headings:
supernovae: general — supernova: individual (SN 1957D, SN 1970G, SN 1980K, SN 1993J) — supernova remnants — ISM: individual objects (Cassiopeia A)1. Introduction
Optical spectra of core-collapse supernovae (CCSNe) beyond a couple years after maximum light are difficult to obtain due to their increasing faintness with time and thus are relatively rare. Given that the majority of CCSNe occur at distances Mpc and fade at least eight magnitudes below peak brightness within their first two years (Kirshner, 1990), observations have been largely limited to the first 700 days or so after maximum light when they are at apparent magnitudes 20.
However, in a handful of cases it has been possible to monitor CCSNe several years or even decades post-outburst. This may be because of a fortuitously nearby distance, such as SN 1987A in the Large Magellanic Cloud (D 50 kpc; Kunkel et al. 1987; Feast 1999; van Leeuwen et al. 2007), or exceptional circumstances wherein some late-time energy source maintains optical luminosity at observable levels. This latter scenario was first recognized in the late 1980s with the optical re-detections of SN 1980K (Fesen & Becker, 1988) and SN 1957D (Long et al., 1989; Turatto et al., 1989).
Of the various late-time mechanisms theorized to power CCSN emission at epochs 2 yr, the most common and best understood process is the forward shock front and SN ejecta interaction with surrounding circumstellar material (CSM) shed from the progenitor star (see Chevalier & Fransson 2003, 2006 and references therein). SN–CSM interaction emits across a wide spectral band spanning radio to X-ray. Optical emissions largely originate from a reverse shock that propagates upstream into outward expanding ejecta that gets heated and ionized (Chevalier & Fransson, 1994). The most dominant emission lines are [O I] 6300, 6364, [O II] 7319, 7330, [O III] 4959, 5007, and H with broad linewidths km s-1. Other proposed late-time mechanisms include pulsar/magnetar interaction with expanding SN gas (Chevalier & Fransson, 1992; Kasen & Bildsten, 2010; Woosley, 2010) or accretion onto a black-hole remnant (Patnaude et al., 2011).
| Inst. | Filter | Descriptive | Date | Exp Time | Program No./PI | ||
|---|---|---|---|---|---|---|---|
| (Å) | (Å) | Notes | (UT) | (s) | |||
| SN 1957D | |||||||
| WFC3 | F336W | 3375 | 550 | Johnson | 17 Mar 2010 | 2560 | 11360/R. O’Connell |
| F438W | 4320 | 695 | Johnson | 17 Mar 2010 | 1800 | ||
| F502N | 5013 | 47 | [O III] | 19 Mar 2010 | 2484 | ||
| F547M | 5475 | 710 | Continuum | 20 Mar 2010 | 1203 | ||
| F657N | 6573 | 94 | H + [N II] | 19 Mar 2010 | 1484 | ||
| F673N | 6731 | 77 | [S II] | 17 Mar 2010 | 1770 | ||
| SN 1970G | |||||||
| WFPC2 | F606W | 5997 | 1502 | Wide- | 21 Apr 1998 | 600 | 6713/W. Sparks |
| F656N | 6564 | 22 | H | 21 Apr 1998 | 1600 | ||
| SN 1980K | |||||||
| WFPC2 | F606W | 5997 | 1502 | Wide- | 19 Jan 2008 | 1600 | 11229/M. Meixner |
| F814W | 7940 | 1531 | Johnson | 19 Jan 2008 | 1600 | ||
Studies of late-time optical emissions can yield kinematic and chemical information about the SN ejecta and probe the mass-loss history and evolutionary status of the progenitor stars (Leibundgut et al., 1991; Fesen et al., 1999). The evolution of line widths and differences between the relative line strengths can distinguish between late-time mechanisms and be important diagnostics of the ejecta structure.
Here we present optical images and spectra of ten CCSNe observed during the relatively unexplored late-time transition phase between SN outburst and SN remnant formation. In Sections 2 and 3 we present and briefly discuss high-resolution images and new low-resolution optical spectra of SN 1957D, SN 1970G, SN 1980K, and SN 1993J along with archival late-time spectra of six other CCSNe. Common properties observed in these data are reviewed in Section 4 and then interpreted in the context of a SN–CSM interaction model in Section 5. Further investigation of these spectra follow from comparing them to a spatially integrated spectrum of the young Galactic supernova remnant (SNR) Cassiopeia A in Section 6, and a summary of our findings is given in Section 7.
2. Observations
2.1. Images
High-resolution images obtained with the Hubble Space Telescope (HST) covering the sites of SN 1957D, 1970G, and 1980K were retrieved from the Multimission Archive at Space Telescope (MAST) and Hubble Legacy Archive (HLA) maintained by the Space Telescope Science Institute (STScI) to examine the supernovae and their local environments. Table 1 lists the instruments, filter passbands with notes about their emission line sensitivies, dates, exposure times and program details of the observations. All images retrieved from MAST were manually co-added and cleaned of cosmic rays using the crrej and multidrizzle tasks in IRAF/PyRAF111IRAF is distributed by the National Optical Astronomy Observatories, which are operated by the Association of Universities for Research in Astronomy, Inc., under cooperative agreement with the National Science Foundation. PyRAF is a product of the Space Telescope Science Institute, which is operated by AURA for NASA., whereas those retrieved from the HLA were automatically drizzled by the archive through pipelined software.
2.2. Spectra
Late-time, low-dispersion optical spectra of four CCSNe were obtained using a variety of telescopes and instrumental setups. Below we describe the details of these observations.
Spectra of SN 1957D were obtained on 2001 July 27 with the FOcal Reducer/low dispersion Spectrograph 1 (FORS1) at ESO/VLT at Paranal, Chile. The CCD detector has a scale of 02 pixel-1, and the GRIS300V grism with a GG435 filter was used with a 1′′ slit to produce spectra ranging from Å with full-width-at-half-maximum (FWHM) resolution of approximately 10 Å. Total exposure time was 1800 s obtained at an airmass of 1.7. An atmospheric dispersion corrector minimized potential effects of atmospheric refraction.
Observations of SN 1970G were obtained on 2010 March 12 with the 2.4 m Hiltner telescope at MDM Observatory on Kitt Peak, Arizona. A Boller & Chivens CCD spectrograph (CCDS) was used with a north-south 1.5 5 slit, a 150 lines mm-1 4700 Å blaze grating, and a LG400 filter to block contaminating second-order light. Exposures totaling s obtained at culmination at airmasses 1.1 were combined. Resulting spectra spanned Å with resolution of 11 Å. Conditions were mostly photometric with the seeing around 12.
The 2.4 m Hiltner telescope at MDM was also used to obtain spectra of SN 1980K on 2010 October 9. The Mark III Spectrograph with a SITe 1024 1024 CCD detector was used. A 12 45 slit and a 300 lines mm-1 5400 Å blaze grism were employed. A total of 2 3000 s exposures were obtained at culmination around an airmass of 1.1 with a spectral resolution of 7 Å. Conditions were photometric with sub-arcsecond seeing.
Spectra of SN 1993J were obtained on 2009 December 9 with the 6.5 m MMT at Mt. Hopkins in Arizona using the HECTOSPEC optical fiber fed spectrograph. These observations were part of a survey of supernova remnants of M81. Spectra from the 15 diameter fibers cover the wavelength range of Å with FWHM resolution of 5 Å. Observations were obtained at an airmass of 1.3 with an atmospheric dispersion corrector in place and the total exposure time was 3600 s.
These spectra were reduced and calibrated employing standard techniques in IRAF and our own IDL routines (see Matheson et al. 2008). Cosmic rays and obvious cosmetic defects have been removed from all spectra. Wavelengths were checked against night sky emission lines. Flux calibrations were from observations of Stone (1977) and Massey & Gronwall (1990) standard stars.
3. Late-Time CCSN Spectra & Images
3.1. SN 1957D
SN 1957D in M83 (D 4.6 Mpc; Saha et al. 2006) was discovered by H. Gates on 1957 December 28 when the SN was well past maximum light in a spiral arm about NNE of the galaxy nucleus (Gates & Carpenter, 1958). The SN was followed photometrically on 1958 January 16, 30 and February 14 when its photographic magnitude was . No spectrum was obtained during this early period.
Approximately 25 yr after outburst, the SN was recovered as a radio source (Cowan & Branch, 1982; Pennington & Dufour, 1983). Subsequent observations by Long et al. (1989) and Turatto et al. (1989) showed that its optical spectra were dominated by broad [O III] 4959, 5007 lines. Additional follow-up observations by Long et al. (1992) showed that the optical flux had decreased by at least a factor of five between 1987 and 1991, and Cappellaro et al. (1995) confirmed the rapid decline. Pennington et al. (1982) suggested that the SN was produced by a massive Population I progenitor based on integrated colors in the surrounding region, corroborating suspicion that this was a Type II or Ib/c event (Long et al., 1989).
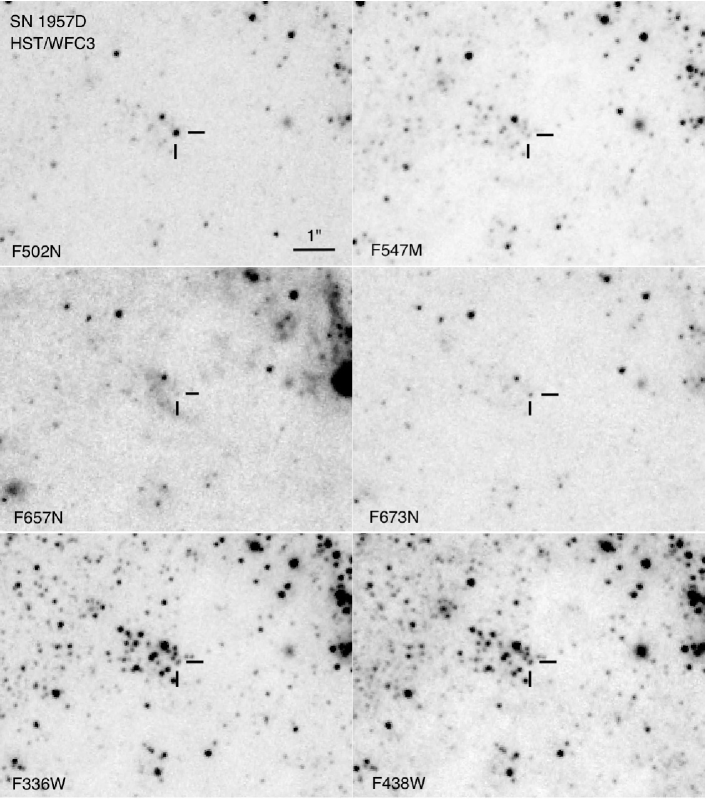
In Figure 1, we show high-resolution HST images of the region around SN 1957D which provide the first clear look at the supernova’s neighboring stellar environment. The O-rich SN is bright and unresolved in the F502N image. We estimate an [O III] 5007 flux of erg s-1 cm-2, which is a decline from April 1991 when it was erg s-1 cm-2 (Long et al., 1992). The SN is marginally detected in the H-sensitive F657N image where we see its location just outside a nearby H II region. The SN is also visible in the [S II]-sensitive F673N image with emission of the order of erg s-1 cm-2. Emission is stronger in the F673N image than in the F657N image, suggesting [S II] 6716, 6731 line emission associated with shocked SN ejecta.
The F336W and F438W images indicate that the remnant is projected along the outskirts of a cluster of blue stars with dimensions of approximately 1 15, or 25 35 (d/4.6 Mpc) pc. Emission in these filter images, bright in the and passbands, is seen at the location of the SN, likely associated with nearby massive stars. The stellar environment of SN 1957D resembles the luminous SN remnant in NGC 4449 as observed with HST (SNR 4449-1; Milisavljevic & Fesen 2008). This is another O-rich, young remnant with an age of yr estimated from the ratio of anugular size to expansion velocity (Bietenholz et al., 2010).
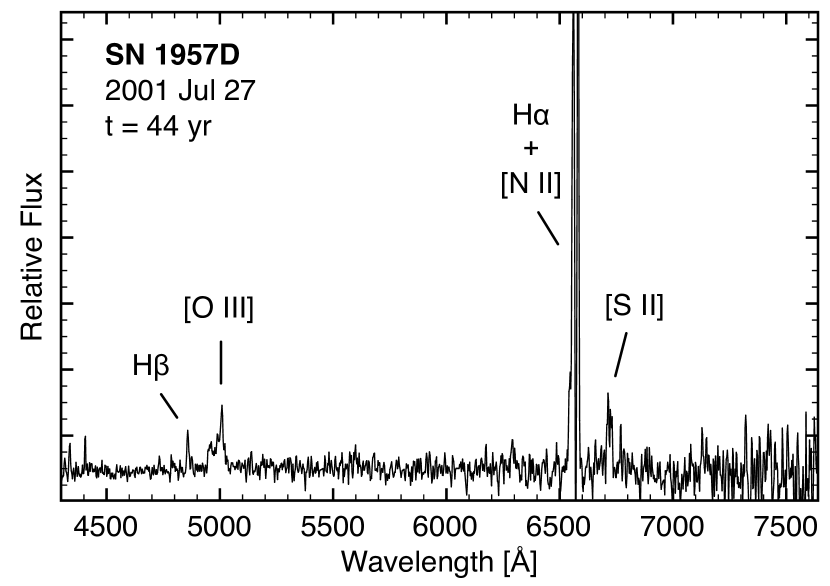
In Figure 2, we present a 2001 optical spectrum of SN 1957D, some 44 yr after outburst. Wavelengths have been corrected for the host galaxy’s redshift of 513 km s-1 and a blue continuum associated with background starlight has been subtracted using a third order Chebyshev function. Narrow H, H, [N II] 6548, 6583, and [S II] 6716, 6731 line emissions are associated with the nearby H II region, and the sharp cut in the H profile is due to poor subtraction of this emission. The dominant emission lines observed from the SN ejecta are broad [O III] 4959, 5007.


The half-width-at-zero intensity (HWZI) of the [O III] emission is approximately 1000 km s-1, confirmed by measuring both from 5007 Å to the red and 4959 Å toward the blue. The measured [O III] 4959, 5007 flux is erg s-1 cm-2, which is consistent with the decline between the Long et al. (1992) and the 2010 HST WFC3 F502N image measurements. In Figure 3, we plot the handful of published [O III] fluxes. A clear decrease in flux is seen between previously reported values from Long et al. (1992) and Cappellaro et al. (1995) and the 2001 and 2010 measurements presented here. The last two measurements give the impression that the decline in flux has slowed or even leveled out.
In Figure 4, we show a comparison of the 2001 July [O III] line profile of SN 1957D to a spectrum obtained in 1989 April (Turatto et al., 1989). Some narrowing of the emission line of order km s-1 may have occurred between the ten years that separates the observations ( 100 km s-1 yr-1) although the signal-to-noise (S/N) ratio prevents a firm conclusion. Our 1989 measurement is in agreement with Long et al. (1992) who reported [O III] emission line velocities in excess of 2000 km s-1 in their optical spectra taken at a similar epoch.

3.2. SN 1970G
SN 1970G in M101 (D 6.7 Mpc; Freedman et al. 2001) was discovered by M. Lovas on 1970 July 30 (Detre & Lovas, 1970) near maximum light ( = 11.5; Winzer 1974; Barbon et al. 1979) along the NW boundary of the galaxy’s large H II complex NGC 5455. Optical spectra showed Type II SN features with broad H emission (Kirshner et al., 1973; Kirshner & Kwan, 1974). It has been generally classified as a Type IIL based on its linearly declining light curve (Barbon et al., 1979; Young & Branch, 1989), but a brief plateau phase between day 30 and 50 and optical spectra exhibiting prominent P-Cygni line absorption features may make it a transitional object between IIP and IIL (Barbon et al., 1979; Turatto et al., 1990; Cappellaro et al., 1991).
SN 1970G was the first supernova to be detected in the radio and remains the longest monitored radio supernova (Stockdale et al., 2001). Radio flux densities were relatively constant for 3 yr before beginning to fade in 1974 (Allen et al., 1976; Brown & Marscher, 1978; Weiler et al., 1986). Radio emission was re-detected in 1991 by Cowan et al. (1991), prompting optical observations by Fesen (1993) who obtained spectra revealing broad H and [O I] 6300, 6364 emissions.
Two optical HST images of the region around SN 1970G obtained in 1998 April are shown in Figure 5. To the south lies the large H II region NGC 5455. The F606W image shows three sources around the radio coordinates =14h03m0088 =5414331 (Stockdale et al., 2001) centered in the figure. Although a finding chart published in Fesen (1993) suggests the brighter, eastern source as the SN, alignment of these images with a CFHT MegaPipe image of the region (Group G002.308.620+60.034) having astrometric accuracy favors the western source, and is the object marked in Figure 5. The observed F606W/F656N flux ratio of this object is in agreement with the spectrum of the SN which shows broad H emission.

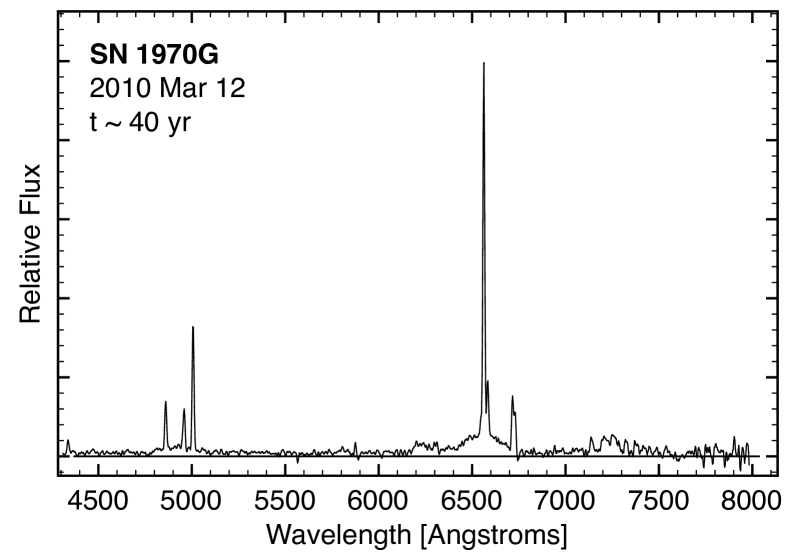
In the top panel of Figure 6, we show a 2010 optical spectrum of SN 1970G some 40 years after outburst. Wavelengths have been corrected for the host galaxy’s redshift of 251 km s-1 and an underlying blue continuum believed to be associated with background starlight has been subtracted with a third order Chebysev function. The spectrum is dominated by narrow H II region lines of [O III], H, H, [N II] 6548, 6583, and [S II] 6716, 6731. Noise around 7300 Å is due to poor night sky OH subtraction.
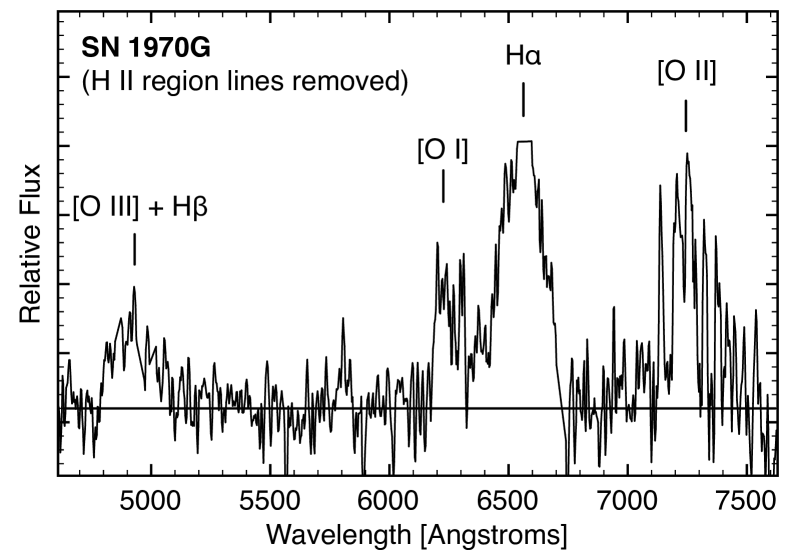
An enlarged portion of the spectrum with the H II region lines manually removed is shown in the lower panel of Figure 6 in order to better see the faint underlying emission originating from the supernova. H is the strongest emission line and exhibits a mildly asymmetric profile shifted blueward. There is no clear change from the profile described in Fesen (1993).
The estimated H flux (minus background and narrow H II region emission) is erg s-1 cm-2, relatively unchanged from 1.8 10-15 erg s-1 cm-2 measured 18 years earlier (Fesen, 1993). The width of H is estimated to span 6410 Å to 6690 Å ( to km s-1) with uncertainty perhaps greater than km s-1 due to confusion with the broad [O I] 6300, 6364 and narrow [S II] 6716, 6731 lines. The velocity width measured from data obtained in 1992 was reported to extend from km s-1 to km s-1, but this change is likely the result of improvement in S/N.
Broad emission spanning 4780 to 5090 Å showing a strongly blueshifted, gradually descending profile is detected. We associate the emission primarily with [O III], but given the large implied blueshifted velocity ( km s-1) with respect to the 4959 Å line, contribution from H is likely.
[O I] emission shows the same gradually descending profile as [O III]. We measure a velocity extension from 6175 Å ( km s-1 with respect to 6300 Å) to 6410 Å ( km s-1 with respect to 6364 Å) where it merges with the broad H. Broad emission centered around 7240 Å could be associated with the [Ca II] 7291, 7324 and/or [O II] 7319, 7330 lines (Fesen, 1993). Because [O II] is known to be a dominant line in intermediate-aged supernovae (see discussion in Fesen et al. 1999) and the velocity line profile best matches the [O I] distribution when centered with respect to 7325 Å, we identify [O II] as the major contributor.
Faint emission centered around 5810 Å having a full-width-at-zero-intensity less than 100 Å is also weakly detected. It was not detected in the Fesen (1993) spectrum and may be associated with blueshifted He I and/or Na I emission.

3.3. SN 1980K
SN 1980K in NGC 6946 (D 5.9 Mpc; Karachentsev et al. 2000) was discovered by P. Wild on 1980 October 28 and reached a peak brightness of = 11.4 in 1980 November (Buta, 1982). Photographic observations showing an almost linear decline in brightness and spectra revealing broad H with minor P Cygni absorption classify it as a Type IIL (Barbon et al., 1982). Radio and X-ray emissions were detected about a month after maximum (Canizares et al., 1982; Weiler et al., 1986). Radio emissions were followed quite extensively through 1996 (Weiler et al., 1992; Montes et al., 1998), and more limited X-ray observations have been obtained through 2004 (Schlegel, 1994; Soria & Perna, 2008).
The SN declined steadily in the optical through 1982 (Uomoto & Kirshner, 1986) but was detected in 1987 nearly seven years after maximum through narrow passband imaging (Fesen & Becker, 1988). Follow-up low-dispersion optical spectra showed broad H and [O I] emission along with weaker line emission from [O III], [Fe II] 7155, and emission around 7300 Å identified as [Ca II] 7291, 7324 and/or [O II] 7319, 7330 (Fesen & Becker, 1990; Uomoto, 1991; Leibundgut et al., 1991). Further monitoring through 1997 indicated no major changes in the spectrum aside from steadily declining H emission (Leibundgut et al., 1993; Fesen & Matonick, 1994; Fesen et al., 1999).
High resolution HST images obtained in 2010 March (Fig. 7) show the environment of SN 1980K in detail never before seen. Two unresolved sources around the published coordinates of the supernova (2000) = 20h35m3007 (2000) = +6006238 (van Dyk et al., 1996) are seen. We compared the images to an unpublished ground-based H image ( = 6564 Å; = 30 Å) of the region obtained by R. Fesen on 1997 May 08 using the Hiltner 2.4 m telescope at MDM Observatory (also shown in Fig. 7) to confirm that the supernova was the brighter, more westerly source. The other source, approximately 055 away or 15 (d/5.9 Mpc) pc, has a rather steep color difference between the F606W and F814W images suggestive of a luminous blue star or very tight stellar association.
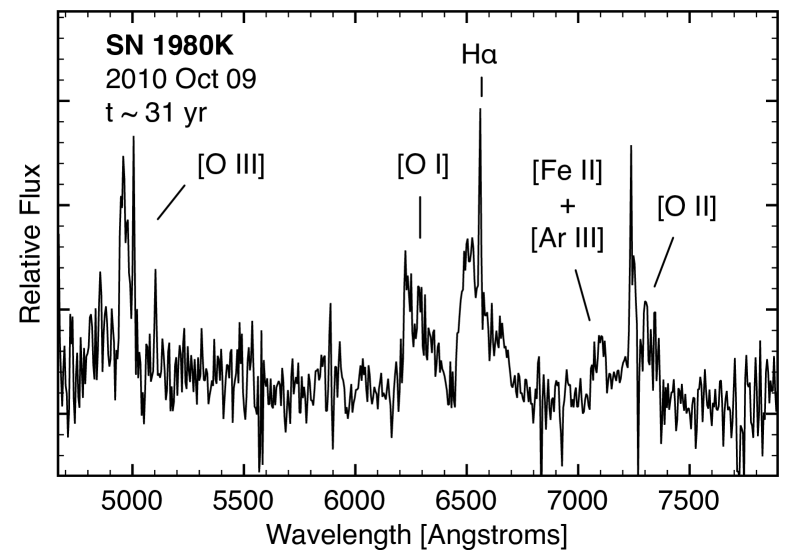
The top panel of Figure 8 shows our recent 2010 spectrum of SN 1980K with identified emission lines marked. The small recession velocity of 40 km s-1 of NGC 6946 has been corrected. A weak blue continuum that trails off around around 5500 Å may be due to light contamination from the projected companion seen slightly east of the SN in the HST/WFC3 images (Fig. 7).
The H and [O I] lines exhibit broad, asymmetric emission profiles strongly blueshifted with an emission peak around km s-1. Emission around 7300 Å associated with [O II] (Fesen et al., 1999) is weakly detected. Asymmetric emission spanning 4935 to 5010 Å is identified as strongly blueshifted [O III]. A narrow unresolved emission peak around 6558 Å, seen in earlier spectra, is potentially due to a small H II region near the SN site or ionized wind material associated with the progenitor (Fesen & Becker, 1990; Fesen et al., 1995). Another peak around 5003 Å is also observed; if associated with [O III] 5007, this is at the same km s-1 blueshifted velocity of the narrow H line. Emission around 7090 Å is likely associated with [Fe II] 7155 blueshifted km s-1, but some contribution from [Ar III] 7136 is possible.
The bottom of Figure 8 compares our 2010 spectrum of SN 1980K with Keck spectra obtained in 1995 (Fesen et al., 1999). [O I] and H show minor changes to their line profiles and overall reduction in emission strength, while the flux ratio of [O III]/H has increased. The overall [O II] flux has decreased, but the true extent of diminishment is difficult to gauge firmly because of low S/N and poor night sky subtraction.
The H line profile has a velocity width of to km s-1. The blueshifted emission width is narrower than the 1995 measurement of km s-1, and the redshifted width is slightly larger than the previous estimate of km s-1. The blueshifted velocity change does not follow the estimated rate of km s-1 yr-1 first noted by Fesen & Matonick (1994) and later confirmed by Fesen et al. (1995). [O I] has a velocity of km s-1, which is considerably smaller than the km s-1 reported in spectra from 1995. The substantial velocity change is likely associated with improved S/N.
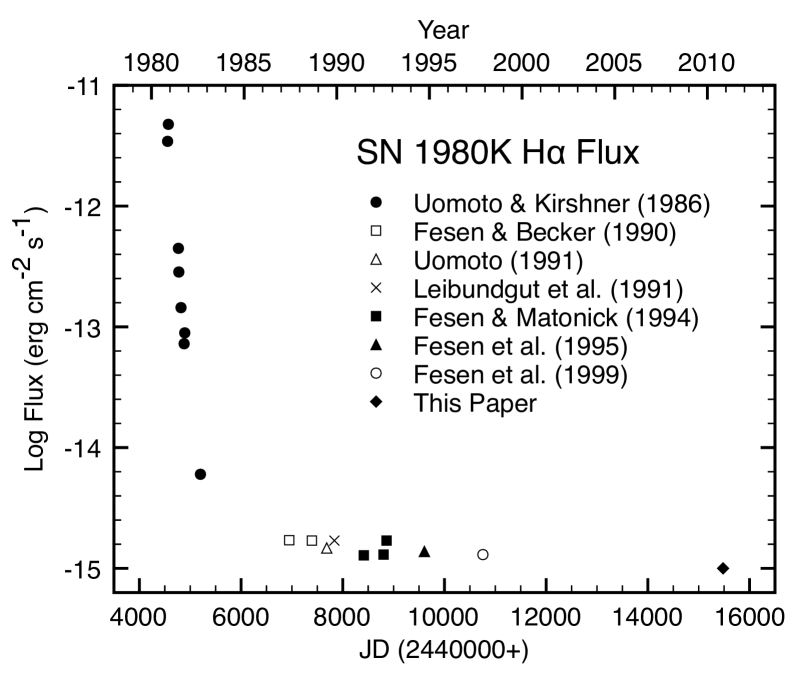
We estimate a broad H flux of erg s-1 cm-2, which is a small drop from erg s-1 cm-2 reported by Fesen et al. (1999) 15 yr earlier. In Figure 9, a plot of all published H flux measurements shows an almost flat emission trend over the past two decades. Persistent H emission with little to no decline over several years is consistent the other SN Type IIL already discussed, SN 1970G, and with the handful of additional Type IIL SNe observed years post-outburst including SN 1979C (Fesen & Becker, 1990; Fesen & Matonick, 1994; Fesen et al., 1995) and SN 1986E, whose brightness in at eight years of age was almost the same it was two years after outburst (Cappellaro et al., 1995). The origin of this emission has long been attributed to reverse shock-heated hydrogen-rich ejecta (e.g., Fesen et al. 1999; Milisavljevic et al. 2009; see Section 5) although Sugerman et al. (2012) suggest SN 1980K’s H emission may have substantial contribution from scattered light echoes.
3.4. SN 1993J
SN 1993J in M81 (D 3.6 Mpc; Freedman et al. 1994) was discovered by F. Garcia on 1993 March 28.9 (Ripero et al., 1993) and reached a maximum brightness of = 10.8 mag (Richmond et al., 1994). Early spectra showed an almost featureless blue continuum with indications of broad but weak H and He I 5876 suggesting a Type II event (Filippenko et al., 1993a; Garnavich & Ann, 1993). However, the spectra quickly evolved to show He I lines associated with the Type Ib class (Filippenko et al., 1993b), thus acquiring the transitional classification Type IIb (Filippenko et al., 1993c) anticipated by Woosley et al. (1987).

The relatively isolated location and nearby distance of SN 1993J has enabled close monitoring of emission in the X-ray (Zimmermann et al., 1994; Suzuki & Nomoto, 1995; Chandra et al., 2009) radio (Bartel et al., 1994; van Dyk et al., 1994; Bartel et al., 2000; Weiler et al., 2007), and optical (Woosley et al., 1994; Filippenko et al., 1994; Matheson et al., 2000a, b; Filippenko & Matheson, 2003; Fransson et al., 2005). Recently, photometric and spectroscopic observations a decade post-outburst detected the signature of a potential massive binary companion to the progenitor star (Maund et al., 2004; Maund & Smartt, 2009).
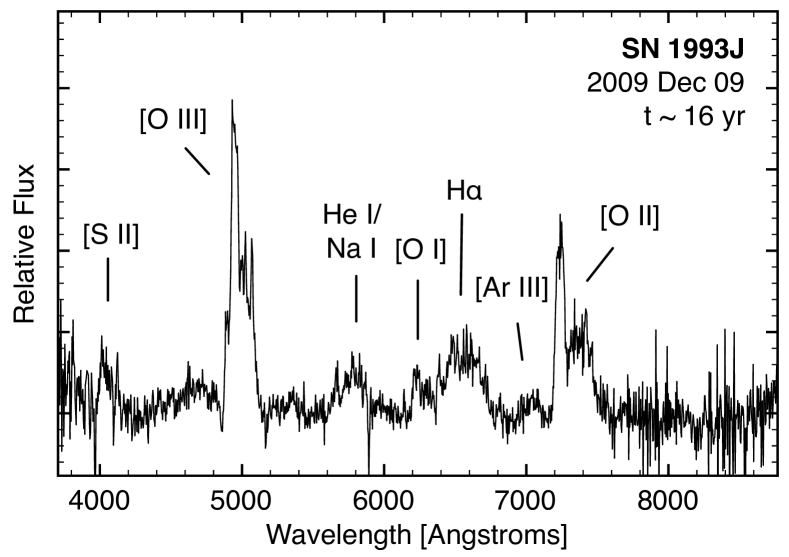
In the top panel of Figure 10, we present a 2009 December spectrum of SN 1993J. Identified emission lines have been marked, wavelengths have been corrected for a recession velocity of km s-1 (Matheson et al., 2000b), and a blue continuum has been removed using a third order Chebyshev function. In the lower panel of the figure, our 2009 spectrum is plotted over and directly contrasted with one obtained approximately 10 yr earlier by Matheson et al. (2000a, b) and a previously unpublished MMT spectrum obtained on 2001 May 24 kindly provided by T. Matheson and M. Modjaz. All spectra have been normalized to the [O II] emission lines to highlight the gradual increase in [O III] emission with respect to H.
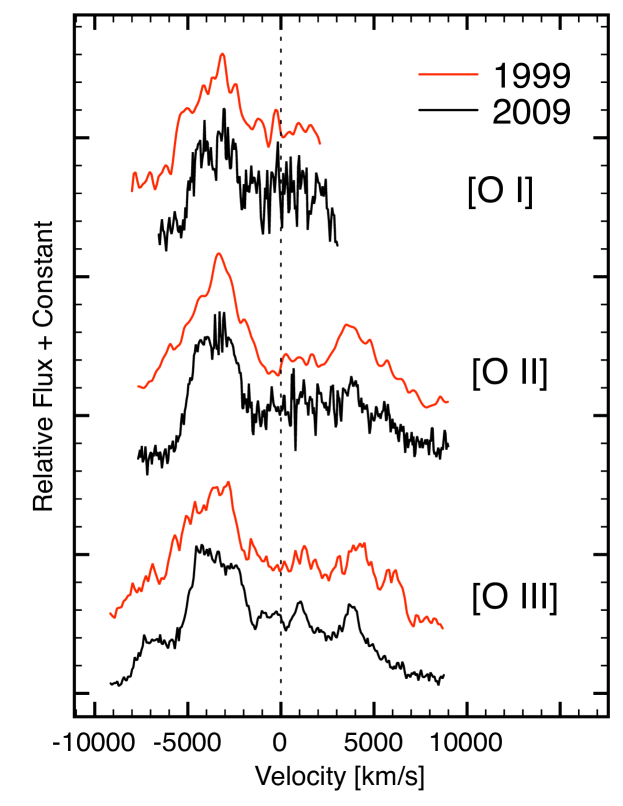
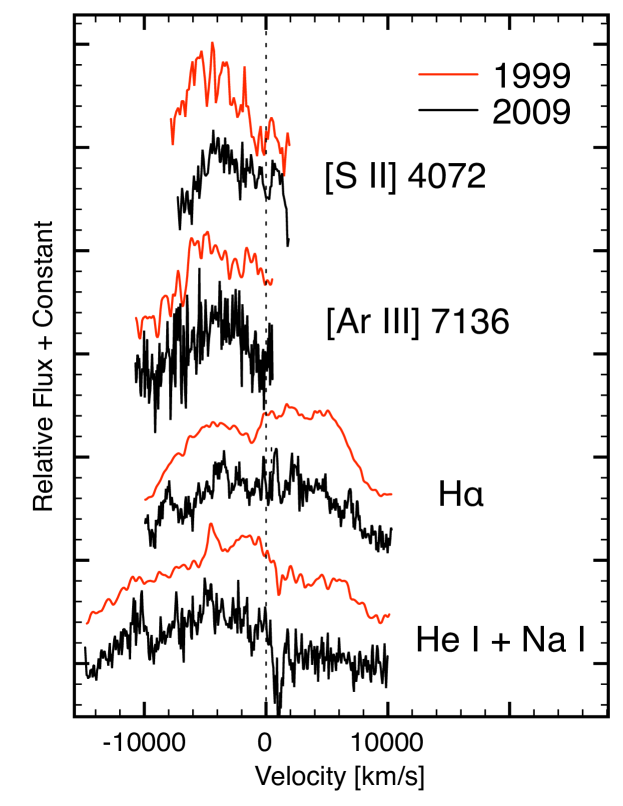
The general line profile shapes and small-scale features of the strongest emission lines have not changed significantly (see Fig. 11). However, the ratio of [O III]/H emission has increased by over an order of magnitude, continuing a trend first noted by Matheson et al. (2000a). Previous spectra showed a persistent H line that, up until day 2452 after outburst, dominated the spectrum with an unusual, box-like profile with velocities in excess of km s-1. However, [O III] is now the dominant emission feature. The profile maintains its pronounced asymmetry toward blueshifted velocities with a major emission peak centered around km s-1. We estimate a total [O III] 4959, 5007 flux of erg s-1 cm-2, implying a decline from the erg s-1 cm-2 measured in 1999. The velocity span of to km s-1 has remained unchanged.
The [O II] 7319, 7330 lines follow the same profile distribution as [O III], as does [O I] with the exception that at around 6365 Å it begins to merge with H (see Fig. 11). The [S II] 4069, 4076 lines have become more pronounced, exhibiting a blueshifted profile sharply peaked at km s-1 and gradually sloping down to zero velocity. The blend of He I and Na I lines centered around 5800 Å remains largely unchanged, though evidence for an emission peak centered around 5670 Å has developed.
Emission around 7050 Å has several possible sources of origin including He I 7065, [Fe II] 7155, and [Ar III] 7136. Matheson et al. (2000a) attribute the feature to [Fe II] 7155. However, we found that centering the velocity distribution with respect to 7136 Å provided a good fit with the [S II] profile (see Fig. 11). Thus, assuming a common origin for Ar and S from the Si-S-Ar-Ca interior layer of the progenitor star, [Ar III] 7136 is likely the dominant contributor.
3.5. Additional Late-Time CCSN Spectra
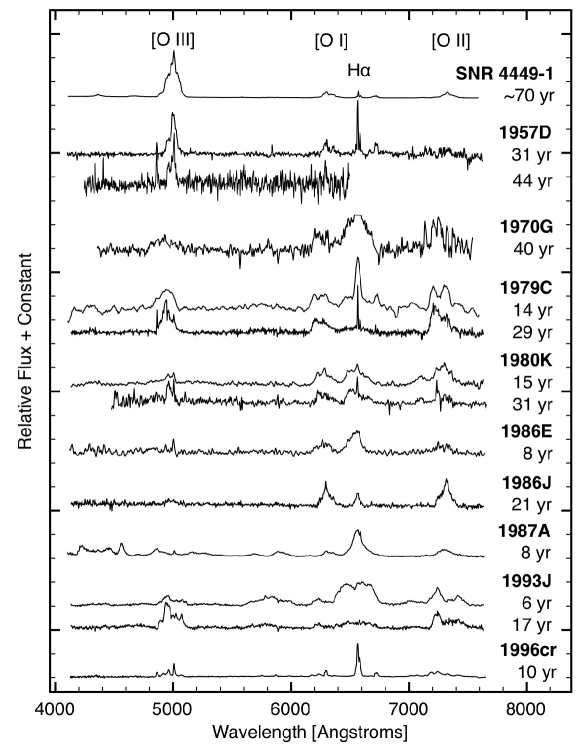
To help place the spectra of SN 1957D, 1970G, 1980K, and 1993J in context with other CCSNe observed at similarly evolved epochs, we retrieved archival late-time spectra for several CCSNe where broad (HWZI 2000 km s-1) line emission associated with metal-rich ejecta was observed at epochs 10 yr. These objects include SN 1979C and SN 1986E (SN IIL), SN 1986J and SN 1996cr (SN IIn), and SN 1987A (SN IIpec).
Also included was the ultraluminous, O-rich supernova remnant in NGC 4449, SNR 4449-1. SNR 4449-1 has no known classification, but properties of its late-time spectra and stellar environment are in line with a stripped-envelope progenitor (Seaquist & Bignell, 1978; Kirshner & Blair, 1980; Blair et al., 1983, 1984; Milisavljevic & Fesen, 2008). Recent work has suggested an age of 70 yr, which is comparable to the CCSNe studied here (Bietenholz et al., 2010). Spectra of all ten SNe are shown in Figure 12 with their properties and references listed in Table 2.
Not included in our sample were some Type IIn CCSNe where strong Balmer emission associated with hydrogen-rich CSM dominates their spectra; e.g., SN 1978K (Ryder et al., 1993; Schlegel et al., 1999), and SN 1988Z (Aretxaga et al., 1999). Also not included was the unique event SN 1961V (Stringfellow et al., 1988) in light of its debated nature and limited optical spectra (Goodrich et al., 1989; Filippenko et al., 1995; Chu et al., 2004; Kochanek et al., 2011).
| SN | Type | Host Galaxy | Distance (Mpc)aaReferences to distance estimates provided in Sections 1 and 3 unless marked with an asterisk (*) in which case they are mean distances reported by Nasa/IPAC Extragalactic Database at http://ned.ipac.caltech.edu. | References |
|---|---|---|---|---|
| SNR 4449-1 | NGC 4449 | 3.6* | Bietenholz et al. (2010) | |
| 1957D | II | M83 | 4.6 | Cappellaro et al. (1995); This paper |
| 1970G | IIL | M101 | 6.7 | This paper |
| 1979C | IIL | M100 | 15.8 | Fesen et al. (1999); Milisavljevic et al. (2009) |
| 1980K | IIL | NGC 6946 | 5.9 | Fesen et al. (1999); This paper |
| 1986E | IIL | NGC 4302 | 24.9* | Cappellaro et al. (1995)bbData retrieved from SUSPECT at http://bruford.nhn.ou.edu/suspect/index1.html. |
| 1986J | IIn | NGC 891 | 10.2* | Milisavljevic et al. (2008); Leibundgut et al. (1991) |
| 1987A | IIpec | LMC | 0.05 | Chugai et al. (1997)ccData retrieved from MAST at http://archive.stsci.edu/. |
| 1993J | IIb | M81 | 3.7 | Matheson et al. (2000a, b); This paper |
| 1996cr | IIn | Circinus | 4.2* | Bauer et al. (2008) |
4. Discussion
As can be seen from Figure 12, there is great variety in the late-time optical spectra of intermediate-aged CCSNe. Nonetheless, there exist some similarities between these objects with respect to changes in emission line strengths and widths over time. For example, the three SN IIL objects SN 1970G, 1979C, and 1980K all show broad H ( 5000 km s-1) with the redshifted emission weaker than the blueshifted emission. These spectra also show comparable evolutionary changes in the strength of [O III] relative to H. On the other hand, quite different late-time emissions are seen for objects such as SN 1986J and 1987A. Below we describe several properties that were found to be common to many of these spectra, and in Sections 5 and 6 we interpret their physical origin in the context of a SN–CSM interaction model and comparison to the young Galactic supernova remnant Cassiopeia A.
4.1. Changes in Relative Line Strength and Width Over Time
In cases where multi-epoch spectra with good S/N are available, the [O III] 4959, 5007 and H lines change in strength relative to the [O I] 6300, 6364 and [O II] 7319, 7330 lines. Namely, the flux ratio [O III]/([O I]+[O II]) increases with time, and in most cases H/([O I]+[O II]) decreases. This is clear in the spectra of three objects: SN 1980K between 1995 and 2010 (see Figure 8), SN 1993J between 1999 and 2009 (see Figure 10), and in previously published spectra of SN 1979C between 1993 and 2008 (Milisavljevic et al., 2009). The fact that emission from the oldest SNe in our sample, SN 1957D and SNR 4449-1, are dominated by [O III] emission with no appreciable H is also consistent with the trend.
However, some SNe remain dominated by H emission over all observed epochs. For instance, SN 1970G is dominated by broad H emission as it has been since first observations by Kirshner et al. (1973). Although we detected [O III] emission at yr, its overall H strength is far stronger than other CCSNe of comparable ages. In the same category, SN 1986E at 8 yr of age continued to be H-dominated with insignificant [O III] emission. The unique objects SN 1986J and SN 1987A also show weak or undetected [O III] emission.
A handful of SN spectra in our sample show measurable changes in the velocity widths of their emission line profiles. SN 1957D exhibited narrowing in its [O III] 4959, 5007 lines of order 100 km s-1 yr-1 (see Fig. 3), a rate similar to changes in the velocity widths of forbidden oxygen emissions in SN 1979C between 1990 and 2008 (Milisavljevic et al., 2009). Narrowing of order 25 km s-1 yr-1 was also noted in SN 1979C’s H emission, but only affecting blueshifted velocities. In some cases no velocity changes were measured, (e.g., SN 1993J), while in other cases changes in velocity width could not be measured confidently owing to poor S/N and differences in detector sensitivity and/or spectral resolution (e.g., SN 1970G).
Changes in velocity widths of emission line profiles are predicted to be good tests between various mechanisms of late-time emission (Chevalier & Fransson, 1992, 1994). In circumstellar interaction scenarios where the reverse shock penetrates into deeper layers of ejecta, the velocity widths of emission lines are anticipated to narrow. Alternatively, scenarios involving a pulsar wind nebula where emission is powered by photoionization, line widths are anticipated to broaden because of acceleration by the pulsar bubble. With one exception, all SN studied here show either no discernible change in their line widths or experienced narrowing of the order of 100 km s-1 yr-1.
4.2. Blueshifted Line Profiles
Blueshifted line profiles are quite common in the late-time CCSN spectra. Emission asymmetry is strongest in the forbidden oxygen lines, particularly [O III], but is also observed in H line profiles where it is generally less pronounced. The oxygen line profiles also show conspicuous emission line substructure.
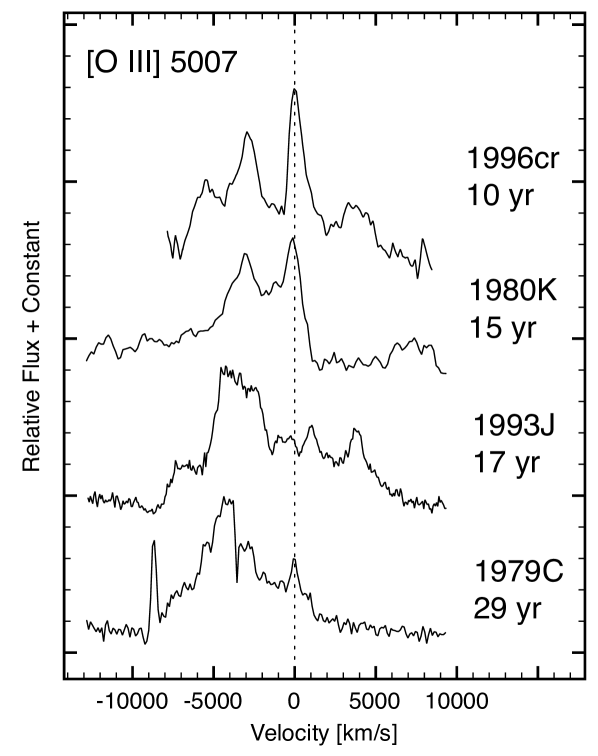
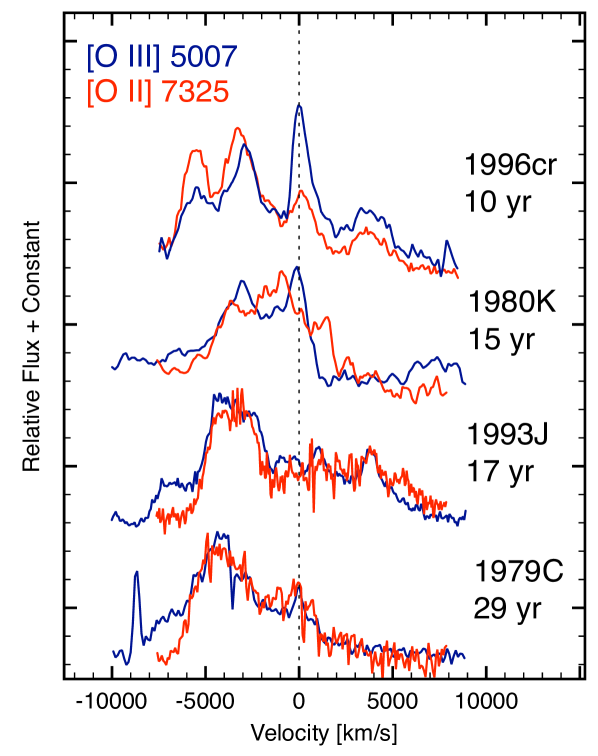
The presence of blueshifts in many late-time CCSN spectra is illustrated in the top panel of Figure 13, where we show line profiles of [O III] emission for SN 1979C, 1980K, 1993J, and 1996cr. These SNe exhibit noticeably asymmetric profiles dominated by blueshifted emission with velocities in excess of km s-1. SN 1979C and 1980K, showing very little redshifted emission, are extreme examples of this phenomenon. In the case of SN 1996cr, evidence for two blueshifted peaks can be seen. The blueshifted asymmetry and line substructure is also present in [O II] line emission, which is shown in the bottom panel of Figure 13.
These asymmetric oxygen emission line profiles suggest that internal absorption is obscuring emission from the SN’s receding rear hemisphere. One candidate for this type of absorption at late epochs is dust formation in metal-rich ejecta much like that seen in SN 1987A (see McCray 1993 and references therein). Beginning around 450 days after optical maximum, SN 1987A exhibited an increase in infrared emission accompanied shortly thereafter with a noticeable blueshift in the [Mg I], [O I], and [C I] emission lines. The blueshift was attributed to an attenuation of emission from the receding side of the ejecta by dust grains formed within the ejecta, and the infrared excess associated with the subsequent re-radiation by the dust grains.
Absorption due to dust in SN ejecta has also been suggested to explain the late-time asymmetric UV line profiles observed in SN 1979C (Fesen et al., 1999). Double-peaked profiles with the blueward peak substantially stronger than the red were seen in C II] 2324, 2325, [O II] 2470, 2470, and Mg II 2796, 2803 emissions. A handful of additional cases where dust formation in ejecta has been proposed include SN 1990I (Elmhamdi et al., 2004), 1999em (Elmhamdi et al., 2003), 2003gd (Sugerman et al., 2006; Meikle et al., 2007), 2005af (Kotak et al., 2006), 2007it (Andrews et al., 2011), and 2007od where it may have had a clumpy structure (Inserra et al., 2011; Andrews et al., 2010).
Alternatively, absorption by dust may take place in the cool dense shell (CDS) in the shock region (Deneault et al., 2003). This is a likely place for dust formation because of its high density and low temperature (Fransson, 1984; Chevalier & Fransson, 1994). Assuming the CDS is formed behind the reverse shock (in the Lagrangian reference frame), both the front- and back-side line emission will be absorbed by the dust, though hydrodynamic mixing giving rise to a clumpy CDS can allow some emission to penetrate (Chevalier & Blondin, 1995). Formation of dust in a CDS has been reported in at least three supernovae within months of outburst including 1998S (Gerardy et al., 2000), 2005ip (Fox et al., 2009; Smith et al., 2009), and 2006jc (Smith et al., 2008). It was also reported in SN 2004et, which exhibited a wide km s-1 box-shaped H emission about two years past outburst with a blueshifted profile resembling many of the oxygen profiles presented here (Kotak et al. 2009; see Fig. 4 of that paper).
However, it is important to note that not all supernovae in our sample show large and pronounced blueshifted oxygen or hydrogen line emission. SN 1957D, 1986J, 1987A, and 1986E only exhibit relatively small velocity blueshifts of approximately km s-1. Another exception is the ultraluminous oxygen-rich supernova remnant SNR 4449-1. Unlike the other supernovae of this group, pronounced asymmetry is seen in SNR 4449-1’s [S II] 6716, 6731 and [Ar III] 7136 emission profiles which exhibit blueshifted velocity distributions spanning km s-1 (Milisavljevic & Fesen, 2008; Bietenholz et al., 2010).
5. Models of SN–CSM Interaction
The optical emissions from the supernovae discussed here are likely to be from circumstellar interaction, except for SN 1987A where radioactivity is a plausible power source at an age of 8 years (Chugai et al., 1997; Kozma & Fransson, 1998a, b; Larsson et al., 2011). Thus, the changes in relative line strengths and widths of the O and H lines noted in Section 3 are useful tests of SN–CSM interaction models.
If the supernova and circumstellar gas is evenly distributed, the interaction is expected to lead to brighter optical emission from the reverse shock region as opposed to the forward shock because of the higher density there (Chevalier & Fransson, 1994, 2003). The forward shock generally is nonradiative, but radiative shocks can occur in this region if the circumstellar gas is very clumpy. This is the likely source of the narrow lines in Type IIn supernovae (Chugai & Danziger, 1994).
| SN | Type | Age | H line | ||
|---|---|---|---|---|---|
| (yr) | () | ||||
| 1993J | IIb | 2.4 | 6 | 0.1 | present |
| 1993J | IIb | 2.4 | 17 | 0.3 | weak |
| 1970G | IIL | 6.8 | 40 | 2.2 | present |
| 1979C | IIL | 11 | 14 | 1.3 | present |
| 1979C | IIL | 11 | 29 | 2.6 | weak |
| 1980K | IIL | 1.3 | 31 | 0.3 | present |
| 1986E | IIL | 3 | 8 | 0.2 | present |
Supernovae of Type IIL and IIb show broader optical line emission and are plausibly described by the scenario of reverse and forward shocks. Estimates of the mass loss density for these events can be obtained from radio observations (Weiler et al., 2002; Montes et al., 1997) and are shown in Table 3, where is the progenitor mass loss rate in units of and is the wind velocity in units of 10 km s-1. Several assumptions are made in obtaining these estimates; in particular, the preshock wind temperature is assumed to be K and the shock velocity is km s-1. The value for SN 1986E is from Montes et al. (1997) and is scaled to the lower limit values of Weiler et al. (2002) on SN 1979C and SN 1980K. Overall, the wind densities are at the high end of wind densities estimated for red supergiant stars.
In the initial phase of interaction, the gas heated at the reverse shock radiatively cools and there is optical emission from both the cooling shock wave and preshock ejecta that have been radiatively heated (Chevalier & Fransson, 1994, 2003). During this phase, the shock luminosity drops approximately as , where is the forward shock velocity. The transition to a noncooling phase occurs at
| (1) | |||||
where is the power law exponent of the ejecta density profile and is the highest velocity in the freely expanding ejecta. It can be seen that the result is very sensitive to (expected to be in the range ) and the velocity. By this estimate, the cases considered here are expected to be in the nonradiative phase, although Nymark et al. (2009) model SN 1993J as being in the radiative phase at an age of just 8 years.
Another factor is the composition of matter at the reverse shock. Equation (1) assumes solar abundances and an enhancement of heavy elements prolongs the radiative phase. The optical emission is expected to be mainly from the pre-reverse shock ejecta. Some emission from the cool dense shell built up during the radiative phase is possible, but that gas is expected to disperse with time.
This model allows an estimate of the circumstellar gas that has been swept up by the forward shock front
| (2) |
where is the average velocity of the forward shock and is in units of km s-1. The mass of shocked ejecta, , is simply related to if the supernova density profile is a power law with index (Chevalier, 1982). For , we have , which is the value used in Table 3. This value of is smaller than the high value that might be expected at the outer part of the supernova because the reverse shock has moved in to the supernova at these late times. The mass ratio is a factor smaller for , and the same factor larger for .
Within these uncertainties, the results in Table 3 are consistent with the view that the decline of H emission in these supernovae, where it occurs, is due to all of the H envelope having passed through the reverse shock wave. In the case of SN 1993J, models of the early supernova indicate a H envelope mass of (Woosley et al., 1994). This mass would have been shocked by the time of the observation at yr, so there is no longer H present at the reverse shock. Type IIL supernovae are believed to have higher H envelope masses than Type IIb events. For instance, Blinnikov & Bartunov (1993) find that H envelopes with mass are present. Thus, the disappearance of the broad H emission in SN 1979C is consistent within this framework. The observations of the H line compared to O lines are generally in accord with expectations, and there is the prediction that the H line in SN 1970G should fade in the not-too-distant future.
Another expectation of the circumstellar interaction scenario is that the interaction leads to the deceleration of the gas near the reverse shock front. For the power law density profile, we have a radial expansion , where (Chevalier, 1982). The highest velocity at the reverse shock evolves as
| (3) | |||||
where is used for the reference value of . The expected rate of line narrowing is close to that observed.
6. CCSNe and SNRs: Comparisons to Cas A
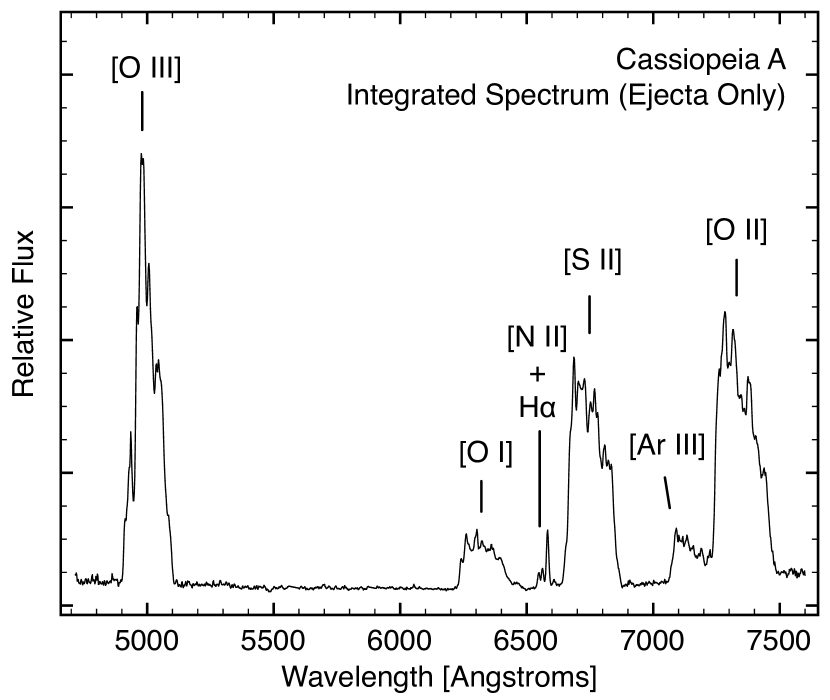
In an effort to understand the nature of blueshifted and multiple peak emission line profiles and relate their features with kinematic properties of the optically emitting ejecta, a spatially integrated spectrum of the young Galactic supernova remnant Cassiopeia A (Cas A) was constructed. Cas A is the prototype for the class of young, oxygen-rich SNRs and provides a clear look at the explosion dynamics of a CCSN (van den Bergh, 1988; Fesen, 2001). Recent detection of optical echoes of the supernova outburst indicate it was a Type IIb event, probably from a red supergiant progenitor with mass M⊙ that may have lost much of its hydrogen envelope to a binary interaction (Krause et al., 2008; Rest et al., 2011; Fabian et al., 1980; Vink et al., 1996; Young et al., 2006). A nearby distance of 3.4 kpc has permitted detailed study of Cas A’s composition and distribution of supernova ejecta on fine scales (Reed et al., 1995; Fesen et al., 2001), and its estimated current age of 330 yr places it at a stage of evolution not that different from the intermediate-aged CCSNe of our sample (Thorstensen et al., 2001; Fesen et al., 2006).
Our integrated spectrum of the Cas A SNR is presented in Figure 14. The spectrum was extracted from 80 long slit spectra spaced apart across the entire main shell (approximately in diameter) covering the wavelength region Å (resolution 7 Å) from an investigation of the remnant’s three-dimensional kinematic structure (Milisavljevic & Fesen, 2012).
This spectrum has not been corrected for reddening which can vary (Hurford & Fesen, 1996), so [O III] emission is intrinsically much more dominant than the presented spectrum indicates. These spectra also largely omit emission from the remnant’s slow-moving circumstellar material called quasi-stationary flocculi (QSFs). Additionally, the spectrum does not include emission from the faint NE jet or other outer ejecta which contribute relatively insignificant optical flux.

6.1. Cas A’s Asymmetric Emission Profiles
The Cas A spectrum (Fig. 14) shows pronounced blueshifted emission with conspicuous line substructure in [O I], [O II], [O III], [S II], and [Ar III]. These line profiles are all asymmetric, with bulk blueshifts peaked around km s-1 and a blue to red asymmetry that increases somewhat with higher ionization levels. The velocity line profiles of the forbidden oxygen lines are shown in Figure 15. The [S II] 6716, 6731 and [Ar III] 7136 lines, not shown in Figure 15, have comparable blueshifts of around km s-1.
The Cas A spectrum appears similar to many of the intermediate-aged CCSNe exhibiting strong [O III] emission. Particularly well-matched with Cas A are SN 1979C, SN 1993J, SNR 4449-1, and to some degree SN 1980K (see Fig. 13), which show strong blueshifted oxygen emissions and/or conspicuous line substructure.
In Figure 16, the [O III] emission line profile of the integrated Cas A spectrum is plotted along with the profiles of SN 1993J and SNR 4449-1 to highlight their similar spectral features. It is interesting to note that Cas A and SN 1993J were both Type IIb SNe at photospheric stages, and here we see that they share late-time spectral features as well.
Extensive multi-wavelength studies of Cas A allow strong ties to be made between the emission asymmetry and absorption due to dust in the ejecta. Cas A is the only Galactic supernova remnant that exhibits clear evidence of dust formed in its ejecta (Lagage et al., 1996; Arendt et al., 1999; Dwek, 2004; Krause et al., 2004). Estimates of the total mass remain controversial, ranging over several orders of magnitude from less than M⊙ to over 4 M⊙. However, most recently Spitzer infrared observations showed close overlap between the ejecta and dust maps of the remnant indicating freshly formed dust in the ejecta having a total dust mass in the range of 0.020 - 0.054 M⊙ (Rho et al., 2008).
6.2. Ejecta Rings: Are They Common?
The three-dimensional kinematic properties of Cas A’s ejecta have been studied in considerable detail (Lawrence et al., 1995; Reed et al., 1995; DeLaney et al., 2010; Milisavljevic & Fesen, 2012). In general, Cas A’s optical emission takes the form of an approximately spherical shell made up of several large ring-like structures composed of O- and S-rich material with radii of ( pc). Its brightest optical emission comes from two continuous rings of material along its northern limb which are distinct in velocity space: A larger ring of highly redshifted material spanning radial velocities to km s-1, and a smaller ring of mostly blueshifted material spanning to km s-1. A handful of additional broken and complete rings contribute to a velocity asymmetry in the radial velocities of order to km s-1.
The observed line profiles of Cas A’s integrated spectrum indicate that internal absorption obscures or ‘hides’ important kinematic properties of its ejecta. Given that the integrated profile resulting from a ring or torus of material suffering no opacity effects is double-peaked (such that each individual peak is centered at the approaching and receding velocity edges of the ring), a collection of co-added double-peaked profiles would be expected from the many ejecta rings that make up the remnant. Instead, these rings manifest kinematically in the emission line profiles as line substructure over top an overall blueshifted distribution. Thus, the combination of internal absorption with the wide range of orientations, velocities, and discontinuities of the ejecta rings produces an integrated emission profile not indicative of its multi-ringed nature.
Emission line substructure in late-time spectra of CCSNe like that observed in SN 1993J and SNR 4449-1 (Fig. 16) is typically identified as ‘blobs’ or ‘clumps’ of ejecta (Matheson et al., 2000a; Milisavljevic & Fesen, 2008) . However, the multi-peaked line substructure seen in Cas A’s emissions originate from its multi-ringed distribution of ejecta. Hence, the similarity between the emission line profiles of the Cas A SNR and decades-old CCSNe raises the possibility that the long-lived emission line substructure of these extragalactic events may be linked with SN debris arranged in large-scale rings being excited by a reverse shock like that observed in Cas A.

7. Conclusions
Optical HST images and ground-based spectra of several CCSNe obtained years to decades after outburst were investigated in an effort to understand some of their late-time optical emission properties. New observations of SN 1957D, 1970G, 1980K, and 1993J were presented, examined, and compared to archival late-time spectra of six additional CCSNe retrieved from the literature (SN 1979C, 1986E, 1986J, 1987A, 1996cr, and SNR 4449-1). Temporal evolution in the relative strengths and profiles of strong emission lines were inspected with particular attention to hydrogen and oxygen emissions.
Properties common to the spectra were found to be consistent with an association between the long-lived late-time optical emissions and interaction between SN ejecta and the progenitor star’s circumstellar material. Many objects exhibit conspicuously declining H/([O I+[O II]) and increasing [O III]/([O I]+[O II]) flux ratios over time. Narrowing velocity widths of emission lines were also seen in a handful of cases. These trends are consistent with predictions of SN–CSM interaction models. The decline of H emission is most likely due to the H envelope having passed through the reverse shock wave, and the line narrowing the result of the deceleration of the interaction shell between the SN ejecta and the CSM at a rate of km s-1 yr-1.
Asymmetric emission line profiles in oxygen and/or hydrogen emissions with one or more blueshifted emission peaks were also found to be a common and long-lasting phenomenon. All spectra in our sample (see Fig. 12) exhibit emission profiles having bulk blueshifts – but never redshifts – suggestive of dust formation within the ejecta or the CDS in the shock region. Many spectra also show conspicuous line substructure across ionization species.
To further investigate the nature of these emission line asymmetries and substructures, an integrated optical spectrum of the 330 yr old Galactic supernova remnant Cas A was created to simulate what a CCSN remnant would look like as an unresolved extragalactic source. Blueshifted profiles with extensive line substructure were seen in the most prominent lines of [O I], [O II], [O III], [S II], and [Ar III]. The kinematic properties of the ejecta were mapped with these line profiles. The multi-peaked line profiles were associated with previously identified large ring-like structures of high-velocity ejecta, and the lines’ blueshifted velocities were linked to internal absorption resulting from dust known to reside within the ejecta.
Remarkable similarities are seen between the Cas A spectrum and the intermediate-aged CCSN spectra of our sample. The correspondence of late-time spectral features between Cas A and SN 1993J is particularly strong, which is interesting given that both were Type IIb events. The shared spectral features are consistent with the view that emission line asymmetry observed in many evolved CCSN spectra may be associated with dust in the ejecta. Furthermore, the similarities between these supernovae suggest that emission line substructures typically interpreted as ejecta ‘clumps’ or ‘blobs’ in intermediate-aged CCSNe may actually be linked with large-scale rings of ejecta as seen in Cas A. It is worthwhile to note that Cas A is not unique in the spatial distribution of its metal-rich ejecta, as other young SNRs such as E0102 (Tuohy & Dopita, 1983; Eriksen et al., 2001; Vogt & Dopita, 2010) and N132D (Morse et al., 1995; Vogt & Dopita, 2011) also exhibit ejecta arranged in ring-like geometries.
References
- Allen et al. (1976) Allen, R. J., Goss, W. M., Ekers, R. D., & de Bruyn, A. G. 1976, A&A, 48, 253
- Andrews et al. (2010) Andrews, J. E., et al. 2010, ApJ, 715, 541
- Andrews et al. (2011) Andrews, J. E., et al. 2011, ApJ, 731, 47
- Arendt et al. (1999) Arendt, R. G., Dwek, E., & Moseley, S. H. 1999, ApJ, 521, 234
- Aretxaga et al. (1999) Aretxaga, I., Benetti, S., Terlevich, R. J., Fabian, A. C., Cappellaro, E., Turatto, M., & della Valle, M. 1999, MNRAS, 309, 343
- Barbon et al. (1979) Barbon, R., Ciatti, F., & Rosino, L. 1979, A&A, 72, 287
- Barbon et al. (1982) Barbon, R., Ciatti, F., & Rosino, L. 1982, A&A, 116, 35
- Bartel et al. (1994) Bartel, N., et al. 1994, Nature, 368, 610
- Bartel et al. (2000) Bartel, N., et al. 2000, Science, 287, 112
- Bauer et al. (2008) Bauer, F. E., Dwarkadas, V. V., Brandt, W. N., Immler, S., Smartt, S., Bartel, N., & Bietenholz, M. F. 2008, ApJ, 688, 1210
- Bietenholz et al. (2010) Bietenholz, M. F., Bartel, N., Milisavljevic, D., Fesen, R. A., Challis, P., & Kirshner, R. P. 2010, MNRAS, 409, 1594
- Blair et al. (1983) Blair, W. P., Kirshner, R. P., & Winkler, Jr., P. F. 1983, ApJ, 272, 84
- Blair et al. (1984) Blair, W. P., Raymond, J. C., Gull, T. R., & Fesen, R. A. 1984, ApJ, 279, 708
- Blinnikov & Bartunov (1993) Blinnikov, S. I., & Bartunov, O. S. 1993, A&A, 273, 106
- Brown & Marscher (1978) Brown, R. L., & Marscher, A. P. 1978, ApJ, 220, 467
- Buta (1982) Buta, R. J. 1982, PASP, 94, 578
- Canizares et al. (1982) Canizares, C. R., Kriss, G. A., & Feigelson, E. D. 1982, ApJ, 253, L17
- Cappellaro et al. (1991) Cappellaro, E., Barbon, R., Valle, M. D., Ortolani, S., Rosino, L., & Turatto, M. 1991, Supernovae: The Tenth Santa Cruz Summer Workshop, 277, 106
- Cappellaro et al. (1995) Cappellaro, E., Danziger, I. J., & Turatto, M. 1995, MNRAS, 277, 106
- Chandra et al. (2009) Chandra, P., Dwarkadas, V. V., Ray, A., Immler, S., & Pooley, D. 2009, ApJ, 699, 388
- Chevalier & Blondin (1995) Chevalier, R., & Blondin, J. M. 1995, ApJ, 444, 312
- Chevalier (1982) Chevalier, R. A. 1982, ApJ, 258, 790
- Chevalier & Fransson (1992) Chevalier, R. A., & Fransson, C. 1992, ApJ, 395, 540
- Chevalier & Fransson (1994) Chevalier, R. A., & Fransson, C. 1994, ApJ, 420, 268
- Chevalier & Fransson (2003) Chevalier, R. A., & Fransson, C. 2003, in Lecture Notes in Physics, Berlin Springer Verlag, Vol. 598, Supernovae and Gamma-Ray Bursters, ed. K. Weiler, 171–194
- Chevalier & Fransson (2006) Chevalier, R. A., & Fransson, C. 2006, ApJ, 651, 381
- Chevalier & Oishi (2003) Chevalier, R. A., & Oishi, J. 2003, ApJ, 593, L23
- Chu et al. (2004) Chu, Y., Gruendl, R. A., Stockdale, C. J., Rupen, M. P., Cowan, J. J., & Teare, S. W. 2004, AJ, 127, 2850
- Chugai et al. (1997) Chugai, N. N., Chevalier, R. A., Kirshner, R. P., & Challis, P. M. 1997, ApJ, 483, 925
- Chugai & Danziger (1994) Chugai, N. N., & Danziger, I. J. 1994, MNRAS, 268, 173
- Cowan & Branch (1982) Cowan, J. J., & Branch, D. 1982, ApJ, 258, 31
- Cowan et al. (1991) Cowan, J. J., Goss, W. M., & Sramek, R. A. 1991, ApJ, 379, L49
- DeLaney et al. (2010) DeLaney, T., et al. 2010, ApJ, 725, 2038
- Deneault et al. (2003) Deneault, E., Clayton, D. D., & Heger, A. 2003, ApJ, 594, 312
- Detre & Lovas (1970) Detre, L., & Lovas, M. 1970, IAU Circ., 2269, 1
- Dwek (2004) Dwek, E. 2004, ApJ, 607, 848
- Elmhamdi et al. (2004) Elmhamdi, A., Danziger, I. J., Cappellaro, E., Della Valle, M., Gouiffes, C., Phillips, M. M., & Turatto, M. 2004, A&A, 426, 963
- Elmhamdi et al. (2003) Elmhamdi, A., et al. 2003, MNRAS, 338, 939
- Eriksen et al. (2001) Eriksen, K. A., Morse, J. A., Kirshner, R. P., & Winkler, P. F. 2001, in American Institute of Physics Conference Series, Vol. 565, Young Supernova Remnants, ed. S. S. Holt & U. Hwang, 193–196
- Fabian et al. (1980) Fabian, A. C., Willingale, R., Pye, J. P., Murray, S. S., & Fabbiano, G. 1980, MNRAS, 193, 175
- Feast (1999) Feast, M. 1999, in IAU Symposium, Vol. 190, New Views of the Magellanic Clouds, ed. Y.-H. Chu, N. Suntzeff, J. Hesser, & D. Bohlender, 542
- Fesen (1993) Fesen, R. A. 1993, ApJ, 413, L109
- Fesen & Becker (1988) Fesen, R. A., & Becker, R. H. 1988, in Bulletin of the American Astronomical Society, Vol. 20, Bulletin of the American Astronomical Society, 962
- Fesen & Becker (1990) Fesen, R. A., & Becker, R. H. 1990, ApJ, 351, 437
- Fesen et al. (1995) Fesen, R. A., Hurford, A. P., & Matonick, D. M. 1995, AJ, 109, 2608
- Fesen & Matonick (1994) Fesen, R. A., & Matonick, D. M. 1994, ApJ, 428, 157
- Fesen (2001) Fesen, R. A. 2001, ApJS, 133, 161
- Fesen et al. (2001) Fesen, R. A., Morse, J. A., Chevalier, R. A., Borkowski, K. J., Gerardy, C. L., Lawrence, S. S., & van den Bergh, S. 2001, AJ, 122, 2644
- Fesen et al. (1999) Fesen, R. A., et al. 1999, AJ, 117, 725
- Fesen et al. (2006) Fesen, R. A., et al. 2006, ApJ, 636, 859
- Filippenko et al. (1995) Filippenko, A. V., Barth, A. J., Bower, G. C., Ho, L. C., Stringfellow, G. S., Goodrich, R. W., & Porter, A. C. 1995, AJ, 110, 2261
- Filippenko & Matheson (2003) Filippenko, A. V., & Matheson, T. 2003, arXiv:0310228
- Filippenko et al. (1994) Filippenko, A. V., Matheson, T., & Barth, A. J. 1994, AJ, 108, 2220
- Filippenko et al. (1993a) Filippenko, A. V., Treffers, R. R., Paik, Y., Davis, M., & Schlegel, D. 1993a, IAU Circ., 5731
- Filippenko et al. (1993b) Filippenko, A. V., Matheson, T., & Woosley, S. E. 1993b, IAU Circ., 5787, 1
- Filippenko et al. (1993c) Filippenko, A. V., Matheson, T., & Ho, L. C. 1993c, ApJ, 415, L103
- Fox et al. (2009) Fox, O., et al. 2009, ApJ, 691, 650
- Fransson (1984) Fransson, C. 1984, A&A, 133, 264
- Fransson et al. (2005) Fransson, C., et al. 2005, ApJ, 622, 991
- Freedman et al. (1994) Freedman, W. L., et al. 1994, ApJ, 427, 628
- Freedman et al. (2001) Freedman, W. L., et al. 2001, ApJ, 553, 47
- Garnavich & Ann (1993) Garnavich, P. M., & Ann, H. B. 1993, in Bulletin of the American Astronomical Society, Vol. 25, American Astronomical Society Meeting Abstracts #182, 1244
- Gates & Carpenter (1958) Gates, H. S., & Carpenter, E. F. 1958, Harvard Announcement Card, No., 1394, 1
- Gerardy et al. (2000) Gerardy, C. L., Fesen, R. A., Höflich, P., & Wheeler, J. C. 2000, AJ, 119, 2968
- Goodrich et al. (1989) Goodrich, R. W., Stringfellow, G. S., Penrod, G. D., & Filippenko, A. V. 1989, ApJ, 342, 908
- Hurford & Fesen (1996) Hurford, A. P., & Fesen, R. A. 1996, ApJ, 469, 246
- Inserra et al. (2011) Inserra, C., et al. 2011, MNRAS, in press (arXiv:1102.5468)
- Karachentsev et al. (2000) Karachentsev, I. D., Sharina, M. E., & Huchtmeier, W. K. 2000, A&A, 362, 544
- Kasen & Bildsten (2010) Kasen, D., & Bildsten, L. 2010, ApJ, 717, 245
- Kirshner (1990) Kirshner, R. P. 1990, in Supernovae, ed. A. G. Petschek, 59–75
- Kirshner & Blair (1980) Kirshner, R. P., & Blair, W. P. 1980, ApJ, 236, 135
- Kirshner & Kwan (1974) Kirshner, R. P., & Kwan, J. 1974, ApJ, 193, 27
- Kirshner et al. (1973) Kirshner, R. P., Oke, J. B., Penston, M. V., & Searle, L. 1973, ApJ, 185, 303
- Kochanek et al. (2011) Kochanek, C. S., Szczygiel, D. M., & Stanek, K. Z. 2011, ApJ, 737, 76
- Kotak et al. (2006) Kotak, R., et al. 2006, ApJ, 651, L117
- Kotak et al. (2009) Kotak, R., et al. 2009, ApJ, 704, 306
- Kozma & Fransson (1998a) Kozma, C., & Fransson, C. 1998a, ApJ, 496, 946
- Kozma & Fransson (1998b) Kozma, C., & Fransson, C. 1998b, ApJ, 497, 431
- Krause et al. (2004) Krause, O., Birkmann, S. M., Rieke, G. H., Lemke, D., Klaas, U., Hines, D. C., & Gordon, K. D. 2004, Nature, 432, 596
- Krause et al. (2008) Krause, O., Birkmann, S. M., Usuda, T., Hattori, T., Goto, M., Rieke, G. H., & Misselt, K. A. 2008, Science, 320, 1195
- Kunkel et al. (1987) Kunkel, W., et al. 1987, IAU Circ., 4316, 1
- Lagage et al. (1996) Lagage, P. O., Claret, A., Ballet, J., Boulanger, F., Cesarsky, C. J., Cesarsky, D., Fransson, C., & Pollock, A. 1996, A&A, 315, L273
- Larsson et al. (2011) Larsson, J., et al. 2011, Nature, 474, 484
- Lawrence et al. (1995) Lawrence, S. S., MacAlpine, G. M., Uomoto, A., Woodgate, B. E., Brown, L. W., Oliversen, R. J., Lowenthal, J. D., & Liu, C. 1995, AJ, 109, 2635
- Leibundgut et al. (1991) Leibundgut, B., Kirshner, R. P., Pinto, P. A., Rupen, M. P., Smith, R. C., Gunn, J. E., & Schneider, D. P. 1991, ApJ, 372, 531
- Leibundgut et al. (1993) Leibundgut, B., Kirshner, R. P., & Porter, A. C. 1993, in Bulletin of the American Astronomical Society, Vol. 25, American Astronomical Society Meeting Abstracts #182, 834
- Long et al. (1989) Long, K. S., Blair, W. P., & Krzeminski, W. 1989, ApJ, 340, L25
- Long et al. (1992) Long, K. S., Winkler, P. F., & Blair, W. P. 1992, ApJ, 395, 632
- Massey & Gronwall (1990) Massey, P., & Gronwall, C. 1990, ApJ, 358, 344
- Matheson et al. (2000a) Matheson, T., Filippenko, A. V., Ho, L. C., Barth, A. J., & Leonard, D. C. 2000a, AJ, 120, 1499
- Matheson et al. (2000b) Matheson, T., et al. 2000b, AJ, 120, 1487
- Matheson et al. (2008) Matheson, T., et al. 2008, AJ, 135, 1598
- Maund & Smartt (2009) Maund, J. R., & Smartt, S. J. 2009, Science, 324, 486
- Maund et al. (2004) Maund, J. R., Smartt, S. J., Kudritzki, R. P., Podsiadlowski, P., & Gilmore, G. F. 2004, Nature, 427, 129
- McCray (1993) McCray, R. 1993, ARA&A, 31, 175
- Meikle et al. (2007) Meikle, W. P. S., et al. 2007, ApJ, 665, 608
- Milisavljevic & Fesen (2008) Milisavljevic, D., & Fesen, R. A. 2008, ApJ, 677, 306
- Milisavljevic & Fesen (2012) Milisavljevic, D., & Fesen, R. A. 2012, in preparation
- Milisavljevic et al. (2009) Milisavljevic, D., Fesen, R. A., Kirshner, R. P., & Challis, P. 2009, ApJ, 692, 839
- Milisavljevic et al. (2008) Milisavljevic, D., Fesen, R. A., Leibundgut, B., & Kirshner, R. P. 2008, ApJ, 684, 1170
- Montes et al. (1997) Montes, M. J., van Dyk, S. D., Weiler, K. W., Sramek, R. A., & Panagia, N. 1997, ApJ, 482, L61+
- Montes et al. (1998) Montes, M. J., van Dyk, S. D., Weiler, K. W., Sramek, R. A., & Panagia, N. 1998, ApJ, 506, 874
- Morse et al. (1995) Morse, J. A., Winkler, P. F., & Kirshner, R. P. 1995, AJ, 109, 2104
- Nymark et al. (2009) Nymark, T. K., Chandra, P., & Fransson, C. 2009, A&A, 494, 179
- Patnaude et al. (2011) Patnaude, D. J., Loeb, A., & Jones, C. 2011, New Astronomy, 16, 187
- Pennington & Dufour (1983) Pennington, R. L., & Dufour, R. J. 1983, ApJ, 270, L7
- Pennington et al. (1982) Pennington, R. L., Talbot, Jr., R. J., & Dufour, R. J. 1982, AJ, 87, 1538
- Reed et al. (1995) Reed, J. E., Hester, J. J., Fabian, A. C., & Winkler, P. F. 1995, ApJ, 440, 706
- Rest et al. (2011) Rest, A., et al. 2011, ApJ, 732, 3
- Rho et al. (2008) Rho, J., et al. 2008, ApJ, 673, 271
- Richmond et al. (1994) Richmond, M. W., Treffers, R. R., Filippenko, A. V., Paik, Y., Leibundgut, B., Schulman, E., & Cox, C. V. 1994, AJ, 107, 1022
- Ripero et al. (1993) Ripero, J., et al. 1993, IAU Circ., 5731, 1
- Ryder et al. (1993) Ryder, S., Staveley-Smith, L., Dopita, M., Petre, R., Colbert, E., Malin, D., & Schlegel, E. 1993, ApJ, 416, 167
- Saha et al. (2006) Saha, A., Thim, F., Tammann, G. A., Reindl, B., & Sandage, A. 2006, ApJS, 165, 108
- Schlegel (1994) Schlegel, E. M. 1994, AJ, 108, 1893
- Schlegel et al. (1999) Schlegel, E. M., Ryder, S., Staveley-Smith, L., Petre, R., Colbert, E., Dopita, M., & Campbell-Wilson, D. 1999, AJ, 118, 2689
- Seaquist & Bignell (1978) Seaquist, E. R., & Bignell, R. C. 1978, ApJ, 226, L5+
- Smith et al. (2009) Smith, J. D. T., Rudnick, L., Delaney, T., Rho, J., Gomez, H., Kozasa, T., Reach, W., & Isensee, K. 2009, ApJ, 693, 713
- Smith et al. (2008) Smith, N., Foley, R. J., & Filippenko, A. V. 2008, ApJ, 680, 568
- Soria & Perna (2008) Soria, R., & Perna, R. 2008, ApJ, 683, 767
- Stockdale et al. (2001) Stockdale, C. J., Goss, W. M., Cowan, J. J., & Sramek, R. A. 2001, ApJ, 559, L139
- Stone (1977) Stone, R. P. S. 1977, ApJ, 218, 767
- Stringfellow et al. (1988) Stringfellow, G. S., Goodrich, R. W., Filippenko, A. V., & Penrod, G. D. 1988, in Bulletin of the American Astronomical Society, Vol. 20, 962
- Sugerman et al. (2012) Sugerman, B., et al. 2012, ApJ, in press (arXiv:1202.3075)
- Sugerman et al. (2006) Sugerman, B., et al. 2006, Science, 313, 196
- Suzuki & Nomoto (1995) Suzuki, T., & Nomoto, K. 1995, ApJ, 455, 658
- Thorstensen et al. (2001) Thorstensen, J. R., Fesen, R. A., & van den Bergh, S. 2001, AJ, 122, 297
- Tuohy & Dopita (1983) Tuohy, I. R., & Dopita, M. A. 1983, ApJ, 268, L11
- Turatto et al. (1990) Turatto, M., Cappellaro, E., Barbon, R., della Valle, M., Ortolani, S., & Rosino, L. 1990, AJ, 100, 771
- Turatto et al. (1989) Turatto, M., Cappellaro, E., & Danziger, I. J. 1989, The Messenger, 56, 36
- Uomoto (1991) Uomoto, A. 1991, AJ, 101, 1275
- Uomoto & Kirshner (1986) Uomoto, A., & Kirshner, R. P. 1986, ApJ, 308, 685
- van den Bergh (1988) van den Bergh, S. 1988, ApJ, 327, 156
- van Dyk et al. (1996) van Dyk, S. D., Hamuy, M., & Filippenko, A. V. 1996, AJ, 111, 2017
- van Dyk et al. (1994) van Dyk, S. D., Weiler, K. W., Sramek, R. A., Rupen, M. P., & Panagia, N. 1994, ApJ, 432, L115
- van Leeuwen et al. (2007) van Leeuwen, F., Feast, M. W., Whitelock, P. A., & Laney, C. D. 2007, MNRAS, 379, 723
- Vink et al. (1996) Vink, J., Kaastra, J. S., & Bleeker, J. A. M. 1996, A&A, 307, L41
- Vogt & Dopita (2010) Vogt, F., & Dopita, M. A. 2010, ApJ, 721, 597
- Vogt & Dopita (2011) Vogt, F., & Dopita, M. A. 2011, Ap&SS, 331, 521
- Weiler et al. (2002) Weiler, K. W., Panagia, N., Montes, M. J., & Sramek, R. A. 2002, ARA&A, 40, 387
- Weiler et al. (1986) Weiler, K. W., Sramek, R. A., Panagia, N., van der Hulst, J. M., & Salvati, M. 1986, ApJ, 301, 790
- Weiler et al. (1992) Weiler, K. W., van Dyk, S. D., Panagia, N., & Sramek, R. A. 1992, ApJ, 398, 248
- Weiler et al. (2007) Weiler, K. W., Williams, C. L., Panagia, N., Stockdale, C. J., Kelley, M. T., Sramek, R. A., Van Dyk, S. D., & Marcaide, J. M. 2007, ApJ, 671, 1959
- Winzer (1974) Winzer, J. E. 1974, JRASC, 68, 36
- Woosley (2010) Woosley, S. E. 2010, ApJ, 719, L204
- Woosley et al. (1994) Woosley, S. E., Eastman, R. G., Weaver, T. A., & Pinto, P. A. 1994, ApJ, 429, 300
- Woosley et al. (1987) Woosley, S. E., Pinto, P. A., Martin, P. G., & Weaver, T. A. 1987, ApJ, 318, 664
- Young et al. (2006) Young, P. A., et al. 2006, ApJ, 640, 891
- Young & Branch (1989) Young, T. R., & Branch, D. 1989, ApJ, 342, L79
- Zimmermann et al. (1994) Zimmermann, H., et al. 1994, Nature, 367, 621