Candidates of Halpha emitting regions in Magellanic Stream IV cloud
Abstract
From H narrow band observations, we identified three H emitting regions in the direction of Magellanic Stream IV (MS IV). They consist of three parallel filaments with 2 arcmin width and 6 – 30 arcmin length at 12 arcmin intervals. The mean surface brightness of them is erg s-1 cm-2 arcsec-2. Because of their low surface brightness, the regions were not detected in previous H surveys. In H i map, the position of the filaments overlap MS, suggesting that they are parts of MS, but there also exists a local H i structure. If the filaments associate with MS, the sizes are 30 pc 100 – 500 pc. The filaments lie at the leading edge of a downstream cloud, which supports a shock heating and its propagation (shock cascade) model for the ionizing source. If they are local objects, on the other hand, Fossil Strömgren Trails of more than two stars is a possible interpretation, and the sizes would be 0.1 pc 0.3 – 1.5 pc at 180 pc distance. The positional information of the H filaments presented in this letter enables us future spectroscopic observations to clarify their nature.
1 Introduction
Magellanic Stream (MS hereafter) was found as a long filament of H i gas around our Galaxy (Mathewson et al., 1974). MS is thought to be stripped gas from Small Magellanic Cloud and/or Large Magellanic Cloud. It has been revealed that MS consists of multi-phase gas components; molecular gas, H i gas, H ii gas, and highly ionized plasma (Fox et al., 2010, and references therein). MS is the only clear example of a gaseous halo stream in the close proximity of Milky Way (Stanimirorović et al., 2008). It gives us important clues to the physical interaction between Galaxy and its satellites in detail.
The H emission from MS has been first reported by Weiner & Williams (1996, hereafter WW96). Putman et al. (2003b) have found several other H emitting regions. The ionizing source of these regions is still a mystery because no ionizing star is observed in the stream. There are several models to explain the origin of the MS H clouds. WW96 argued that the emissions are explained by ram pressure heating. However, this model required much higher density of halo gas than WW96 estimated, because the distance to MS was found to be larger than expected (Weiner et al., 2001). Bland-Hawthorn & Maloney (1999) presented another model that ionizing photons escaping from Galactic disk heat up MS. This model predicted that the H emission would be smoothly distributed. However it is inconsistent with the fact that the contrast of the H emission is as large as a factor of 30 (Weiner et al., 2001). Bland-Hawthorn et al. (2007, hereafter B07) presented yet another model incorporating a shock heating and its propagation (shock cascade). They predicted high H/H ratio, and strong [O ii], [S ii] emissions, which have not been examined yet. Recently, Fox et al. (2010) investigated the absorption features of active galactic nuclei behind MS in order to study the ionization structure of the MS H clouds. They found that the ionization structure cannot be reproduced by an evaporative interaction with the Galactic corona plus photoionization.
In order to study the ionization mechanism and kinematics of the MS H clouds, detailed spectroscopic follow-up observations are required. However, positional information necessary to perform a medium to high dispersion spectroscopy has been so far very limited. The exact position and detailed morphology of the H emitting region found by WW96 was not clear, because they used a Fabry-Pérot interferometer and the spatial structure inside the Fabry-Pérot beam of 7 arcmin diameter was averaged.
There are several other H surveys which overlaps the MS fields. Southern H Sky Survey Atlas111http://amundsen.swarthmore.edu/ (SHASSA; Gaustad et al., 2001) presents H map of 0.8 arcmin pixel. They used a 3.2 nm width filter to detect H emissions. Wisconsin H mapper222http://www.astro.wisc.edu/wham/ (WHAM; Raynolds, et al., 1998; Haffner et al., 2003) provides another H map with high velocity resolution in a velocity range from km s-1 to km s-1 with respect to the local standard of rest (LSR) with 1 degree beam using a Fabry-Pérot spectrometer. The spatial resolutions of those works are still not enough for a slit spectroscopy.
We performed imaging observations with higher spatial resolution at the northern part of MS IV where WW96 detected the H emissions. In this letter, we report the positions and the shapes of the H emitting regions we detected.
2 Observation
We observed two WW96 fields, MS IV-C (23:44:34.8,-12:23:20,J2000.0) and MS IV-D (23:40:49.0,-10:45:32,J2000.0) with 2kCCD camera (Itoh et al., 2001) mounted on Kiso 105 cm Schmidt camera at the Kiso Observatory in September 2011. The pixel scale is 1.5 arcsec pixel-1, and the field of view (FoV) is 51.2 arcmin square. We used R-band and three narrow band filters (N657, Ha6577, and Ha6417). The filter characteristics are shown in Table 1. The variation of the wavelength coverage is no worse than 3.6Å across the filter in Ha6577 and Ha6417. For N657, the transmission curve at the corner is shifted by 10Å to the red from that at the center. We took the exposures with 7.5 arcmin dithering. The typical seeing size was 4.1 arcsec.
The data reduction was performed using the mosaic CCD data reduction packages (Yagi et al., 2002). Overscan subtraction, bias pattern subtraction, flat-fielding with domeflat were performed in a standard manner. The pixel scale of the images are slightly different among filters. The difference was corrected before coadding using the results by SMOKA team (S. Ichikawa, private communication) 333http://smoka.nao.ac.jp/about/KCD_astrometric_calib.jsp. The sky background was subtracted in each frame before coadding with background mesh size of 1024 pixels (25.6 arcmin). Therefore, structures larger than 25 arcmin square would have been removed. After the coadding, stellar objects were detected by SExtractor (Bertin & Arnouts, 1996), and the astrometric calibration was performed using wcstools (Mink, 2002) referring to USNO-B1 catalog (Monet et al., 2003).
We calibrated the flux using the photometry of stars by Sloan digital sky survey (SDSS) data release 7 (Abazajian et al., 2009) in the northern half of the MS IV-D field. The color conversion from SDSS r and i to Kiso 2kCCD filters are constructed by fitting a quadratic function to the photometry of model spectral energy distributions (SEDs) by Bruzual-Pearson-Gunn-Stryker atlas 444ftp://ftp.stsci.edu/cdbs/grid/bpgs/ and the filter responses, as the method in the appendix of Yagi et al. (2010). The best-fit functions are
| (1) |
where = (0.003,0.267,0.052), (-0.075,0.773,-0.292), (-0.034,0.653,-0.210), and (0.014,0.262,0) for R, N657, Ha6577, and Ha6417, respectively, in AB-magnitude for stars. The dispersion of our photometry around the fit is 0.06 – 0.1 mag in rms converted from the median of absolute deviation in each band. As MS IV-C is not covered by SDSS, we roughly estimated the zero point using R-band (-band) photometry of USNO-B1.0 (Monet et al., 2003) in Naval Observatory Merged Astrometric Dataset (Zacharias et al., 2005). The error is estimated to be 0.15 mag. Galactic extinction is about in MS IV-C and MS IV-D from Schlegel et al. (1998) via the extinction calculator in NASA/IPAC extragalactic database (NED)555http://ned.ipac.caltech.edu/forms/calculator.html. We adopted 0.09 mag for all of the 4 bands. The limiting surface brightness (SB) of the final images of MS IV-D in 15 arcsec (10 pix) square are presented in Table 1.
3 Detection of three H emitting regions
We performed eye inspections to detect possible H emitting regions. In the MS IV-C field, we could not find any sign of H excess brighter than 800 mR 6661 Rayleigh (1R) is 1010 photons m-2 s-1 str-1, which corresponds to at 6563Å, and 1 R=1000 mR. with size between 15 arcsec and 25 arcmin scale in the 54 54 arcmin square field. The conversion from SB of N657-R to total H+[N ii] brightness requires the redshift and the line full width at half maximum (FWHM) information, which are unavailable yet. In this study, we therefore assume that the line is located at the wavelength of the maximum transmittance of each filter, and that the line width is much narrower than the filter FWHM. This gives the lower limit of the H+[N ii] brightness.
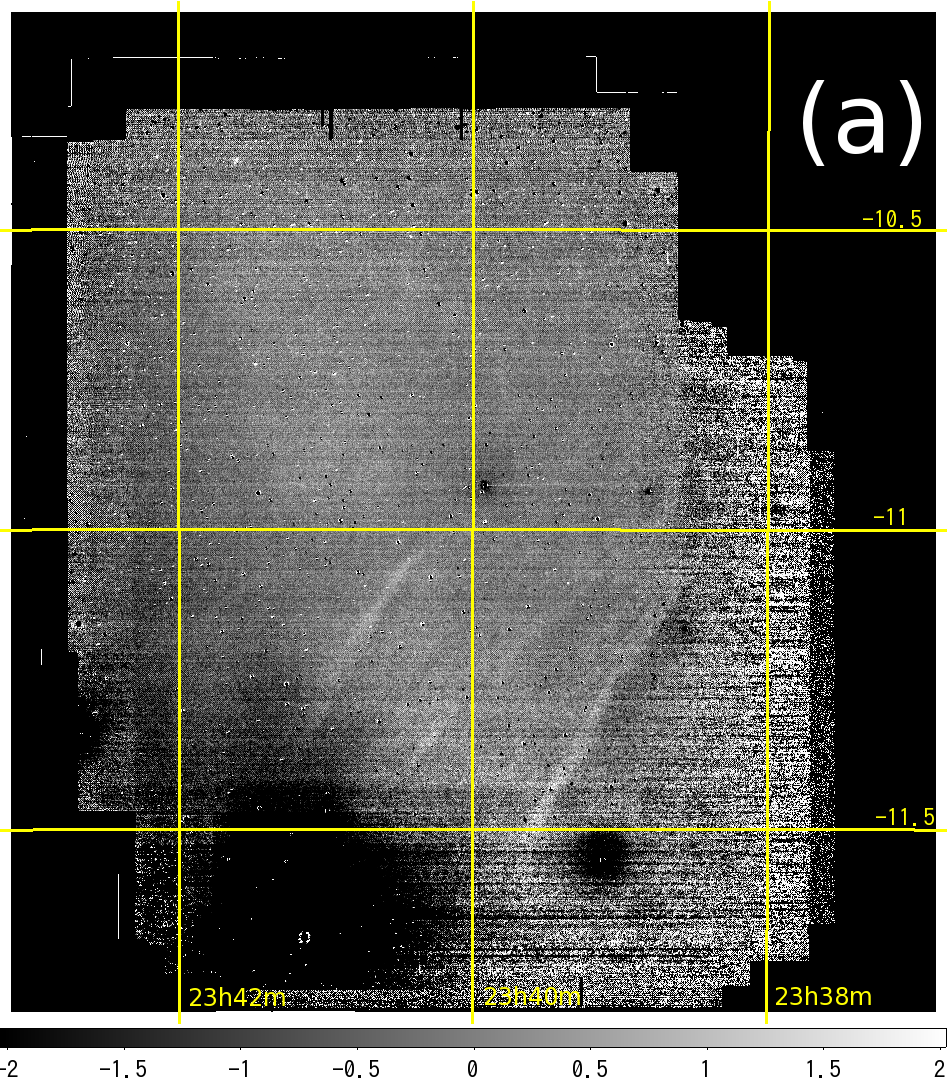
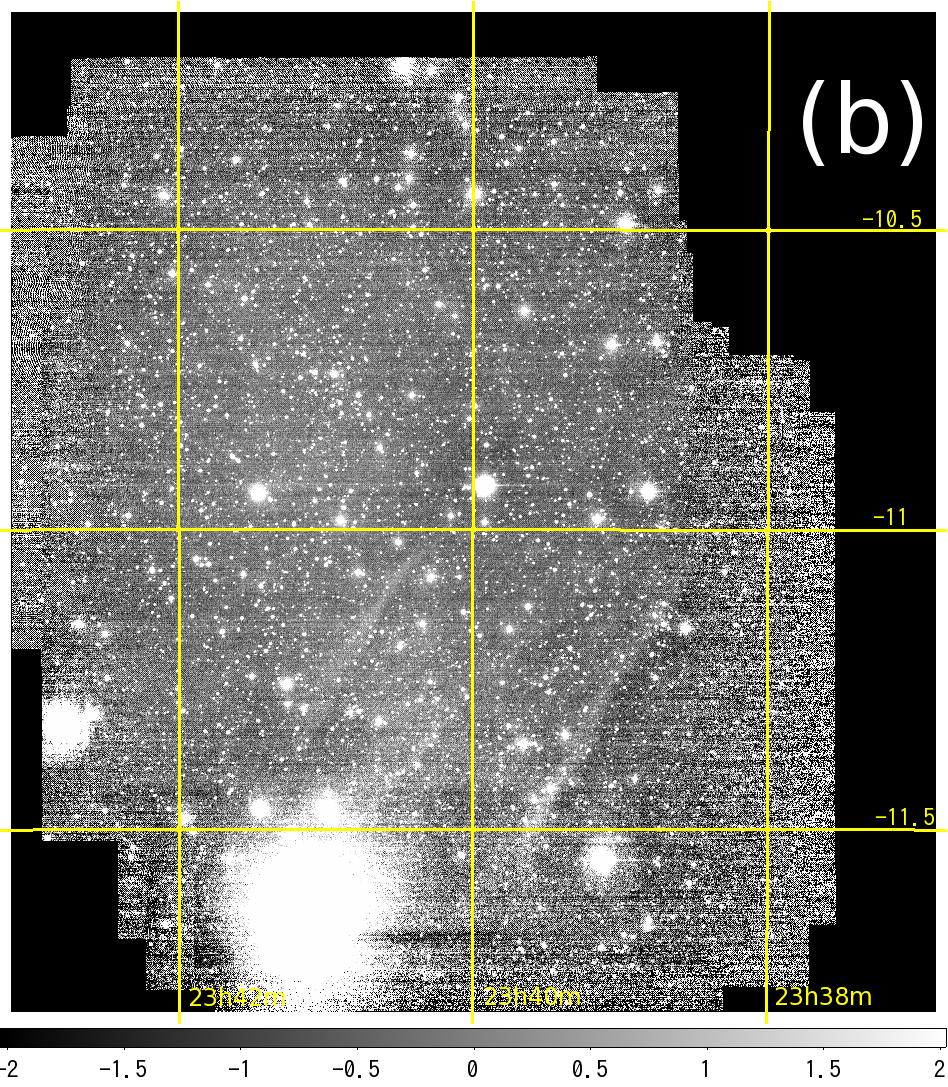
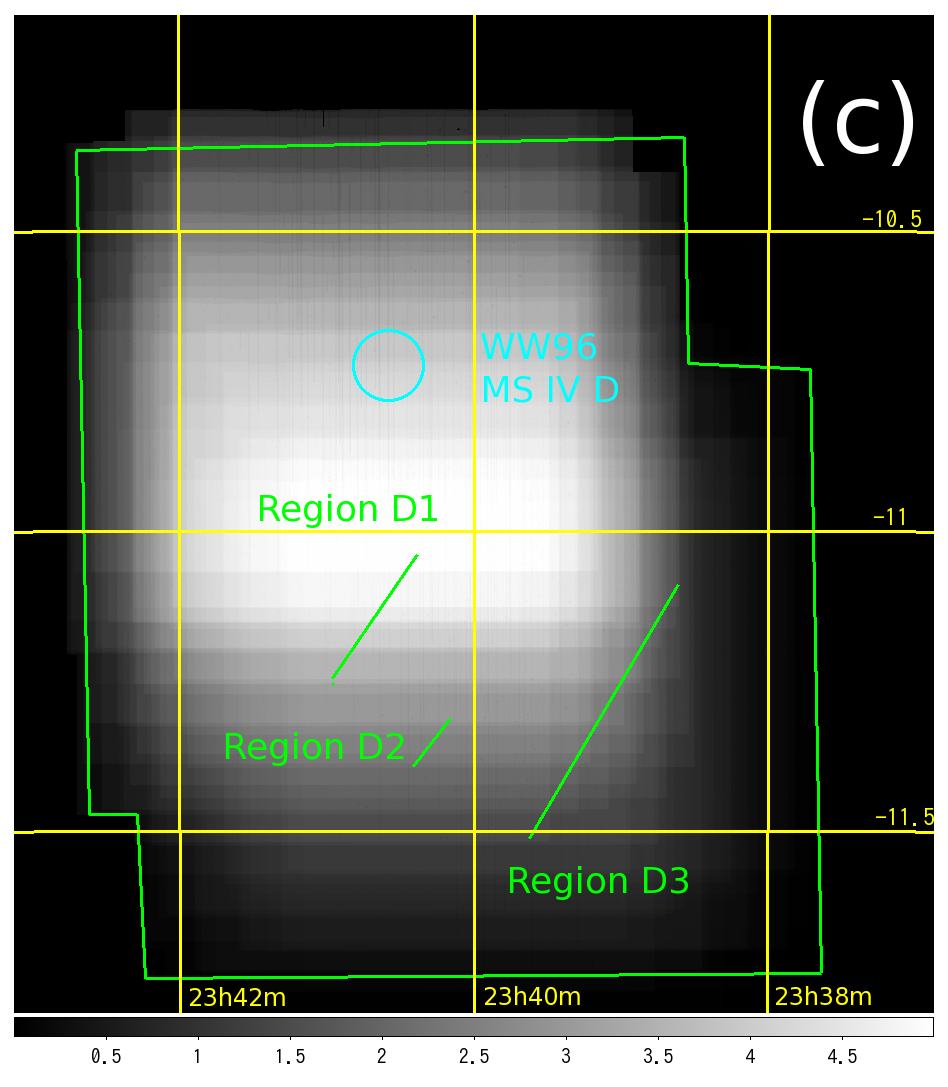
In the MS IV-D field, we detected regions with N657 excess relative to R-band. Fig. 1a and 1b show the R-band subtracted N657 image (N657-R image) and the N657 image of the MS IV-D field, respectively. The images were binned by 1010 pixels (15 arcsec square) to increase signal to noise ratio (S/N). Three filamentary H regions are seen in the lower half region of Fig. 1a and 1b. We call the H regions as D1, D2, and D3 from the east to the west, hereafter. Except the three, we could not detect H emitting structures brighter than 240 mR (1 of the N657-R image) with size between 15 arcsec and 25 arcmin scale in 74 60 arcmin field of MV IV-D. Fig. 1c shows the effective exposure time map of N657-R and the position of the H regions. Because of the bad weather, the southwest part has low S/N. It should also be noted that a bright star at the southwest of D2 made it difficult to measure the emission around it.
We found D1 and part of D3 in the Ha6577 image with SB of 26.3 mag arcsec-2. The three H regions are fainter than 27 mag arcsec-2 in R-band. In the Ha6417 image, neither D1 nor D2 were detected, and D3 was located outside of the FoV. D1 was also found in the N657-Ha6417 image, and marginally recognized in the Ha6577-Ha6417 image. In the Ha6577-R image, D1 and D3 were detected, and D2 was marginally detected. In the N657-Ha6577 image, D1 was marginally positive (N657 bright) with low S/N, and D2 and D3 were not detected. In summary, the excess was found in N657-R, N657-Ha6417, and Ha6577-R, and marginally in N657-Ha6577. The detection in several combination of bands suggests that the features are real emissions.
We investigated the possibility of artifacts. If the filaments were fringes made by sky lines, they should also appear in other fields, but we could not detect such features in other fields (e.g., MS IV-C). We also checked whether the regions were seen in coadded images of each day, and confirmed that they were not moving objects nor transient phenomena. The positions and the shapes remained the same during the observation. When we observe other brighter stars in another field, we found some ghosts of the optics appear. The ghosts moved when we shifted the FoV, and they appeared at different position in Ha6577 and N657. On the contrary, D1–D3 did not move and stayed at the same position in the sky in both filters. Moreover, we made additional observations in November 2011 for the filaments with Ha6577. At that time, we shifted the field to avoid the bright star at south-east. The filaments D1 and D3 were still detected at the same position. D1–D3 are therefore not ghosts. We conclude that the three regions are genuine H emitting regions.
The flux weighted center of the regions are shown in Table 2. The positions are 20 – 50 arcmin away from the aperture of MV IV-D by WW96 (Fig. 1c).
We defined the boundary of the filaments for a quantitative analysis as follows. First, we masked bright objects in R-band, because a residual of subtraction may remain in the N657-R image at the position. Next, we applied a 77 pix (10.5 arcsec square) median filtering to gain S/N. Then the R-band image is subtracted from the N657 image, and binned into 1010 pix (15 arcsec square). In the image, we defined the boundary as the isophote of 220mR, which corresponds to 1-. Above the isophote the regions have 2 arcmin wide and 16, 6, and 29 arcmin long for D1, D2, and D3, respectively. The interval between D1 and D2 are about 12 arcmin, and that between D2 and D3 is also 12 arcmin. If the regions lie at MS distance (55 kpc; Putman et al., 2003a), the width of the three H regions is 30 pc, intervals between them are 200 pc each, and the length are 100 – 500 pc.
For photometric analysis, we used the isophote as the boundary and extracted the regions before median filtering. The SB of the H regions in the N657-R image are 370 mR on average in 15 arcsec square, which corresponds to H+[N ii] brightness of . The SB gradient is seen in D1 and D3. The north-west edge is the faintest in SB in D3, and the gradient is about 20 mR arcmin-1. The gradient in D1 has an opposite direction; the SB is the faintest at the southeast edge, rises by 60 mR arcmin-1 for 10 arcmin, then gradually get fainter toward north west. The gradient is not seen in D2.
4 Comparison with H surveys
Our observed field was covered by two H surveys. One is SHASSA (Gaustad et al., 2001). The H bandwidth (3.2nm) of SHASSA is comparable to our N657. Finkbeiner (2003) removed stellar contamination from the SHASSA data and calibrated the flux777http://skymaps.info/. There are several bright parts in SHASSA data which overlap D1–D3. However, when we checked the original data of SHASSA, they are not permanent but variable among exposures. The bright parts would be artifacts.
The other survey is WHAM, which covers a velocity range of km s-1 with respect to LSR. One of WHAM beam, (73.377, -67.054) is just on D1 (Haffner et al., 2003). If we average the H+[N ii] flux of the regions D1–D3 in 1 degree aperture of WHAM, it would be observed as 5 mR excess, which is too faint to be found in WHAM.
5 Comparison with H i map
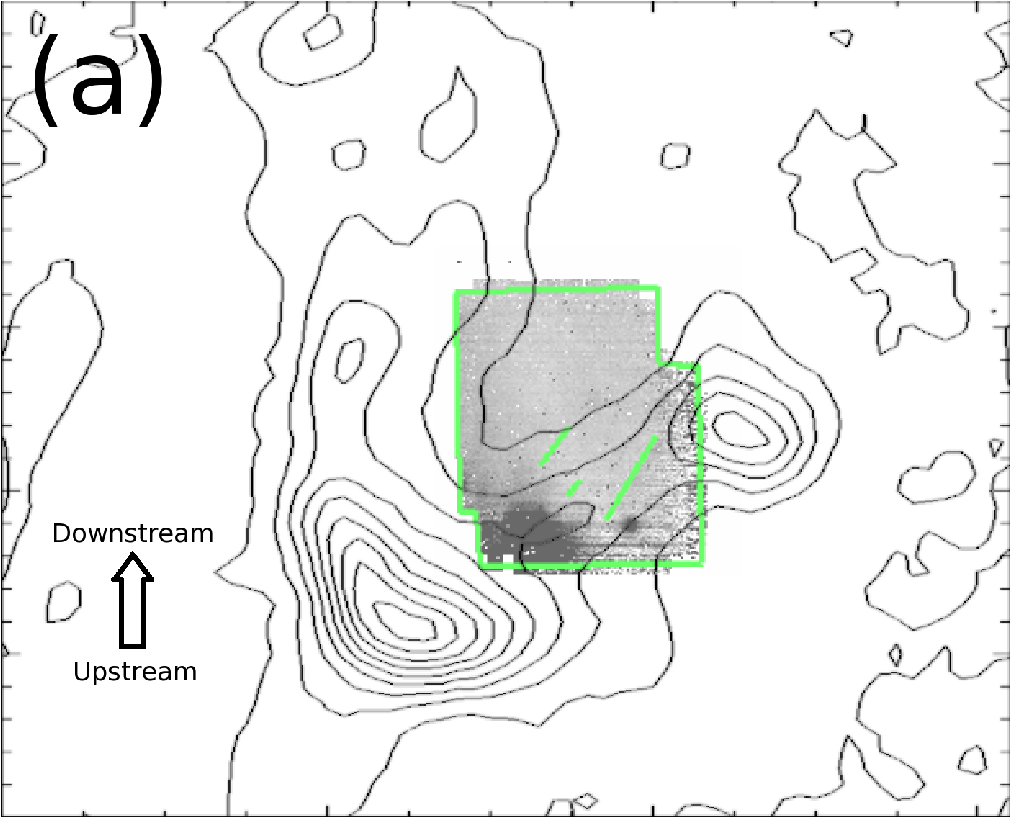
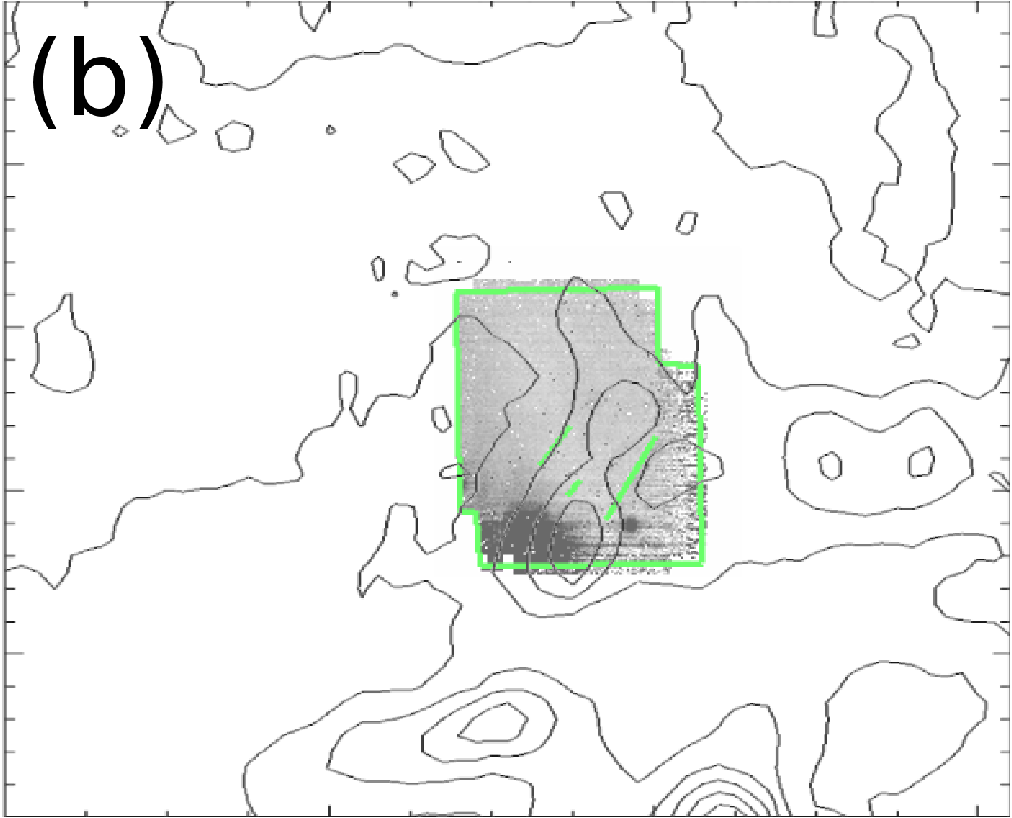
We overlap the position of the H regions on the H i contour using Galactic All-Sky Survey (GASS) Second Data Release (McClure-Griffiths et al., 2009; Kalberla et al., 2010)888http://www.astro.uni-bonn.de/hisurvey/ in Fig. 2. The regions D1–D3 lie on an overlap of two H i components at km s-1 and km s-1. We thus coadd the GASS data over two velocity ranges; km s-1 as the high velocity component(HVC), and km s-1 as the low velocity component(LVC).
In HVC map (Fig 2a), an H i cloud with a horseshoe like morphology is located at (73.5, -68) (Brüns et al., 2005), which is at the southeast of our observed field. The H i cloud is also recognized in the km s-1 panel of Fig. 6 of Putman et al. (2003a). They mentioned that filaments of MS appear to merge at several points, and there are dense concentrations of gas at these points. They listed the cloud at (l,b)=(74,-68) as an example of the merging points. The regions D1–D3 are located on this cloud. Spatial correspondence between D1–D3 and the H i cloud suggests that the H regions are associated with MS, and we regard them as candidates of H emitting regions of MS. The H i column density around the H regions are cm-2 from the contour by Brüns et al. (2005).
In LVC (Fig. 2b), there are two clouds around the edge of the filaments, and it is also possible that D1–D3 are associated with LVC. The H i column density around the H regions are cm-2.
6 Column density of the ionized gas
We roughly estimate the column density of the ionized gas. As the typical flux is 370 mR including [N ii], we adopt 300 mR for H flux in this section, assuming [N ii]/H (Ly et al., 2007) for simplicity. The value is a typical one for H ii regions, and it would be largely different if the ionization process is different, such as shocks. We assume that the H emitting region is a homogeneously distributed, optically thin gas cloud, and is embedded in an isotropic radiation field. For H, 1 Rayleigh corresponds to an emission measure (EM) of about 2 cm-6 pc(McCullough & Benjamin, 2001). Therefore the EM of D1–D3 is 0.6 cm-6 pc. The EM is written as
| (2) |
where is the electron density, and is the mean length of line of sight. The column density is then
| (3) |
It is about 1/21/8 of H i column density ( cm-2), if pc.
This rough calculation may overestimate the column density, because, in the real, the H surface brightness distribution is not homogeneous. In addition, the redshift and the degree of [N ii] contamination are unknown.
7 Comparison with model by B07
Since WW96 discovered the H emission from MS, several hypotheses have been proposed for the ionization mechanism of the H emitting gas. A promising theory would be the shock-induced model presented by B07. They suggested that the interaction between the fragmented clouds formed in the upstream of MS and the tenuous gas ablated from the upstream clouds would lead to shock ionization at the leading edges of the downstream clouds.
If the northwest cloud in Fig. 2a, which lies in the downstream of the main MS IV cloud at southeast, is following the main cloud, H would be emitted at the leading edge of the northwest cloud according to the B07 model. On the contrary, D1–D3 appear to lie along the H i stream between the northwest and the main clouds. Their straight and almost parallel filamentary morphology do not resemble the H distribution predicted by B07. However, note that the widths of D1–D3, pc, are smaller than the spatial resolution of the simulations ( pc) of B07. In addition, kpc scale structures of the H emission may be lost in this study due to our sky subtraction method (see Section 2). Thus, the spatial resolution mismatch between our observation and the B07 simulation may lead this apparent inconsistency in ionized gas morphology. The H regions we detected may be a part of dense ridges, which can be formed by Kelvin-Helmholtz instability at the H i cloud surface, of tenuously extended ionized clouds.
8 Possibility of Fossil Strömgren Trail
The long and straight shape of D1–D3 resembles the H filament reported by McCullough & Benjamin (2001, hereafter MB01). The MB01 cloud has a region of 20 arcsec wide and 1.2 degree long and forks into two segments with the widest separation of 5 arcmin.
MB01 presented four possible origins for such a cloud; 1) a jet, 2) a filamentary local nebula, 3) a shock ionized trail, and 4) a Fossil Strömgren Trail (FST), and they concluded their object would be FST. If D1–D3 are local objects, the origin of D1–D3 would be one of the four. Following the discussion by MB01, the faint SB rejects 1), and the straight shape and the intensity gradient along the shape reject 2), and 2 arcmin width rejects 3) as the D1–D3 origin. And 4), FST by a single star, is difficult, since the gradient has opposite direction in D1 and D3. If D1–D3 are local objects, the possible origin is that they are FSTs of different stars. All the three might be made by three different stars or by two stars if D2 is a branch of D1 or D3 like the Y-shaped filament found by MB01.
If D1–D3 are FSTs, we can estimate the distance using equation (5) of MB01. Putting I(H)obs=300 mR, width =2 arcmin, and the assumption by MB01 that projection factor =1, temperature T=K, and density n=1 cm-3, we can estimate that the distance is 180 pc. The physical size is 0.1pc wide and 0.3 – 1.5 pc long.
9 Summary
We detected three filamentary H emitting regions in the MS IV-D field. Their sizes are 2 arcmin wide and 6 – 30 arcmin long, and their surface brightness of H+[N ii] are 370 mR on average in 15 arcsec bin. They are candidates of H emitting regions associating with MS IV, although we cannot deny the possibility that they are local objects. If they are at MS distance, the size is 30 pc 100 – 500 pc. If they are local objects, Fossil Strömgren Trails (McCullough & Benjamin, 2001) created by more than two stars is a possible interpretation. Future spectroscopic follow-up will reveal whether they are a part of MS.
References
- Abazajian et al. (2009) Abazajian, K. N. et al. 2009, ApJS, 182, 543
- Bertin & Arnouts (1996) Bertin, E., Arnouts, S. 1996, A&AS, 117, 393
- Bland-Hawthorn & Maloney (1999) Bland-Hawthorn, J., Maloney, P.R. 1999, ApJ, 510, L33
- Bland-Hawthorn et al. (2007) Bland-Hawthorn, J., et al. 2007, ApJ, 670, L109(B07)
- Brüns et al. (2005) Brüns C. et al. 2005, A&A, 432, 45
- Fox et al. (2010) Fox, A.J., Wakker, B.P., Smoker, J.V., Richter, P., Savage, B.D, Sembach, K.R. 2010, ApJ, 718, 1046
- Finkbeiner (2003) Finkbeiner D. P. 2003, ApJS, 146, 407
- Gaustad et al. (2001) Gaustad, et al. 2001, PASP, 113, 1326
- Haffner et al. (2003) Haffner, L.M., Reynolds, R.J., Tufte, S.L., Madsen, G.J., Jaehnig, K.P., Percival, J.W. 2003, ApJS, 149, 405
- Itoh et al. (2001) Itoh, N. et al. 2001, Publ. Natl. Astron. Obs. Japan, 6, 41
- Kalberla et al. (2010) Kalberla, P.M.W., et al. 2010, A&A, 512, A17
- Ly et al. (2007) Ly, C. et al. 2007 ApJ, 657, 738
- Mathewson et al. (1974) Mathewson, D. S., et al. 1974, ApJ, 190, 291
- McCullough & Benjamin (2001) McCullough, P.R., Benjamin, R.A. 2001, AJ, 122, 1500
- McClure-Griffiths et al. (2009) McClure-Griffiths, N. M., et al. 2009, ApJS, 181, 398
- Mink (2002) Mink, D.J. 2002, in ASP Conf. Proc. 281. ADASS XI, ed. D.A. Bohlender, D. Durand, & T.H. Handley (San Francisco: ASP), 169
- Monet et al. (2003) Monet, D.G. et al. 2003, AJ, 125, 984
- Putman et al. (2003a) Putman, M.E., Staveley-Smith, L., Freeman, K.C., Gibson, B.K., Barnes, D.G. 2003a, ApJ, 586, 170
- Putman et al. (2003b) Putman, M.E., Bland-Hawthorn, J., Veilleux, S., Gibson, B.K., Freeman, K.C., Maloney, P.R. 2003b, ApJ, 597, 948
- Raynolds, et al. (1998) Raynolds, et al. 1998, PASA, 15, 14
- Schlegel et al. (1998) Schlegel, D. J., Finkbeiner, D. P. & Davis, M., 1998, ApJ, 500, 525
- Stanimirorović et al. (2008) Stanimirorović et al. 2008, ApJ, 680, 276
- Weiner & Williams (1996) Weiner, B.J., Williams, T.B. 1996, AJ, 111, 1156 (WW96)
- Weiner et al. (2001) Weiner, B.J., Vogel, S.N., Williams, T.B. 2001, in ASP Conf. Ser. 240, 515
- Yagi et al. (2002) Yagi, M., Kashikawa, N., Sekiguchi, M., Doi, M., Yasuda, N., Shimasaku, K., and Okamura, S., 2002, AJ, 123, 66
- Yagi et al. (2010) Yagi, M., et al. 2010, AJ, 140, 1814
- Zacharias et al. (2005) Zacharias, N., Monet, D.G., Levine, S.E., Urban, S.E., Gaume, R., and Wycoff, G.L. 2005, VizieR Online Data Catalog, 1297, 0
| filter | center | FWHM | v(H) | 1 SB |
|---|---|---|---|---|
| R | 6475Å | 1450Å | — | 27.4 mag arcsec-2 |
| N657 | 6577Å | 40Å | -265..+1563 km s-1 | 27.3 mag arcsec |
| Ha6577 | 6577Å | 85Å | -1294..+2592 km s-1 | 27.2 mag arcsec |
| Ha6417 | 6417Å | 85Å | -8608..-4722 km s-1 | 26.8 mag arcsec-2 |
| name | R.A.(J2000) | Dec.(J2000) | ||
|---|---|---|---|---|
| MS IV-D1 | 23:40:43 | -11:09:06 | 73.3891 | -66.9449 |
| MS IV-D2 | 23:40:13 | -11:19:40 | 72.8502 | -66.9864 |
| MS IV-D3 | 23:39:17 | -11:21:00 | 72.3947 | -66.8430 |