The effects of differential reddening and stellar rotation on the appearance of multiple populations in star clusters: the case of Trumpler 20
Abstract
We present a detailed analysis of the upper main sequence of the 1.3-Gyr old open cluster Trumpler 20. High accuracy photometry combined with the Very Large Telescope/FLAMES medium-resolution spectroscopy of 954 stars is essential to understanding the unusual appearance of the color–magnitude diagram (CMD), initially suggesting multiple populations in Trumpler 20. We show that differential reddening is a dominant contributor to the apparent splitting/widening of the main-sequence turnoff region. At its extreme, the excess differential reddening reaches while the adopted minimum reddening for the cluster is . A unique sample of measured projected rotational velocities indicates that stellar rotation is high near the main-sequence turnoff, reaching 180 km s-1. By dividing the upper main-sequence stars into equal groups of slow and fast rotators, we find that fast rotators have a marginal blueshift of , corresponding to a difference in the median of 60 km s-1 between these subsamples. We conclude that stellar rotation has an insignificant effect on the morphology of the upper main sequence of this intermediate-age open cluster. Trumpler 20 appears to contain a single coeval population of stars but there is evidence that the red clump is extended.
1 Introduction
A 1.3-Gyr old Galactic open cluster, Trumpler 20 (hereafter Tr 20; ) was first correctly characterized by Platais et al. (2008). Its basic properties such as age, distance, and reddening were later confirmed by Seleznev et al. (2010) and Carraro et al. (2010). These studies also indicate that the red clump of Tr 20 has a peculiar morphology; possibly, it is dual. In addition, the upper main sequence appears to show an enlarged color spread that is not normally seen in the color–magnitude diagram (CMD) for open clusters in this age group. This observational evidence hints at the now-popular conjecture of multiple stellar populations, suggested for a number of the Magellanic Cloud (MC) clusters (e.g., Mackey et al., 2008; Milone et al., 2009; Goudfrooij et al., 2009). Recent studies of rich intermediate-age (1–2 Gyr) star clusters in the Large Magellanic Cloud (LMC) indicate that their extended main-sequence turnoff (MSTO) regions can be described by continuous star formation, lasting 0.3 Gyr or longer (Goudfrooij et al., 2011; Rubele et al., 2011). This long period of star formation, however, seems to be at odds with the fact that none of the younger clusters are known to have such a trait. Alternative interpretations include, for example, stellar rotation effects (Bastian & de Mink, 2009) and interactions in binary systems (Yang et al., 2011). However, according to Girardi et al. (2011), stellar rotation is not a likely physical process to produce extended MSTO. Although extended star formation is generally accepted as the main factor in generating atypical CMDs for a number of MC star clusters, this scenario is based solely on interpretation of the photometric data. An exception is the analysis of chemical abundances in four intermediate-age LMC clusters (Mucciarelli et al., 2008). Among them, NGC 1783 is a star cluster with an extended MSTO (Goudfrooij et al., 2011); however, it lacks convincing anticorrelation in the Na–O and Mg–Al abundances, observed in the Galactic globular clusters with multiple populations (e.g., Gratton et al., 2011). This might be an indication that younger star clusters with extended MSTO may not experience self-enrichment.
The open cluster Tr 20 is important for two reasons: (1) if proven, it would be the first known open cluster with multiple stellar populations in the Milky Way; (2) the relative proximity of Tr 20 ( kpc) permits high-resolution spectroscopy of its upper main sequence. This provides the crucial observational data on projected rotational velocities, , which are scarce for the main-sequence stars of 1–2 Gyr old star clusters. Such data can be used to test theoretical predictions on the significance of stellar rotation on morphology of CMD. In this Letter, we discuss the results of high-accuracy photometry of Tr 20 combined with measured radial velocities and for the entire upper part of the cluster’s CMD. Detailed results of this study will be published elsewhere (I. Platais et al., in preparation).
2 Observational data
2.1 Photometry
The photometric CCD observations of Tr 20 were obtained on three observing runs in 2008–2009 at the CTIO 1.0 m telescope, operated by the Small and Moderate Aperture Research Telescope System (SMARTS) consortium. The instrumental setup included an STA CCD featuring 15 m pixels and covering a field of view of . Exposure times for Tr 20 ranged from 10 to 600 s. Each night a large number of Landolt’s standards (57–112) were frequently observed in order to assure the best possible calibration of instrumental magnitudes based upon empirical and field-variable point-spread function. Fringing in the sky background was substantial in the filter and was removed accordingly. The observed spread of extinction, color, and zeropoint terms in the transformations to the standard system indicates excellent photometric quality of the sky. The combined photometry for 96,156 stars covers a area down to with formal accuracies reaching 0.003 mag for optimally exposed stars.
2.2 VLT/FLAMES/GIRAFFE Spectroscopy
Spectroscopic observations444Based on observations collected at Paranal Observatory, ESO, program ID 083.D-0671(A). of Tr 20 were conducted in 2009 April–May using the Very Large Telescope (VLT)/FLAMES/GIRAFFE multi-object spectrograph in its MEDUSA mode, which can allocate up to 132 fibers over a circular field-of-view with a diameter of 25. The chosen high-resolution mode H525.8B offers resolution at the central wavelength of 5258 Å. Our sample of targets contains photometric cluster members selected from the cluster’s CMD over a field of from Platais et al. (2008). It includes the entire red giant branch (RGB), all possible subgiants, and the complete upper main sequence down to , equivalent to (F2–F5 V spectral type). The CMD of the observed stars is discussed in Section 3. A total of 954 stars were observed using nine fiber configurations, each taken with 1 hr of exposure time that resulted in signal-to-noise ratio (S/N) of 15–70 for the entire sample. Each target star was observed only once. Our goal was to maximize the number of main-sequence cluster members, while ignoring potential binaries and concentrating on likely single stars with radial velocities consistent with cluster membership.
The data were reduced using the GIRAFFE BaseLine Data Reduction Software (Blecha et al., 2000), which follows through the usual steps of spectroscopic reductions. In addition, we modeled the sky and subtracted it from the spectra of main-sequence stars.
2.2.1 Cross-correlating with Empirical Templates
Radial velocities and projected rotational velocities were first derived by cross-correlating the spectrum of each star with box-shaped-line digital templates, constructed from the high-resolution and high-S/N spectra (F0 V and K0 III, accordingly) of slowly rotating stars (e.g., Baranne et al., 1996). The cross-correlation function (CCF) was then fitted with a Gaussian whose parameters served in deriving and (Melo et al., 2001). These techniques work well for RGB stars, which have intrinsically low values, and for the main-sequence stars with km s-1. There is a hint that with increasing the radial velocities become biased, and for km s-1 this method often fails because the narrow noise peaks, significantly enhanced by relatively low S/N of our spectra, start to dominate the CCF (e.g., Galland et al., 2005). These shortcomings of the fixed-template techniques and the desire to measure higher cases prompted us to undertake a different approach.
2.2.2 Cross-correlating with Synthetic Spectra
To determine stellar atmospheric parameters and radial velocities, we used the Harvard-Smithsonian Center for Astrophysics (CfA) library of synthetic spectra, which covers the entire wavelength range of the GIRAFFE spectra. The present version of the library was calculated by John Laird for a grid of Kurucz model atmospheres (Kurucz, 2005), using a line list developed by Jon Morse. We broadened the library to match the actual instrumental resolution of the observed spectra, which we determined to be FWHM= by fitting the width of ThAr lines. Similar to the analysis in Carter et al. (2011), we cross-correlated each star against the grid of synthetic spectra with the IRAF task XCSAO and, using the normalized CCF peak heights at each grid point, we interpolated to the stellar parameters yielding the maximum correlation value. We assign errors of half the grid spacing — K in , – in (with smaller errors for slowly rotating stars), and dex in and [/H]. Spectroscopic determinations of , , and [/H] can be correlated, potentially causing systematic errors larger than the nominal errors quoted here, but constraining [/H] to equal the cluster metallicity can help to break that degeneracy. We used the red clump cluster members (see Section 3) to determine [/H] and then performed the interpolation again with the metallicity fixed. We also note, as hinted with the other techniques, that the radial velocities are redshifted in the amount of about per unit value.
3 Cluster membership and color–magnitude diagram
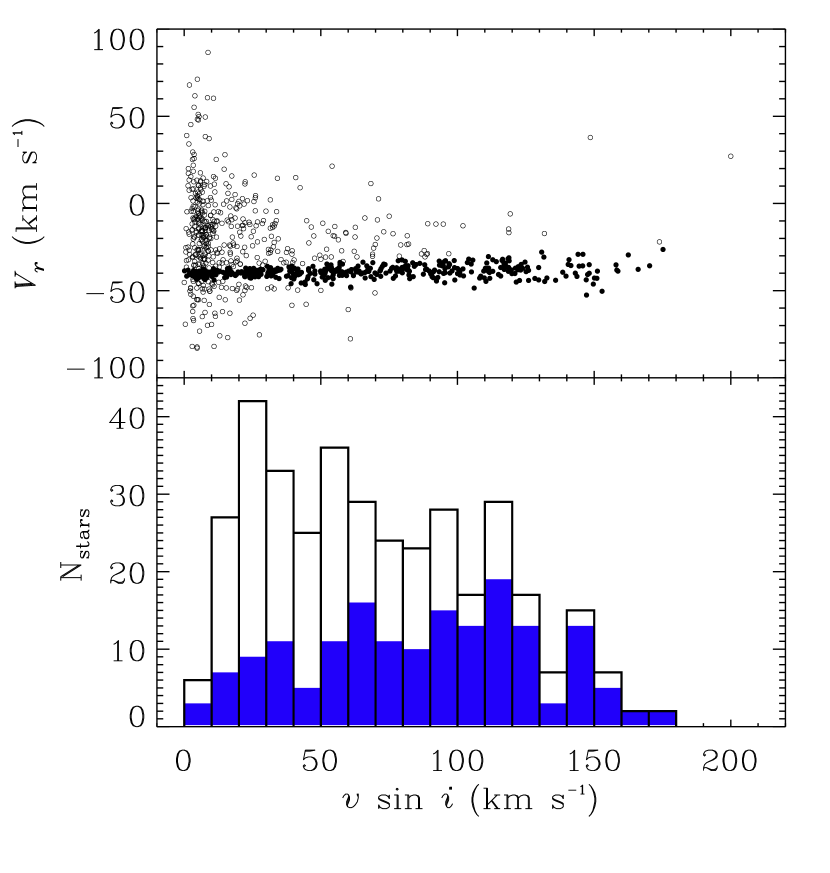
The CMD of Tr 20 shows a heavy contamination by field stars, mostly from the Carina spiral arm (Seleznev et al., 2010; Carraro et al., 2010; Platais et al., 2008). Our sample of nearly a thousand photometrically selected probable cluster members can now be cleaned up by using radial velocities. First, we examined radial velocities (see Section 2.2.1) of the red clump stars to derive the mean cluster velocity. A sample of 68 red clump stars yields km s-1 and is our adopted mean radial velocity for Tr 20. A similar estimate from radial velocities based upon synthetic templates gives km s-1. Second, we used and to select the probable kinematic cluster members (Figure 1). Our final sample of kinematic members of Tr 20 consists of 471 stars with a caveat that among them 50–100 stars (10%–20%), estimated by two different statistical methods (ad hoc analysis of distribution and a formal cluster membership calculation in the bins of ), can still be field stars, predominantly at km s-1.
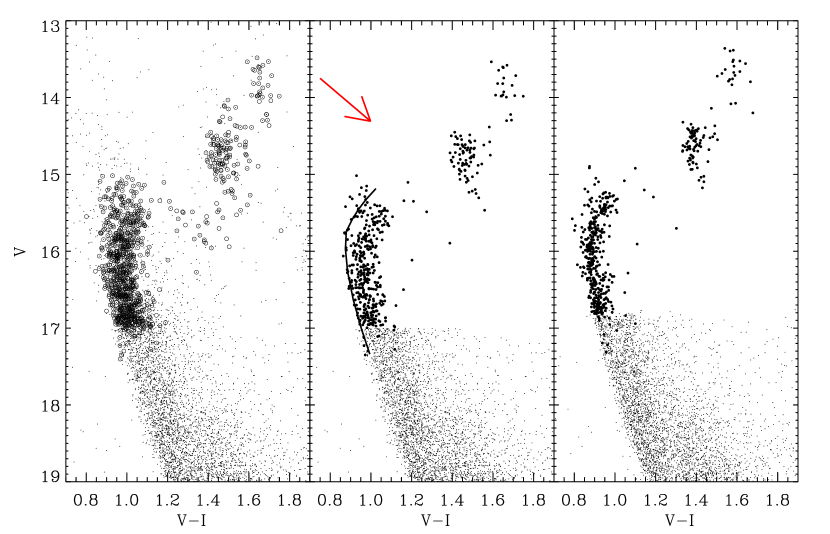
The CMD of our kinematic cluster-member sample (Figure 2) shows some intriguing features. In order to represent and interpret them, here we chose a CMD. First, the MSTO region appears to be split into two parts: a narrow but sparse blue sequence and a bulky redder one. We note that a split of the upper main sequence in Tr 20 is unusual compared to the CMDs of selected LMC star clusters (e.g., Goudfrooij et al., 2011), which all show a smooth and progressively widening MSTO toward the higher luminosities. Second, in the sense of a sequence, the RGB stars are difficult to identify. Essentially, there are only two distinct “blobs” of red stars. The most conspicuous one at represents the red clump, which appears to be significantly elongated along both axes. The second, at , represents the RGB clump, which is well matched by the isochrones (see Figure 4). Prior to interpreting these features, we first probed the cluster for signs of differential reddening (DR).
3.1 Differential Reddening
In CMDs of star clusters older than 1 Gyr, DR affects mostly the morphology of the MSTO region and the RGB including the red clump (e.g., Platais et al., 2011). Our approach in estimating DR is based on the assumption that there is an empirical blue envelope of the main sequence, indicating cluster stars with the lowest reddening as shown by the curve in Figure 2. This envelope conforms with the adopted youngest isochrone to the cluster’s CMD. Next, we partially de-reddened each main-sequence star (for Tr 20, down to ) so that they lie exactly on the blue envelope. A zero DR is adopted for a few probable cluster members bluer than this envelope. Thus, in our notation, DR is never negative. To mitigate the potential correlation between DR and the effects of stellar rotation, we used only the stars with km s-1 (a total of 237). A raw map of estimated DR (Figure 3) shows a distinct window of lower reddening in the NW corner of Tr 20, consistent with the Galactic reddening maps of Schlegel et al. (1998). The amount of DR is then smoothed on a grid of tangential coordinates at steps (Figure 3). At each grid point, the median DR is calculated from the nearest few measurements. The average size of a constant reddening patch (, equivalent to the eight nearest measures) was estimated by minimizing the color dispersion in the DR-corrected upper main sequence. After correcting for DR, there is a substantial improvement in the tightness of all the features in the CMD (Figure 2). DR is clearly the main reason for the unusual appearance of the observed CMD for Tr 20. The following isochrone fits to our photometric data indicate that the lowest reddening toward Tr 20 is for stars with , while the maximum amount of DR reaches 0.1 mag. This range of is consistent with the earlier estimates of reddening (Platais et al., 2008; Carraro et al., 2010). We note that the other effects such as unresolved or interacting binaries and rotation of stars may partially mimic the appearance of DR.
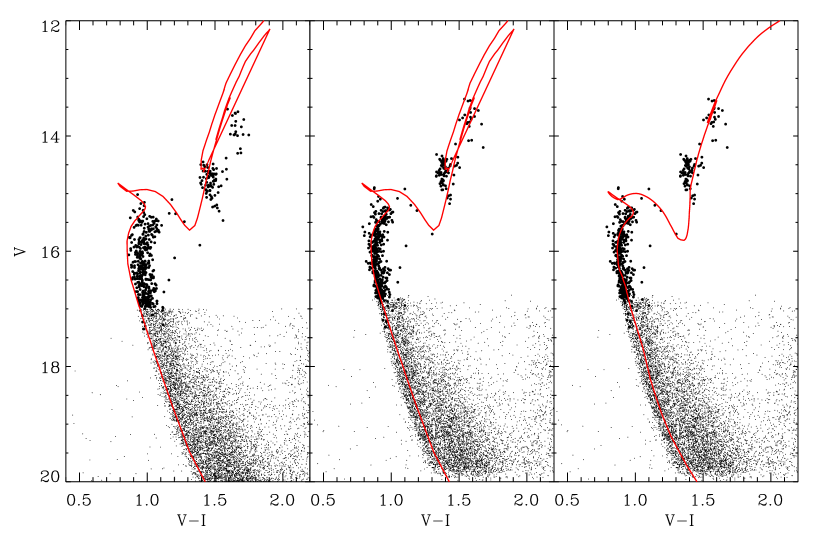
3.2 Isochrone Fitting
We used a set of Padova isochrones (Marigo et al., 2008) generated for the metal abundance of . The isochrones were reddened using the prescription of deriving a variable given in Fernie (1963) and Platais et al. (2008). In order to achieve a reasonable match of isochrones with the features of RGB, the parameter defined as =(Sp T)(B0) (Fernie, 1963) should be revised to . Reddening in bandpasses was translated to using the coefficients from Schlegel et al. (1998). Our best fit is achieved with a 1.3 Gyr isochrone and the true distance modulus =12.60 mag. The morphology of the DR-corrected red clump is unusual — it is substantially extended along the magnitude axis (), having its highest density at . There is a certain similarity to a double red clump of the SMC star cluster NGC 419; however, the lack of multiple populations in Tr 20 and, hence, the absence of the required 0.1 Gyr span of ages appears to weaken the hypothesis of non-degenerate He cores (Girardi et al., 2009).
We also used the isochrones from the Dartmouth Stellar Evolution Database (Dotter et al., 2008). A noted 0.2 Gyr age difference from the fit with Padova isochrones (Figure 4) is likely due to differences in the treatment of convective core overshoot and updated nuclear reaction rates, especially for the CNO cycle.
4 Stellar rotation
Roxburgh & Strittmatter (1965) were first to predict the effect of stellar rotation on the color and magnitude of a star, claiming that stellar rotation is essentially tantamount to reddening. Recently, Bastian & de Mink (2009) suggested that stellar rotation in stars with masses in the range 1.2–1.7 can mimic the effect of multiple populations in star clusters by shifting these stars to redder colors in the CMD. This proposition was contested by Girardi et al. (2011) on the grounds of evolutionary tracks for non-rotating and rotating stars. These authors conclude that stellar models with rotation appear to produce a modest blueshift in the CMD. Clearly, our data can provide a crucial test of these predictions.
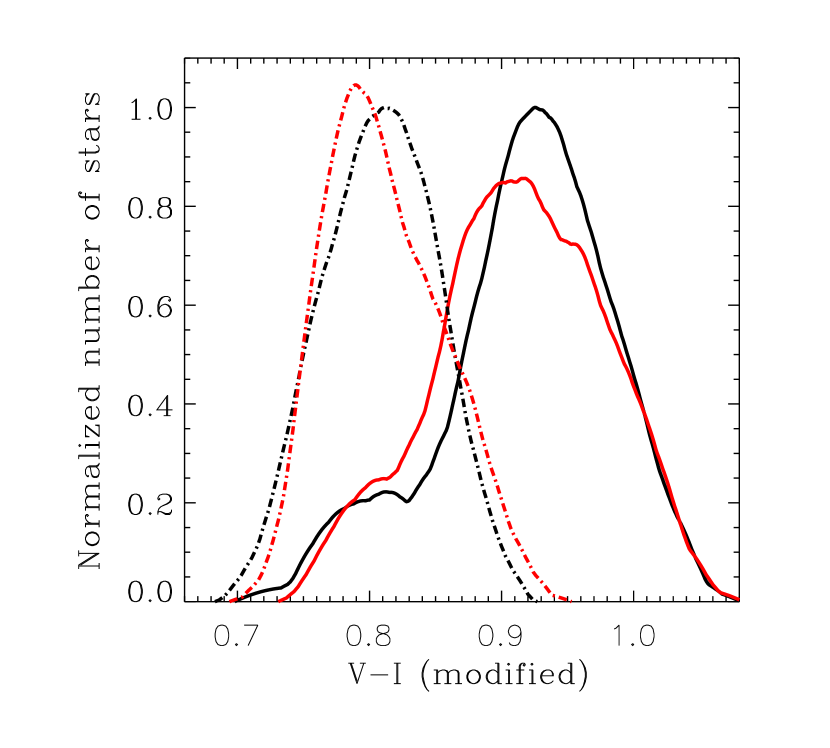
First, from the DR-corrected CMD we selected a sample of 168 upper main-sequence stars down to — the part of a CMD containing a relatively high fraction of fast rotators. Second, the CMD of this new sample was rotated around the point , in such a way that the magnitude axis becomes approximately parallel to the selected short segment of a 1.3 Gyr isochrone. The rms of the color distribution for the modified DR-corrected of these stars is 0.04 mag. The modified colors served as an argument in constructing the histograms of fast and slow rotators, divided into equal parts at km s-1. Similar to Goudfrooij et al. (2009), we used the nonparametric Epanechnikov-kernel probability density function to smooth the histograms, normalized relative to the maximum counts of slow rotators. The resulting color distributions are shown for two cases: using photometry “as is” and correcting it for DR (Figure 5). Our data show that at 1.3 Gyr and in the mass range of 1.5-1.8 stellar rotation produces a slight to zero blueshift of stars in the DR-corrected CMD: , , and . All median color differences are between the fast and slow rotators. This effect appears to be 1.3 to 3 times magnified in the DR-uncorrected and CMDs, accordingly, which can be attributed to a likely anticorrelation between the rotational blueshift and DR.
To validate these findings, we explored the likelihood of a chance blueshift in our sample. We constructed a synthetic cluster with all physical parameters close to those of our selection of Tr 20 members, particularly, the total number of stars on the main sequence and the pattern of DR. The only variable was a level of reddening “noise” added to the grid of median DR (Figure 3). From a 1000 realizations of a synthetic cluster, each time we randomly chose 168 stars and calculated the median color difference between the “fast” and “slow” rotators. In the absence of stellar rotation, the standard deviation of these median differences is and it is only weakly dependent on the level of the applied DR-noise. Thus, in a statistical sense the estimated color offset due to the stellar rotation is a result and agrees qualitatively with the theoretical predictions by Girardi et al. (2011).
Near the MSTO, a color offset for the 1.3 Gyr isochrone corresponds to an age shift of 20 Myr. Considering the median difference of 60 km s-1 between the slow and fast rotators and extrapolating it to the entire range of (180 km s-1), we obtain a tentative “dispersion” in isochrone ages of 60 Myr. This is only 15% of the deduced average spread of ages reported by Goudfrooij et al. (2011). We note that contamination of the slow-rotator sample by field stars and fast rotators at high inclination angles masquerading as slow rotators, can reduce the true color dispersion by 0.01 mag. Even accounting for this, the stellar rotation appears to have a marginal effect on the morphology of MSTO.
5 Conclusions
This study of the Galactic open cluster Tr 20 provides strong evidence that DR can mimic the appearance of multiple populations in star clusters. Despite some earlier indications, Tr 20 appears to contain a single coeval population of stars. Positions of the upper main-sequence stars in the CMD of Tr 20 are marginally dependent on their projected rotational velocities and in a specific way. Our data show that high stars are slightly blueshifted. Stellar rotation appears to play merely a minor role in the observed broadening of MSTO of this intermediate-age open cluster.
References
- Baranne et al. (1996) Baranne, A., Queloz, D., Mayor., et al. 1996, A&AS, 119, 373
- Bastian & de Mink (2009) Bastian, N., & de Mink, S. E. 2009, MNRAS, 398, L11
- Blecha et al. (2000) Blecha, A., Cayatte, V., North, P., Royer, F., & Simond, G. 2000, Proc. SPIE Conf., 4008, 467
- Carraro et al. (2010) Carraro, G., Costa, E., & Ahumada, J. A. 2010, AJ, 140, 954
- Carter et al. (2011) Carter, J. A., Fabrycky, D. C., Ragozzine, D., et al. 2011, Science, 331, 562
- Dotter et al. (2008) Dotter, A., Chaboyer, B., Jevremovic, D., et al. 2008, ApJS, 178, 89
- Fernie (1963) Fernie, J. D., 1963, AJ, 68, 780
- Galland et al. (2005) Galland, F., Lagrange, A.-M., Udry, S., et al. 2005, A&A, 443, 337
- Girardi et al. (2011) Girardi, L., Eggenberger, P., & Miglio, A. 2011, MNRAS, 412, L103
- Girardi et al. (2009) Girardi, L., Rubele, S., & Kerber, L. 2009, MNRAS, 394, L74
- Goudfrooij et al. (2009) Goudfrooij, P., Puzia, T. H., Kozhurina-Platais, V., & Chandar, R. 2009, AJ, 137, 4988
- Goudfrooij et al. (2011) Goudfrooij, P., Puzia, T. H., Kozhurina-Platais, V., & Chandar, R. 2011, ApJ, 737, 3
- Gratton et al. (2011) Gratton, R. G., Lucatello, S., Carretta, E., et al. 2011, A&A, 534, A123
- Kurucz (2005) Kurucz, R. L. 2005, Mem. Soc. Astron. Ital. Suppl, 8, 14
- Mackey et al. (2008) Mackey, A. D., Broby Nielsen, P., Ferguson, A. M. N., & Richardson, J. C. 2008, ApJ, 681, L17
- Marigo et al. (2008) Marigo, P., Girardi, L., Bressan, A., et al. 2008, A&A, 482, 883
- Melo et al. (2001) Melo, C. H. F., Pasquini, L., & De Medeiros, J. R. 2001, A&A, 375, 851
- Milone et al. (2009) Milone, A. P., Bedin, L. R., Piotto, G., & Anderson, J. 2009, A&A, 497, 755
- Mucciarelli et al. (2008) Mucciarelli, A., Carretta, E., Origlia, L., & Ferraro, F. R. 2008, AJ, 136, 375
- Platais et al. (2011) Platais, I., Cudworth, K. M., Kozhurina-Platais, V., et al. 2011, ApJ, 731, L1
- Platais et al. (2008) Platais, I., Melo, C., Fulbright, J. P., et al. 2008, MNRAS, 391, 1482
- Roxburgh & Strittmatter (1965) Roxburgh, I. W., & Strittmatter, P. A. 1965, Z. Astrophys., 63, 15
- Rubele et al. (2011) Rubele, S., Girardi, L., Kozhurina-Platais, V., Goudfrooij, P., & Kerber, L. 2011, MNRAS, 414, 2204
- Schlegel et al. (1998) Schlegel, D. J., Finkbeiner, D. P., & Davis, M. 1998, ApJ, 500, 525
- Seleznev et al. (2010) Seleznev, A. F., Carraro, G., Costa, E., & Loktin, A. V. 2010, New Astron., 15, 61
- Yang et al. (2011) Yang, W., Meng, X., Bi, S., et al. 2011, ApJ, 731, L37