An efficient strategy to suppress epidemic explosion in heterogeneous metapopulation networks
Abstract
We propose an efficient strategy to suppress epidemic explosion in heterogeneous metapopulation networks, wherein each node represents a subpopulation with any number of individuals and is assigned a curing rate that is proportional to with the node degree and an adjustable parameter. We have performed stochastic simulations of the dynamical reaction-diffusion processes associated with the susceptible-infected-susceptible model in scale-free networks. We found that the epidemic threshold reaches a maximum when the exponent is tuned to be . This nontrivial phenomenon is robust to the change of the network size and the average degree. In addition, we have carried out a mean field analysis to further validate our scheme, which also demonstrates that epidemic explosion follows different routes for larger or less than . Our work suggests that in order to efficiently suppress epidemic spreading on heterogeneous complex networks, subpopulations with higher degrees should be allocated more resources than just being linearly dependent on the degree .
pacs:
89.75.Hc, 89.20.-a, 89.75.Fb, 87.23.GeI Introduction
In the last two decades, we have witnessed dramatic advances in complex networks research, which has been one of the most active topics in statistical physics and closely related disciplines Albert and Barabási (2002); Dorogovtsev and Mendes (2002); Newman (2003). The central issue in this field is to study how the network topology influences the dynamics Boccaletti et al. (2006); Arenas et al. (2008); Dorogovtsev et al. (2008). As one of the typical dynamical processes built on complex networks, epidemic spreading has attracted more and more significant attention Pastor-Satorras and Vespignani (2001a, b); Boguñá and Pastor-Satorras (2002); Boguñá et al. (2003); Barthélemy et al. (2004); May and Lloyd (2001); Lloyd and May (2001); Moreno et al. (2002, 2003); Joo and Lebowitz (2004); Olinky and Stone (2004); Liu and Hu (2005); Yan et al. (2007); Castellano and Pastor-Satorras (2010); Kitsak et al. (2010); Masuda (2010); Neri et al. (2011); Belik et al. (2011). Despite much effort, many aspects of its role in the case of metapopulation models are still unclear and deserve more investigation.
Very recently, metapopulation dynamics on heteregeneous networks, which incorporate mobility over the nodes, local interaction at the nodes, and a complex network structure, has gained great research attention Colizza et al. (2007); Colizza and Vespignani (2007, 2008); Gautreau et al. (2008); Baronchelli et al. (2008); Wang et al. (2009); Belik et al. (2011); Kondo and Miura (2010); Nakamasu et al. (2009); Lizana et al. (2009); Grzybowski (2009); Xuan et al. (2010); Balcan and Vespignani (2012); Barthélemy (2011); Nicosia et al. (2011); Moilanen et al. (2009); Balcan and Vespignani (2011); Vespignani (2012); Nakao and Mikhailov (2010). In this context, reaction-diffusion (RD) processes have been widely used to model phenomena as diverse as epidemic and computer viruses spreading Colizza et al. (2007); Colizza and Vespignani (2007, 2008); Gautreau et al. (2008); Baronchelli et al. (2008); Wang et al. (2009); Belik et al. (2011), biological pattern formation Kondo and Miura (2010); Nakamasu et al. (2009), chemical reactions Lizana et al. (2009); Grzybowski (2009); Xuan et al. (2010), population evolution Balcan and Vespignani (2012), and many other spatially distributed systems Barthélemy (2011); Nicosia et al. (2011); Moilanen et al. (2009); Balcan and Vespignani (2011). In a series of important papers, Colizza et al. Colizza et al. (2007) provided an analysis of the basic RD process of the susceptible-infected-susceptible () model defined on heterogeneous metapopulation networks. Therein, each network node represents an urban area together with its population and edges represent air travel fluxes along which individuals diffuse, coupling the epidemic spreading in different urban areas. They paid particular attention to the epidemic threshold , and found that is strongly affected by the topological fluctuations of the network for diffusing susceptible individuals. Later, Balcan and Vespignani Balcan and Vespignani (2011) extended such analysis to non-Markovian diffusive processes on complex networks, wherein individuals have a memory of their location of origin and displaced individuals return to their original subpopulation with a certain rate. Very recently, Vespignani Vespignani (2012) reviewed and highlighted some of the recent progress in modelling dynamical processes that integrates the complex features and heterogeneities of real-world systems. Nevertheless, all the studies so far have treated the curing rate as a homogenous parameter, i.e., it is not dependent on the local property of the network node, such as the degree . Note, however, in reality the curing rate of individuals should certainly be associated with the available medical resources in the local subpopulation, i.e., it is reasonable to assume that is a function of the degree . It is therefore interesting to ask: how would the metapopulation dynamics of the model, for instance, the epidemic threshold , depend on such a -dependent curing strategy? The answer to this question may provide useful instructions regarding the control of epidemic explosion in metapopulation networks.
In the present paper, we have addressed such a question by considering a simple strategy, , where denotes the node degree and is an adjustable parameter. If , one recovers the usual cases studied in previous works. Herein, we mainly focus on the influence of varying on . Interestingly, we found that bypasses a clear-cut maximum at a certain , which corresponds to an optimal strategy to suppress epidemic explosion. This observation along with the value of is robust to the change of the network size and the average network degree. To place the finding on a solid foundation, we have also performed a mean field (MF) analysis, wherein is identified as the onset point where the global healthy state with no infected individuals loses stability. The MF equations successfully reproduce the dependences, and also provide more insights regarding the routes to epidemic explosion for different values of .
II Model Description
We consider a system of distinct subpopulations, each corresponding to a network node. Individuals inside each node run stochastically through the paradigmatic model Daley and Gani (1999); Hethcote (2000); Murray (2002). Schematically, the stochastic infection dynamics is given by:
| (1) |
The first reaction reflects the fact that each susceptible individual becomes infected upon encountering one or more infected individuals at a probability rate . The second indicates that infected individuals are cured and become again susceptible at a -dependent rate . Inside each network node, reaction processes take place under the assumption of a homogenous mixing and conserving the total number of individuals. After the reaction, individuals randomly diffuse along the edges departing from its local node.
In this model, a significant and general result is that the system undergoes an absorbing-state phase transition with density increasing, in analogy with critical phenomena Dorogovtsev et al. (2008). Here is defined as the total number of individuals divided by the number of network nodes. The critical density indicates the epidemic threshold, what we are interested in.
To begin, we perform our strategy on scale-free (SF) networks by using the Barabási–Albert (BA) model Barabási and Albert (1999) with power-law degree distribution . Scale-free networks are much more heterogeneous and serve as better candidates to test our strategy than other homogeneous networks, such as small-world or random networks. For a node with degree , the curing rate is given by
| (2) |
Herein, is normalized such that the average curing rate remains constant: . Note that in other related works about epidemic dynamics on networks , a -dependent strategy, but associated with the infection rate, had also been consideredNewman (2002); Olinky and Stone (2004).
The system evolves in time according to the following rules Colizza et al. (2007). The dynamics proceeds in parallel and considers a discrete time step representing the fixed time scale of the process. The reaction and diffusion rates are therefore converted into probabilities. At each time step, the system is updated as follows. Inside each network node with degree , each infected individual is cured and becomes an susceptible one with probability . At the same time, each susceptible individual acquires infection from any infected one with probability , where is the total number of infected individuals in the node. After all nodes have been updated for the reactions, diffusion processes take place by allowing each individual to move into a randomly chosen neighboring node with probability and , for infected and susceptible individuals respectively, where denotes the corresponding diffusion constant. In our simulation, the parameters are , , , if not otherwise specified. Each plot is obtained via averaging over 20 independent simulation runs.
III Simulation results
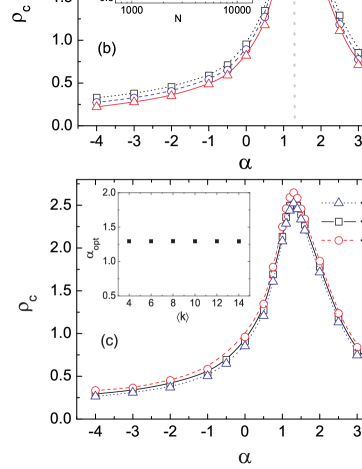
Fig.1(a) shows how the proportion of infected individuals in the whole network increases with , where denotes the density of infected individuals in the whole network, for four different values of . Clearly, the system undergos a phase transition at a certain threshold density , above which monotonically increases from zero. For , the system stays in a ‘healthy’ state with . Interestingly, reaches a largest value for =1.3, compared to those for =0, 1.0, 2.0. This is demonstrated more clearly in Fig.1 (b), where are plotted as a function of for different network sizes . The distinct peak locates at , which is rather robust to the change of network size as shown in the inset. In addition, we have also investigated how this phenomenon depends on the average network degree . As shown in Fig.1 (c), the optimal value also remains nearly constant with varying from 4 to 14.
So far we have considered that all species diffuse with the same rate. In the following, we will take into account different diffusion rates for different species. For the sake of simplicity, we assume that infected individuals diffuse with a fixed rate and vary the diffusion rate of susceptible individuals . The epidemic threshold as a function of is plotted in Fig.2 for , and . Interestingly, the bell-shape dependence of on always exists for nonzero , with the peak located at nearly the same optimal value . The height of this peak decreases with , and eventually is independent of for .
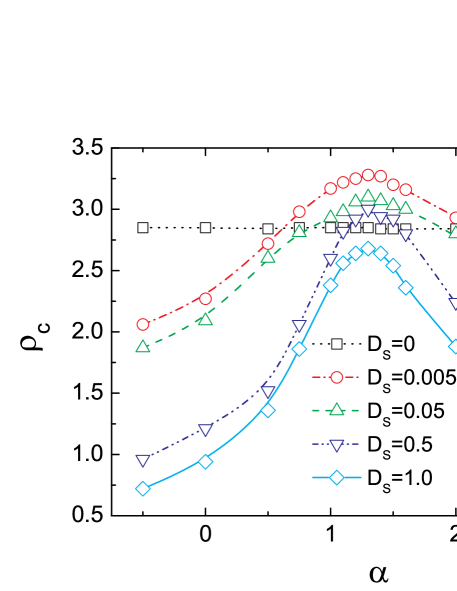
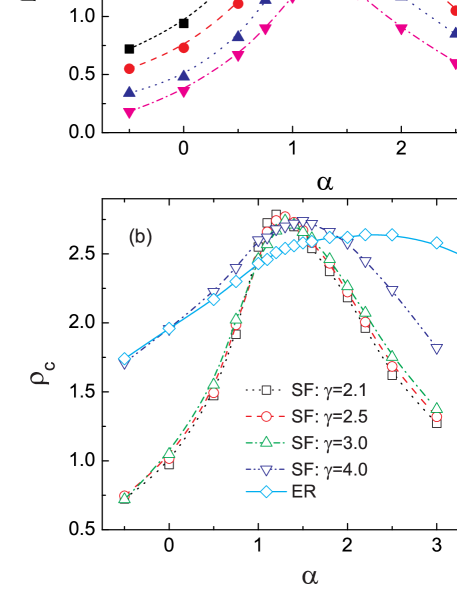
Fig. 3(a) shows that as a function of for different infection rates . It can be found that the values of do not influence the qualitative dependence of on , i.e., a maximum still shows up for the same optimal . Nevertheless, the maximum corresponding to do change with . In addition, we have also considered how the above findings depend on the network topology. To this end, we have performed simulations on SF networks with different exponents and Erdös-Rényi (ER) random networks. as a function of for different type of networks are shown in Fig.3(b). It is found that there still exists an optimal value of , leading to the maximal threshold. For SF networks, the optimal value of is always close to , while for ER networks, the curve becomes not so sharp indicating that is not sensitive to the change of .
IV Mean field analysis
According to the stochastic simulation scheme, one may write down the following set of dynamic equations at a MF level,
| (3a) | |||
| (3b) | |||
where and represent the average densities of infected and susceptible individuals, respectively, in the nodes with degree . The first term in the right hand side of Eq.(3a) accounts for the change of infected individuals due to the reaction (infection and recovery) processes, and the second term accounts for the diffusion of infected individuals into and out of those nodes with degree . Eq.(3b) can be interpreted in a similar manner. represents the conditional probability that a node of degree is connected to a node of degree , which equals to Pastor-Satorras et al. (2001); Dorogovtsev and Mendes (2003) for BA networks.
One notes that a thorough analysis of Eqs.(3) is not easy. For sake of simplicity, here we only consider the case . Then, substituting this into Eqs.(3) and using , one obtains
| (4a) | |||
| (4b) | |||
For and thus , it is already shown that Colizza et al. (2007). But for , it is hard to get the explicit expression of from Eqs.(4) directly. Clearly, Eqs.(4) admit a steady state, which solves ,
| (5) |
which physically corresponds to the disease-free state. Intuitively, this healthy state will lose stability at the critical density , above which the steady state value of cannot be 0 any more. Therefore, one can alternatively perform linear stability analysis of to get . Following standard procedures, one can readily obtain the Jacobian matrix and calculate the eigenvalues . The healthy state will lose stability when , the largest value of the real part of the eigenvalues, passes through zero from below. Note that explicit expression for is not available, but numerical calculation of it is easy.
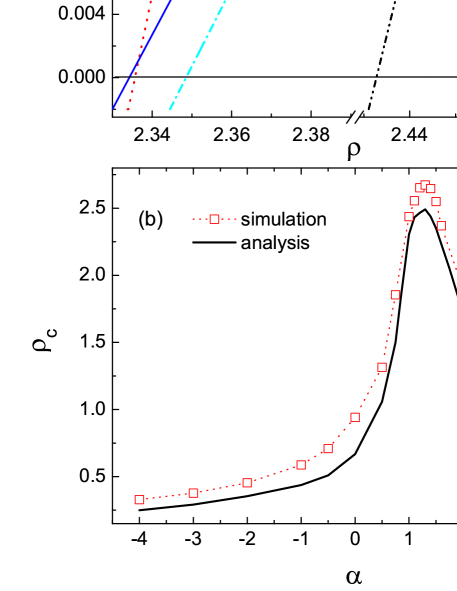
Fig. 4 (a) plots as a function of for several values of . The value of where the corresponds to . As expected, is the largest for compared to those for other . Fig. 4 (b) presents as a function of obtained from simulations (symbols) and MF analysis (solid line). Apparently, the MF results are in rather good agreements with the simulation ones in Fig.1.
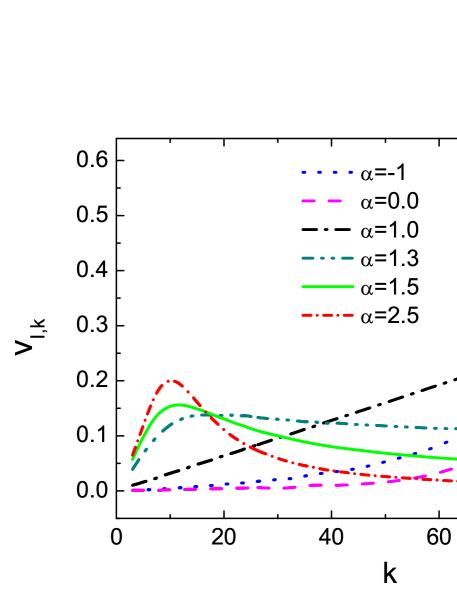
To get more insights into how the epidemic explosion takes place for different , we turn to the eigenvector corresponding to at the onset of the phase transition, i.e., . The element of this vector measures the relative amplitude of the fluctuation away from for nodes with given degree . Therefore, the dependence of on qualitatively tells us how the epidemic explosion grows from the healthy state. In Fig. 5, we depict the eigenvectors as a function of for different . Interestingly, it can be observed that epidemic explosion starts from large-degree nodes for less than , as shown by the “dotted”, “dashed” and “dash dotted” lines in Fig.5, while it is from small-degree nodes for larger than , as shown by “solid” and “short dash dotted” lines. For , is not that sensitive on , indicating a relatively homogenous epidemic explosion.
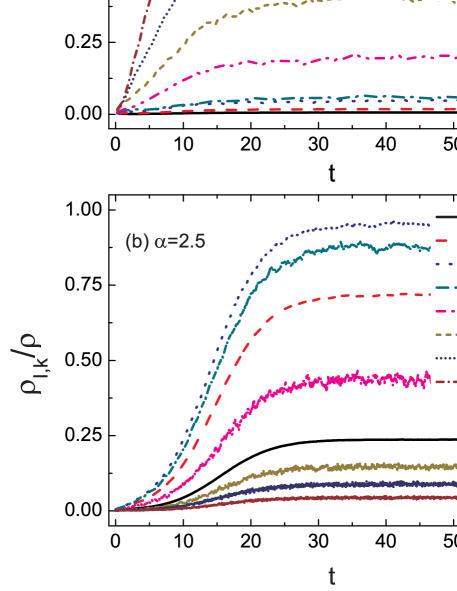
To reveal the underlying mechanism of the epidemic spreading for different in more detail, we illustrate the time evolution of , the average density of infected individuals in the nodes with degree in Fig. 6 for two particular values of , one () less than and the other () larger than it. This can give us more detailed information about how the epidemic outbreak takes place on nodes with different degree . We find that, for , the disease starts to spread from large-degree nodes, such as =88, 75 and 60, as shown by the top three lines in Fig. 6(a); while for , the spreading starts from those nodes with relatively small degree, such as =12, 17 and 8, as shown in Fig. 6(b). These phenomena indicate that there indeed exist two different epidemic explosion routes for being less or larger than , which are consistent with the analysis associated with the eigenvectors as shown in Fig.5.
The above different pathways regarding small or large may be illustrated qualitatively in the following way. Consider the individuals in a given node are infected at the beginning. These patients will diffuse to neighboring nodes through the links. Certainly, nodes with larger degrees will have more chances to accept these patients. To efficiently suppress the epidemic explosion, the curing rates in such large-degree nodes should be relatively large to compensate these incoming patients via diffusion. Therefore, it is reasonable that should be an increasing function of to maintain an effective epidemic control. Intuitively, one may imagine that the most efficient way is to keep linear dependence of on , i.e., in our strategy, considering that every incoming patient via diffusion can be cured on time. However, this is not exactly the case because the reactions inside a node involve nonlinear autocatalytic processes, which makes larger than 1 (Unfortunately, why is so robust to be about 1.3 is still open to us). If is too large, which means that the medical resources are biased to large-degree nodes, the patients in small-degree nodes cannot be cured on time. In this case, disease will start to spread from those small-degree nodes. In the contrast case, the disease will start more abruptly from those large-degree nodes since the curing rates there are too smaller than required. These scenario are in agreement with the picture shown in Fig. 5 and 6.
V Discussion and Conclusions
One should note that the value can not be arbitrary for the real world, if we accept the power-law dependence. Following the recipe of Eq.2, for a scale free network with minimum, mean and maximum degree respectively of 2, 5 and 100, the recovery rate will range from 0.4 to 20 in the simplest case of linear dependency (). This large difference is to some extent not reasonable, which implies that the optimal control with is hard to be realized practically. Nevertheless, as a model study, we can just change as we want to see what we can find. If, for instance, we tune to a reasonable non-zero value, say , the ratio of the maximal and minimal would be about 10 for a network with ranging from 1 to 100, which can also lead to a much better epidemic control () than previous case of (). Therefore, our work has indeed provided an efficient strategy to suppress the epidemic explosion.
In summary, we have studied a variant of model defined on scale-free metapopulation networks, wherein the curing rate in a node with degree is proportional to . By detailed numerical simulations, we show that the epidemic threshold reaches a maximum value when is tuned to be , which corresponds to an optimal control strategy to suppress epidemic explosion and is robust to the change of network size or average degree. We have also performed a mean field analysis to further elucidate this strategy and unravel the distinct pathways to epidemic spreading for larger or less than . Our findings suggest that a proper allocation of medical resources can best suppress the epidemic explosion, which could be of great importance in practical epidemic control.
Acknowledgements.
This work was supported by the National Natural Science Foundation of China (Grant Nos.21125313, 20933006 and 91027012). C.S.S was also supported by the Key Scientific Research Fund of Anhui Provincial Education Department (Grant No. KJ2012A189).References
- Albert and Barabási (2002) R. Albert and A.-L. Barabási, Rev. Mod. Phys. 74, 47 (2002).
- Dorogovtsev and Mendes (2002) S. N. Dorogovtsev and J. F. F. Mendes, Adv. Phys. 51, 1079 (2002).
- Newman (2003) M. E. J. Newman, SIAM Review 45, 167 (2003).
- Boccaletti et al. (2006) S. Boccaletti, V. Latora, Y. Moreno, M. Chavez, and D.-U. Hwang, Phys. Rep. 424, 175 (2006).
- Arenas et al. (2008) A. Arenas, A. Díaz-Guilera, J. Kurths, Y. Moreno, and C. Zhou, Phys. Rep. 469, 93 (2008).
- Dorogovtsev et al. (2008) S. N. Dorogovtsev, A. V. Goltsev, and J. F. F. Mendes, Rev. Mod. Phys. 80, 1275 (2008).
- Pastor-Satorras and Vespignani (2001a) R. Pastor-Satorras and A. Vespignani, Phys. Rev. Lett. 86, 3200 (2001a).
- Pastor-Satorras and Vespignani (2001b) R. Pastor-Satorras and A. Vespignani, Phys. Rev. E 63, 066117 (2001b).
- Boguñá and Pastor-Satorras (2002) M. Boguñá and R. Pastor-Satorras, Phys. Rev. E 66, 047104 (2002).
- Boguñá et al. (2003) M. Boguñá, R. Pastor-Satorras, and A. Vespignani, Phys. Rev. Lett. 90, 028701 (2003).
- Barthélemy et al. (2004) M. Barthélemy, A. Barrat, R. Pastor-Satorras, and A. Vespignani, Phys. Rev. Lett. 92, 178701 (2004).
- May and Lloyd (2001) R. M. May and A. L. Lloyd, Phys. Rev. E 64, 066112 (2001).
- Lloyd and May (2001) A. L. Lloyd and R. M. May, Science 292, 1316 (2001).
- Moreno et al. (2002) Y. Moreno, R. Pastor-Satorras, and A. Vespignani, Eur. Phys. J. B 26, 521 (2002).
- Moreno et al. (2003) Y. Moreno, J. B. Gómez, and A. F. Pacheco, Phys. Rev. E 68, 035103 (2003).
- Joo and Lebowitz (2004) J. Joo and J. L. Lebowitz, Phys. Rev. E 69, 066105 (2004).
- Olinky and Stone (2004) R. Olinky and L. Stone, Phys. Rev. E 70, 030902(R) (2004).
- Liu and Hu (2005) Z. Liu and B. Hu, Europhys. Lett. 72, 315 (2005).
- Yan et al. (2007) G. Yan, Z.-Q. Fu, J. Ren, and W.-X. Wang, Phys. Rev. E 75, 016108 (2007).
- Castellano and Pastor-Satorras (2010) C. Castellano and R. Pastor-Satorras, Phys. Rev. Lett. 105, 218701 (2010).
- Kitsak et al. (2010) M. Kitsak, L. K. Gallos, S. Havlin, F. Liljeros, L. Muchnik, H. E. Stanley, and H. A. Makse, Nature Phys. 8, 888 (2010).
- Masuda (2010) N. Masuda, New J. Phys. 12, 093009 (2010).
- Neri et al. (2011) F. M. Neri, A. Bates, W. S. Füchtbauer, F. J. Pérez-Reche, S. N. Taraskin, W. Otten, D. J. Bailey, and C. A. Gilligan, PLoS Comput. Biol. 7, e1002174 (2011).
- Belik et al. (2011) V. Belik, T. Geisel, and D. Brockmann, Phys. Rev. X 1, 011001 (2011).
- Colizza et al. (2007) V. Colizza, R. Pastor-Satorras, and A. Vespignani, Nature Phys. 3, 276 (2007).
- Colizza and Vespignani (2007) V. Colizza and A. Vespignani, Phys. Rev. Lett. 99, 148701 (2007).
- Colizza and Vespignani (2008) V. Colizza and A. Vespignani, J. Theor. Biol. 251, 450 (2008).
- Gautreau et al. (2008) A. Gautreau, A. Barrat, and M. Barthélemy, J. Theor. Biol. 251, 509 (2008).
- Baronchelli et al. (2008) A. Baronchelli, M. Catanzaro, and R. Pastor-Satorras, Phys. Rev. E 78, 016111 (2008).
- Wang et al. (2009) P. Wang, M. C. González, C. A. Hidalgo, and A.-L. Barabási, Science 324, 1071 (2009).
- Kondo and Miura (2010) S. Kondo and T. Miura, Science 329, 1616 (2010).
- Nakamasu et al. (2009) A. Nakamasu, G. Takahashi, A. Kanbe, and S. Kondo, Proc. Natl. Acad. Sci. U.S.A. 106, 8429 (2009).
- Lizana et al. (2009) L. Lizana, Z. Konkoli, B. Bauer, A. Jesorka, and O. Orwar, Annu. Rev. Phys. Chem. 60, 449 (2009).
- Grzybowski (2009) B. A. Grzybowski, Chemistry in Motion: Reaction-Diffusion Systems for Micro- and Nanotechnology (Wiley, Chichester, West Sussex, 2009).
- Xuan et al. (2010) Q. Xuan, F. Du, T.-J. Wu, and G. Chen, Phys. Rev. E 82, 046116 (2010).
- Balcan and Vespignani (2012) D. Balcan and A. Vespignani, J. Theor. Biol. 293, 87 (2012).
- Barthélemy (2011) M. Barthélemy, Phys. Rep. 499, 1 (2011).
- Nicosia et al. (2011) V. Nicosia, F. Bagnoli, and V. Latora, Europhys. Lett. 94, 68009 (2011).
- Moilanen et al. (2009) A. Moilanen, K. Wilson, and H. Possingham, Spatial conservation prioritization (Oxford University Press, London, 2009).
- Balcan and Vespignani (2011) D. Balcan and A. Vespignani, Nature Phys. 7, 581 (2011).
- Vespignani (2012) A. Vespignani, Nature Phys. 8, 32 (2012).
- Nakao and Mikhailov (2010) H. Nakao and A. S. Mikhailov, Nature Phys. 6, 544 (2010).
- Daley and Gani (1999) D. J. Daley and J. Gani, Epidemic Modelling (Cambridge University Press, Cambridge, 1999).
- Hethcote (2000) H. W. Hethcote, SIAM Rev. 42, 599 (2000).
- Murray (2002) J. D. Murray, Mathematical Biology (Springer-Verlag, Berlin, 2002).
- Barabási and Albert (1999) A.-L. Barabási and R. Albert, Science 286, 509 (1999).
- Newman (2002) M. E. J. Newman, Phys. Rev. E 66, 016128 (2002).
- Pastor-Satorras et al. (2001) R. Pastor-Satorras, A. Vázquez, and A. Vespignani, Phys. Rev. Lett. 87, 258701 (2001).
- Dorogovtsev and Mendes (2003) S. N. Dorogovtsev and J. F. F. Mendes, Evolution of Networks: From Biological Nets to the Internet and WWW (Oxford Univ. Press, Oxford, 2003).