Wüstite: Electric, thermodynamic and optical properties of FeO
Abstract
We report on a systematic optical investigation of wüstite. In addition, the sample under consideration, Fe0.93O, has been characterized in detail by electrical transport, dielectric, magnetic and thermodynamic measurements. From infrared reflectivity experiments, phonon properties, Drude-like conductivity contributions and electronic transitions have been systematically investigated. The phonon modes reveal a clear splitting below the antiferromagnetic ordering temperature, similar to observations in other transition-metal monoxides and in spinel compounds which have been explained in terms of a spin-driven Jahn-Teller effect. The electronic transitions can best be described assuming a crystal-field parameter = 750 cm-1 and a spin-orbit coupling constant = 95 cm-1. A well defined crystal field excitation at low temperatures reveals significant broadening on increasing temperature with an overall transfer of optical weight into dc conductivity contributions. This fact seems to indicate a melting of the on-site excitation into a Drude behavior of delocalized charge carriers. The optical band gap in wüstite is close to 1.0 eV at room temperature. With decreasing temperatures and passing the magnetic phase transition we have detected a strong blue shift of the correlation-induced band edge, which amounts more than 15% and has been rarely observed in antiferromagnets.
1 Introduction
Transition metal (TM) monoxides are prototypical examples of strongly correlated electron systems. Their electronic structure results from a competition between electron localization and delocalization effects in the narrow 3 bands, as formulated in the theory of Mott Mott1949 and Hubbard Hubbard1964 . Numerous theoretical and experimental papers about this subject and specifically concerning TM monoxides have been published aiming to explain the insulating properties of the late monoxides and calculating the quasiparticle band structure and the density of states. An exception is wüstite (FeO), which has been far less investigated. This probably stems from the fact that stoichiometric FeO does not exist at room temperature. It is metastable with the tendency to decay into a two-phase mixture of -Fe and magnetite Fe3O4. However, it is well known that cubic Fe1-δO can be synthesized at ambient pressure for iron deficiencies ranging approximately from 0.05 0.15:
Nonstoichiometric wüstite crystallizes in the cubic rocksalt structure and reveals antiferromagnetic (AFM) order below the Néel temperature 200 K. Early reports on antiferromagnetism of FeO with ordering temperatures between 183 K and 198 K have been published by Millar Millar1929 , Bizette and Tsai Bizette1943 and Foex and Lebeau Foex1948 utilizing thermodynamic, magnetic and thermal-expansion experiments, respectively. Neutron diffraction at 80 K, well below the magnetic ordering temperature, has been performed by Shull et al. Shull1951 These authors observed the typical AFM diffraction pattern of the insulating transition-metal monoxides with a doubling of the chemical unit cell. The almost complete absence of the (111) reflection indicated that in FeO the magnetic moments of Fe2+ are aligned perpendicular to the ferromagnetic (FM) (111) sheets with strictly alternating moment directions. Roth confirmed this magnetic structure and determined in addition an average iron moment of = 3.32 at 4.2 K Roth1958 . This value is clearly reduced with respect to the expected spin-only value for Fe2+ (, = 2) of about 4 , assuming an effective -value and is difficult to explain. Even assuming an iron deficiency = 0.1 still yields a larger ordered iron moment of 3.6 . The actual effective -value for Fe2+ in octahedral environment depends strongly on the spin-orbit coupling, covalency, and possible distortions of the octahedra as discussed by Goodenough, who predicted anisotropic g-values by considering spin-orbit coupling and a trigonal distortion Goodenough1968b . Such a situation is realized in FeO, which exhibits a rhombohedral distortion below the Néel temperature. Contrary to MnO and NiO the angle of the unit rhomb becomes less than 60° and the cell is elongated along the [111] axis Tombs1950 in agreement with the direction of the antiferromagnetic axis. Upon entering the magnetically ordered state a clear splitting of the infrared active phonon is observed, similar to other TM monoxides Rudolf2008 ; Kant2008 and a number of Cr spinels Sushkov2005 ; Hemberger2006 ; Hemberger2007b ; Rudolf2007 ; Kant2011 . Theoretically, this splitting has been described in the framework of a spin-Jahn-Teller effect Yamashita2000 ; Tchernyshyov2002 .
In this work we discuss in detail the optical properties of Fe0.93O including polar phonon modes, electronic transitions related to the Fe2+ ions, and the onset of the band gap. Moreover, we find the existence of a Drude-like contribution in the paramagnetic state and revisit the magnetic, electric, and thermodynamic properties making use of the obtained optical excitation spectrum.
2 Experimental details
Single crystals of FeO in the form of platelets with dimensions of approximately 10 mm2 and 1 mm thickness and polished to optical quality were purchased from MaTeck GmbH. For structural characterization small pieces of a crushed single crystal were investigated by x-ray powder diffraction using a STOE diffractometer with a position sensitive detector. To measure the electrical resistance, a standard four-point technique was utilized down to temperatures of approximately 100 K with a constant current of 10 mA. For lower temperatures and increasingly high resistance a constant voltage of 10 V was applied in a two-point configuration. The latter measurements were performed with the Keithly Electrometer 6517A with an input impedance 200 T. The dielectric properties were measured employing a frequency-response analyzer (Novocontrol -analyzer). The magnetic properties were studied using a commercial superconducting quantum interference device magnetometer (Quantum Design MPMS-5) with magnetic fields up to 50 kOe and temperatures from 2 K 400 K. The heat capacity was measured in a physical properties measurement system (Quantum Design PPMS) for temperatures from 2 K 300 K. The reflectivity measurements were carried out using the Bruker Fourier-transform spectrometers IFS 113v and IFS 66v/S, both being equipped with a He-flow cryostat operating between 4 K and 600 K. Using different light sources, different beam splitters, and different detectors, we were able to cover the frequency range from 100 cm-1 to 28000 cm-1. For the analysis of the reflectivity we derived the complex dielectric constants or the complex conductivity by means of Kramers-Kronig transformation with a smooth power-law extrapolation towards high wave numbers. A constant low-frequency extrapolation has been used for the insulating compounds at low temperatures ( 130 K) and an additional Drude-like conductivity resulting in a Hagen-Rubens low-frequency extrapolation has been applied at elevated temperatures, where conductivity plays an essential role. Some optical results in the far-infrared regime wüstite have been published previously Kant2009 . Note that in Kant2009 the same crystal as investigated in this work is indexed as Fe0.92O. As detailed in section 3.1 the stoichiometry rather is Fe0.93O.
3 Experimental results and discussion
3.1 Structural and electrical characterization
In the x-ray diffraction measurements at room temperature, only peaks of the proper fcc structure were observed (space group Fm3̄m) and no impurity peaks above background could be detected. From a detailed Rietveld analysis we determined the lattice spacing a = 4.2978 Å. In addition, we refined the site occupation of the iron ions and found a value of 0.91. From a compilation of literature data of lattice constants of FeO with different iron deficiency, McCammon and Liu McCammon1984 proposed a linear relation between the lattice spacing and the iron deficiency , a = 4.334 - 0.478 . In our case this relation provides = 0.0757 or (1 - ) = 0.924. In a similar manner, McCammon McCammon1992 proposed a relationship between antiferromagnetic ordering temperature and Fe concentration. As will be documented later, the best estimate of the magnetic ordering temperature of the compound under consideration is = 195(2) K, which corresponds to a composition (1 - ) = 0.94. Using this information we finally estimate the stoichiometry of our sample to be (1 - ) = 0.93(2) and the wüstite sample investigated in this work is referenced as Fe0.93O. Assuming ideal oxygen stoichiometry, this composition suggests that charge compensation is reached for FeFeO.
Several studies have been reported Tannhauser1962 ; Geiger1966 ; H.K.Bowen1975 , focusing on the electrical resistance of wüstite, specifically pointing towards the close relationship of the temperature dependent conductivity in FeO as compared to Fe3O4, which reveals a metal-to-insulator transition close to 124 K Tannhauser1962 ; H.K.Bowen1975 . Bowen et al. H.K.Bowen1975 concluded that the electrical transport is thermally activated for temperatures above 120 K and reveals variable-range hopping proportional to at lower temperatures. Fig. 1 shows the results as obtained from the present experiments (circles). Here we have plotted the logarithm of the resistance vs. the inverse temperature in an Arrhenius-like plot. The measurements at high temperatures ( 100 K) have been performed in standard four-point technique. At lower temperatures a two-point configuration has been used. As can be seen in Fig. 1, both data sets are in good agreement, but certainly do not match perfectly. This can be ascribed to the fact, that in four-point configuration the sample resistance becomes of the order of the input impedance of the device, while in two-point configuration contact resistances may play a role at higher temperatures. The data from 130 K to 400 K can nicely be described by purely thermally activated behavior. Using (solid red line in Fig. 1) we find a prefactor = 2.3 mcm and an energy barrier of 1030 K corresponding to 89 meV. These findings are in good agreement with the results of Bowen et al. H.K.Bowen1975 , who investigated a wüstite sample with an iron concentration of 0.91. The purely thermally activated behavior extends from high temperatures deep into the magnetically ordered state until approximately 130 K. In the inset of Fig. 1 we show the same data set as logarithm of resistance vs. . This should lead to linear behavior for variable-range hopping (VRH) of localized charge carriers near the Fermi level in a disordered semiconductor as first predicted by Mott Mott1969 . In a limited temperature range of 40 K 90 K, but over approximately six decades of conductivity, we find reasonable agreement of the experimental results with the VRH model.
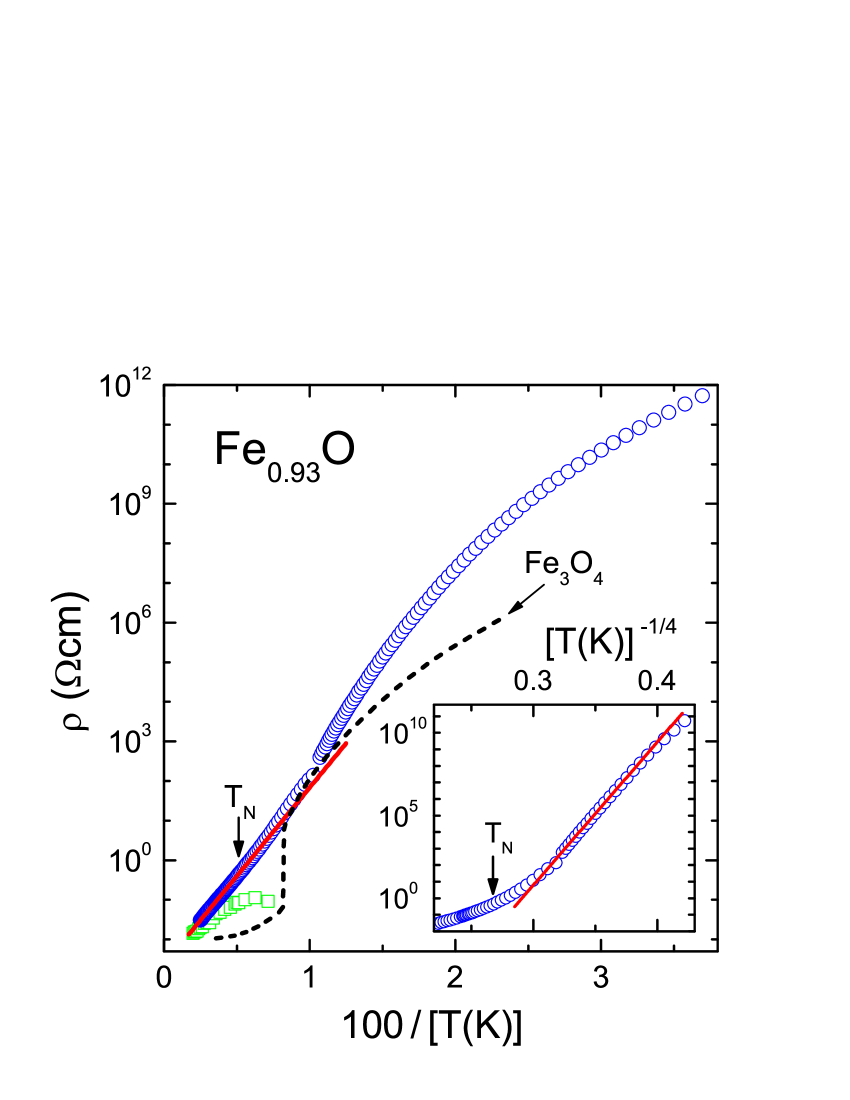
At this stage we would like to make some comments on these interesting results. First of all, the transition from purely thermally activated to VRH behavior has to be expected in disordered semiconductors Mott1978 . In systems revealing this behavior the Fermi energy lies within the region of localized states, extending from the band edge to the mobility edge. At high temperatures charge carriers can be excited across the mobility edge and follow an Arrhenius-type of temperature behavior, finally asymptotically reaching the so called ”Mott minimum metallic conductivity”, which is given by 610/ (cm)-1 if the lattice constant is given in Å Mott1972 . Taking the lattice constant of wüstite given above, leads to 142 (cm)-1, a value in the order of magnitude as observed in Fig. 1 with = 435 (cm)-1. At low temperatures the electrons can only hop between different localized states close to the Fermi energy and a behavior can be expected. In wüstite due to cation vacancies an acceptor band is believed to form just above the valence band. To take into account the observation of VRH conductivity, it seems straightforward to assume that due to disorder the high-energy states in the valence band are localized and that a mobility edge forms close to the upper band edge. Hence, free charge carriers can only be expected when holes are created below this mobility edge. Earlier, Bowen et al. H.K.Bowen1975 have assumed that the energy gap as determined by the resistivity experiments corresponds to transitions from the top of the valence band to the acceptor energy. We propose that the activation energy as determined from the dc resistivity documented in Fig. 1 is a measure of the distance from the mobility edge to the acceptor level.
It is worthwhile to compare the temperature dependent resistivity of wüstite with that of magnetite, Fe3O4. The latter compound exhibits a metal-to-insulator transition due to charge-ordering phenomena close to 130 K. In Fig. 1 we have included the resistivity as determined in magnetite in a sample that has been characterized in detail in Ref. Schrettle2010 . Magnetite is characterized by Fe2+ in tetrahedral environment, but in addition by a distribution of Fe2+ and Fe3+ in octahedral environment. The resulting resistance is shown as dashed line in Fig. 1. Interestingly, at high temperatures in both compounds, in ”metallic” magnetite as well as in ”semiconducting” wüstite, the resistance is of the order of 10 mcm, but with a much weaker temperature dependence in the former case. At the insulating side of the metal-to-insulator transition both resistivities again become equal, close to 100 cm and show a similar further non-Arrhenius increase towards low temperatures.
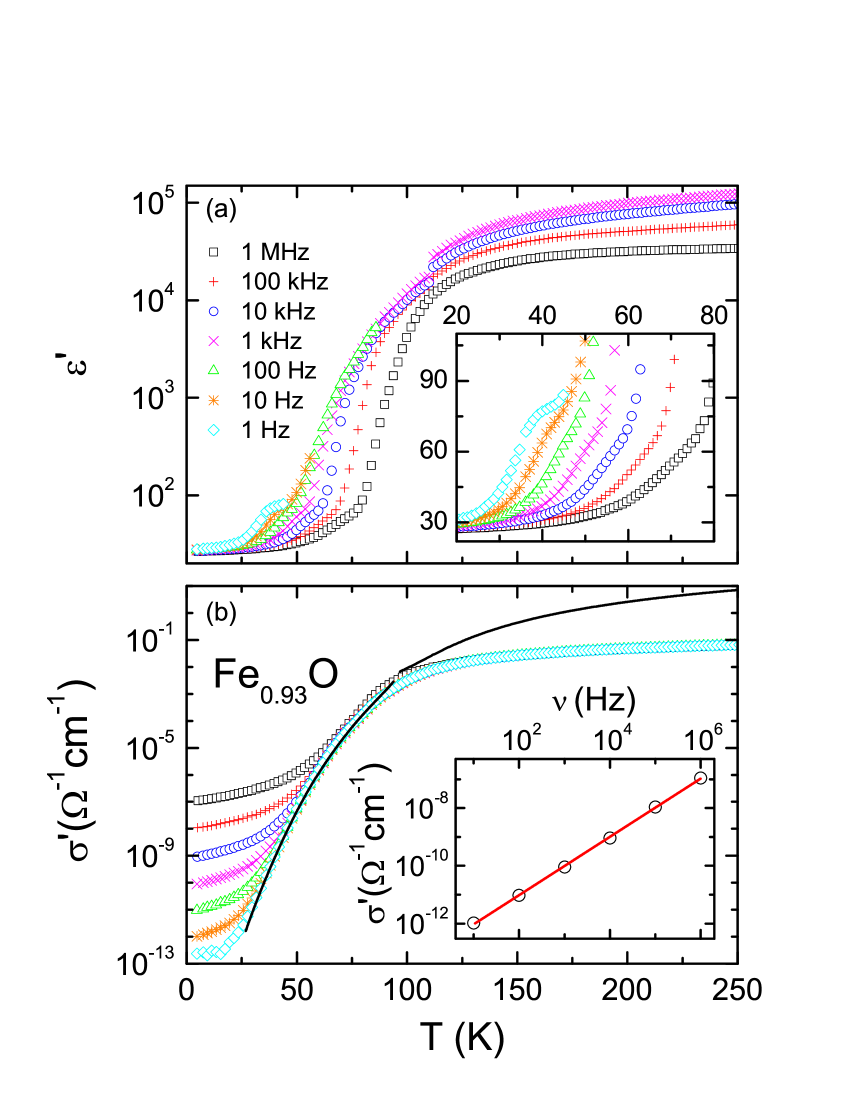
Fig. 2a shows the real part of the complex dielectric constant of Fe0.93O as a function of temperature for various frequencies between 1 Hz and 1 MHz. Close to room temperature, is of the order of 105. Such high values of the dielectric constant are often generated by electrode polarization due to formation of a diode at the interface of contact and sample Lunkenheimer2002 . Hence, the observed high values of are of extrinsic origin. For all frequencies measured, the dielectric constant decreases to a weakly indicated lower plateau with values of 70 (see inset of Fig. 2a). This steplike decrease is strongly frequency dependent and can be ascribed to a non-intrinsic, so-called Maxwell-Wagner relaxation Lunkenheimer2002 ; Maxwell1873 ; Wagner1913 . Upon further cooling, decreases again to a value of approximately 27. This second decrease also shows a significant frequency dependence and is shifted towards lower temperatures with decreasing frequency. We ascribe it to an intrinsic dielectric relaxation. In non-stoichiometric wüstite with significant iron deficiency the appearance of Fe3+ or holes at the oxygen sites can be expected. These entities could be responsible for the creation of polar defects. Again we would like to stress the close relationship with magnetite. In magnetite in a comparable temperature range similar, but certainly much stronger relaxation phenomena have been detected which establish a short-range polar state at low temperatures Schrettle2010 . In wüstite we have checked the field dependent polarization for temperatures below 50 K and found strictly linear field dependence and no indications of polar hysteresis effects for all temperatures. It is worthwhile to mention that similar dispersion effects have been detected in different TM compounds and interpreted as evidence for bound polarons Lunkenheimer1992 ; Pimenov1994 or to be due to orbital fluctuations Fichtl2005 . Both explanations seem to be possible in wüstite, too. However, a detailed analysis of these effects is severely hampered by the strong Maxwell-Wagner relaxation which dominates the dielectric spectra above 30 K.
The real part of the conductivity, which is proportional to the dielectric loss, is shown in Fig. 2b. At temperatures below 50 K the conductivity reveals strong dispersion, which indicates frequency dependent conductivity due to hopping processes in agreement with the dc results presented in Fig. 1. In the lower inset we show the frequency dependence of the ac conductivity at 5 K and find a dependence of the form with close to 1.0. A frequency dependent hopping conductivity is observed in many disordered semiconductors and the frequency exponent in many cases approximately approaches values close to 1 Elliott1987 . This observation might be indicative for small polaron hopping, as it has been stated by van Staveren vanStaveren1991 , that in contradiction to Ref. Elliott1987 , it is the small polaron hopping that exhibits a frequency exponent close to 1 at low temperatures. At high temperatures the conductivity reaches a plateau and is dominated by electrode polarization, which determines the two-point resistance in a variety of materials as decribed in detail, e.g. in Lunkenheimer2002 ; Emmert2011 . Between 25 K and 100 K the ac conductivity as determined at 1 Hz nicely follows the dc conductivity, which is indicated as solid line.
3.2 Magnetic susceptibility
The magnetic susceptibility of wüstite has been investigated by Bizette and Tsai Bizette1943 , Ariya and Grossman Ariya1956 , Koch and Fine Koch1967 and by Srinivasan and Seehra Srinivasan1983 . The latter investigated the magnetic susceptibility just around the magnetic ordering transition, concluding that it is of first order. The other three groups aimed to determine Curie-Weiss temperatures and Curie constants of the paramagnetic susceptibility. Fitting the high-temperature susceptibility data in emu per mole using , these groups reported vastly different results. In a sample of unspecified composition, Bizette and Tsai Srinivasan1983 found = 198 K, = 6.24 emu K/mol, and = - 570 K, when analyzing the susceptibility up to room temperature only. From high temperature data (100 K 1200 K) of Fe0.93O, Ariya and Grossman Ariya1956 reported = 3.60 emu K/mol and = - 94 K, while Koch and Fine Koch1967 , analyzing the magnetic susceptibility of a sample with (1 - ) = 0.93 between the ordering temperature and 400 K reported = 3.56 emu K/mol and = - 136 K. The discrepancies of these results may be explained by the different temperature regimes that have been used for the data analysis, but also by the slightly different stoichiometries of the samples and the possible presence of magnetic impurity phases.
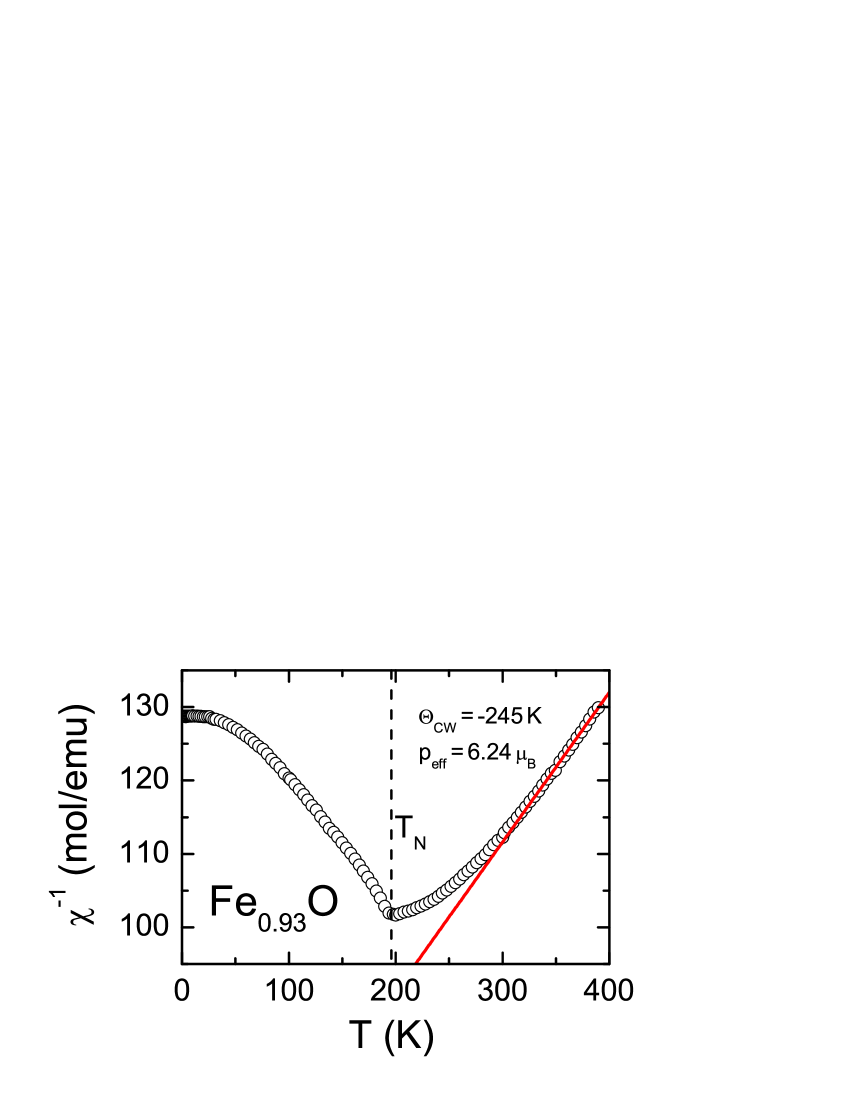
Fig. 3 shows the inverse of the susceptibility of our sample vs. temperature between 2 K and 400 K Kant2009 . The best estimate of of this set of data is 196 K, where a clear minimum in (T) shows up. No traces of the structural phase transition of magnetite at 124 K can be detected and, even more importantly, any spontaneous magnetization is absent, even at the lowest temperatures. From this observation we conclude that our sample contains no residual -Fe or Fe3O4 clusters. Analyzing the susceptibility between 320 K and 400 K results in a Curie constant = 4.90 emu K/mol and a Curie-Weiss temperature = - 245 K. Comparing our results with published data, the composition of our sample is close to that investigated by Koch and Fine Koch1967 and in addition the magnetic susceptibilities have been analyzed in similar temperature ranges. Calculating the effective paramagnetic moment per Fe ion, taking into account the iron deficiency , we obtain = 6.26 per Fe ion. This effective moment has to be analyzed in terms of both Fe2+ with spin and Fe3+, with spin according to FeFeO. Setting the -factor for Fe3+ with a half-filled shell equal to two, we obtain an effective -value of 2.69 for Fe2+, which is larger than the anisotropic -values in the range estimated in ionic crystals such as RbFeF3 or FeF2 Wang1966 ; Wang1971 ; Moriya1956 , but still smaller than in dilute systems with undistorted octahedral environment such as Fe2+ in MgO Low1960 ; Abragam1986 . In the latter case the value is in accordance with the spin-orbit coupling constant = -100 cm-1 of free Fe2+ and a crystal-field splitting of about 10000 cm-1 Low1960 ; Abragam1986 .
Nevertheless, our value is clearly different than the ordered moment as determined by neutron diffraction, which suggested a -value smaller than 2 Roth1958 . Kanamori calculated the paramagnetic susceptibility for a fully stoichiometric FeO sample and predicted a Curie constant = 3.15 emu K/mol and a Curie-Weiss temperature = - 332 K, again different from experimental results Kanamori1957 . It seems that a consistent description of the effective paramagnetic and the ordered moment can only be reached by a detailed comparative studies of samples with well defined stoichiometry.
3.3 Heat capacity
The heat capacity of ferrous oxide has been studied by a number of groups, including Millar Millar1929 , Todd and Bonnickson Todd1951 , Mainard et al. Mainard1968 , Gronvold et al. Grnvold1993 , and Stolen et al. Stolen1996 . The main observation of these experiments was a strong stoichiometry dependence of the specific-heat anomaly at the magnetic ordering temperature. While in Ref. Todd1951 a well defined and relatively sharp anomaly is visible in a sample with = 0.947, Gronvold et al. Grnvold1993 report relatively small and smeared out anomalies for wüstite samples with iron concentrations of 0.9254 and 0.9379. The concentration dependence of the entropy deduced from the heat capacity anomaly at has been systematically investigated in Ref. Mainard1968 .
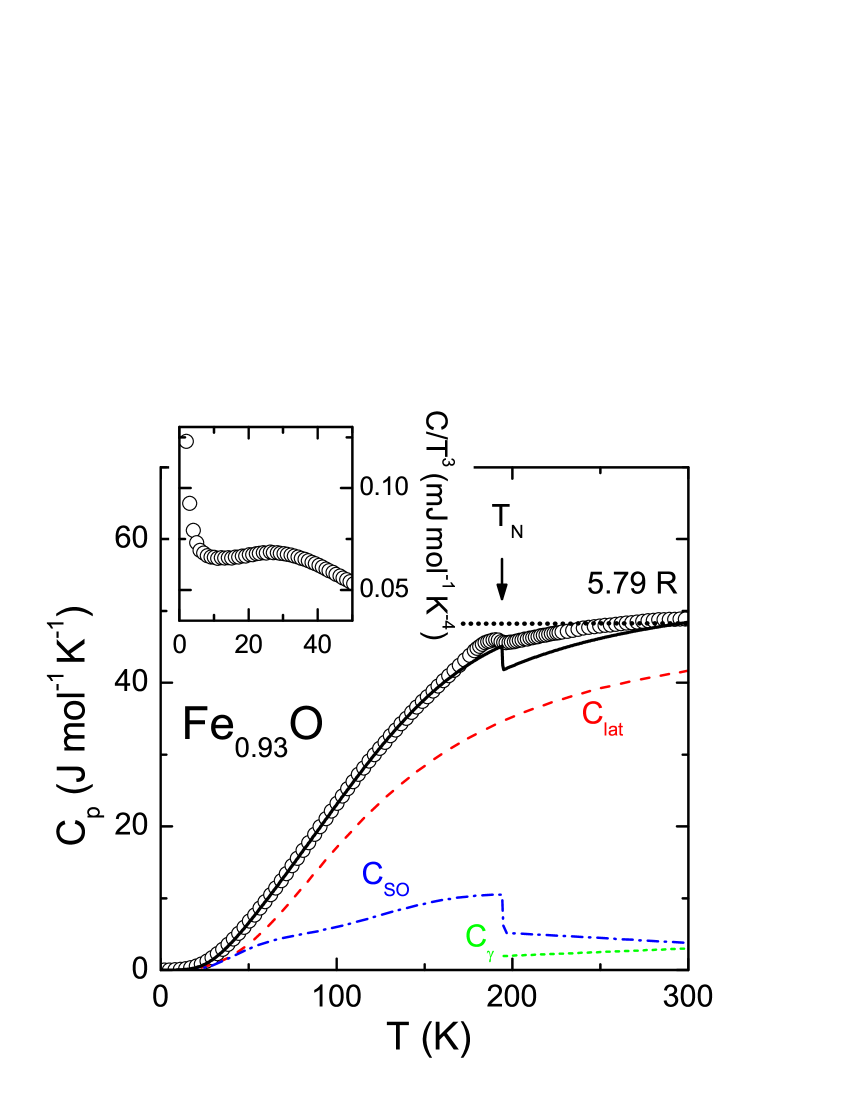
The temperature of the specific heat of our sample, measured at constant atmospheric pressure, is shown in Fig. 4. A small and smeared out anomaly similarly to the data obtained in Grnvold1993 characterizes the antiferromagnetic phase transition, from which we determine 194 K. Taking this value together with = 196 K from (T), we arrive at an average antiferromagnetic transition temperature of Fe0.93O of = 195(2) K. No further indications of phase transitions can be detected, documenting that the sample under investigation contains no spurious phases, specifically no traces of magnetite which would give an anomaly close to the Verwey transition at 124 K in Fe-rich wüstite Stolen1996 . At room temperature the heat capacity approaches values close to 5.79 R, corresponding to the high temperature limit of the lattice specific heat only. Here we took into account, that the compound under consideration has an iron deficiency of 0.07 and hence is not a perfect two atomic solid.
Plotting the specific heat as vs. in Fig. 4 reveals a almost constant behavior for 10 K 30 K and indicates a dependence stemming from a Debye-like phonon density of states and gapless AFM magnon excitations. At the lowest temperatures, 10 K, significant deviations from this behavior appear in , which might be attributed to the presence of Fe3+ which reportedly exhibit a crystal-field splitting, which can lead to a Schottky-like increase towards lowest temperatures. Alternatively this non-Debye like increase of towards low temperatures could also signal glass-like behavior due to the significant iron deficiency.
In the following we will analyze the heat capacity data by assuming that the total heat capacity consists of contributions originating from vibrational, spin, orbital, and charge degrees of freedom. To distinguish these contributions we will rely on the low-frequency optical excitation spectrum. A similar approach has been used to model successfully the specific heat in CoO Kant2009 :
We will start with the spin and the three-fold degeneracy of the orbital ground state of Fe2+ () in the paramagnetic regime. The low-lying electronic Fe2+ levels can be described by an effective total momentum with corresponding to an effective orbital momentum with and spin . Spin-orbit coupling leads to a triply degenerate ground state with , the first excited state with at 2, and the second exited state with at 5 Goodenough1968b . We approximate the contribution of these levels to the specific heat by
| (1) | |||||
| (2) |
with the partition function , the excitation energies meV as observed in the FIR spectra discussed below, degeneracies , and . The resulting contribution is shown as a dashed line in Fig. 4. In the next step we subtract from the experimental specific heat for and model the residual specific heat in the paramagnetic regime by a sum of one isotropic Debye, one isotropic Einstein term and a linear contribution justified by the observation of a Drude-like contribution in the paramagnetic state. Constraining the Debye temperature to the vicinity of = 385 K as derived from the low-temperature data and the Einstein temperature to vary around the experimental eigenfrequency of the transverse polar phonon, we find a satisfactory agreement using the parameters = 385 K, = 479 K, and = 10 mJ/molK. We further subtract the linear contribution in the paramagnetic regime (dash-dotted line) and the lattice contribution (dotted line) in the entire temperature range assuming that changes below the magnetic transition are negligible. As a result we can write the total specific heat as
Alone, the contribution has not yet been determined. In the magnetically ordered state the degeneracy of the Fe2+ levels will be lifted due the exchange coupling. These splittings were not resolved in the optical experiment, but we can simulate the residual data satisfactorily by assuming that only the lowest-lying level is split and the higher-lying states are only shifted in energy. The resulting (dashed line) is then again approximated using Eq. 1, the anticipated excitation energies meV for and corresponding degeneracies for . Clearly, this procedure is not unambiguous, but summing up all modeled contributions nicely describes the experimental data of the heat capacity of wüstite and justifies our approach to a certain extent.
3.4 Optical properties
Infrared reflectivity experiments on ferrous oxide with the main focus on phonon properties and conductivity contributions of free charge carriers at elevated temperatures have been performed by Bowen et al. H.K.Bowen1975 , Prevot et al. Prevot1977 and by Henning and Mutschke Henning1997 . Recently, Seagle et al. Seagle2009 have investigated the phonon properties and conductivity contributions of Fe0.91O as function of hydrostatic pressure. The absorption at higher frequencies close to the fundamental absorption edge has only been published in Ref. H.K.Bowen1975 .
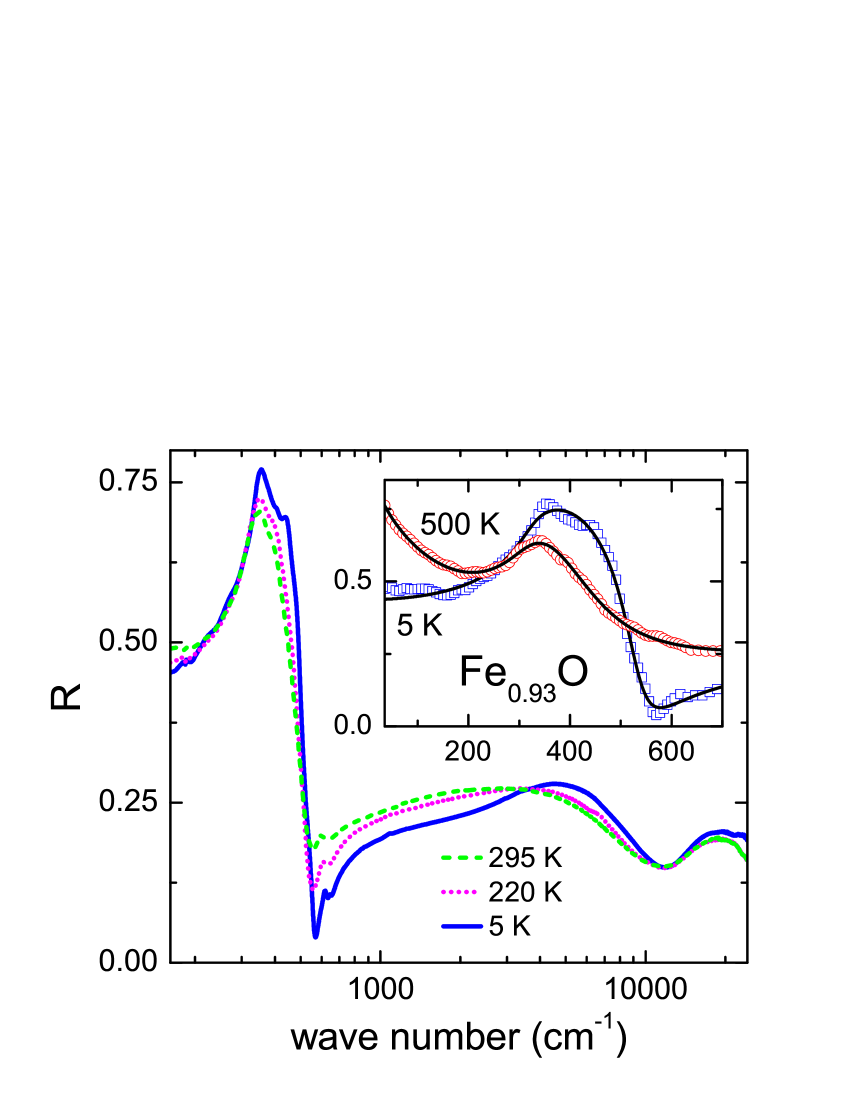
In Fig. 5 we have plotted the reflectivity as function of wave number from approximately 100 cm-1 to 24.000 cm-1 in a semilogarithmic representation. The upper wave-number limit corresponds to approximately 3 eV in energy. In the main frame the reflectivity is shown at three temperatures, namely well in the magnetically ordered state at 5 K, just above at 220 K and at room temperature. From 200 cm-1 to 700 cm-1, the typical phonon response of a cubic two-atomic ionic crystal dominates the reflectivity spectra. Electronic excitations appear already well below 10.000 cm-1 and approximately at 20.000 cm-1. The inset of Fig. 5 shows the low frequency response at 5 K and at 500 K. At elevated temperatures, the strong increase of the reflectivity towards low frequencies and the decrease of the dipolar strength of the phonon response due to screening effects clearly signal the existence of an increasing number of free charge carriers.
3.4.1 Phonon properties and Drude-like behavior
We have converted the reflectivity into the complex dielectric constant , where and correspond to real and imaginary part of the dielectric constant, respectively. has then been analyzed using the model dielectric function
| (4) |
Here is the electronic dielectric constant, as defined at the upper limit of the phonon and at the lower limit of the electronic contributions. The second term of Eq. (4) corresponds to a Drude-like contribution due to mobile charge carriers, with an effective plasma frequency , and a life time , corresponding to an inverse electronic scattering rate. The electronic plasma frequency is defined by
| (5) |
and is directly related to the dc conductivity via
| (6) |
Here designates the charge-carriers density and is the dielectric permittivity of free space. The third term in Eq. (4) describes the contributions of a normal mode to the dielectric constant according to a Lorentz oscillator. At temperatures , where the optic mode splits into two branches, the sum of two Lorentz oscillators has to be used. In Eq. (4) designs the dielectric strength of the mode, the transverse optical eigenfrequency and the damping of the appropriate phonon mode. Using this three-parameter fit for the phonon modes implies that the damping is frequency independent and the same for transverse (T) and longitudinal (L) modes. The longitudinal optical eigenfrequency can then be calculated via the Lyddane-Sachs-Teller relation
| (7) |
where the static dielectric constant is given by .
For the analysis of the phonon properties and of the dynamic conductivity one can proceed in two ways. Here we directly analyze the reflectivity above , which is given by
| (8) |
with the complex dielectric constant as defined in Eq. (4). The results of these fits, using eigenfrequency, damping and dielectric strength as free parameters, are shown as solid lines in the inset of Fig. 5. Here it should be noted that the fits in the inset of Fig. 5 have been derived by assuming one Lorentz oscillator only. This means that for this fit we have ignored the phonon splitting at 5 K. The phonon splitting in the antiferromagnetic state has been determined separately by analyzing the dielectric loss as discussed in the following.
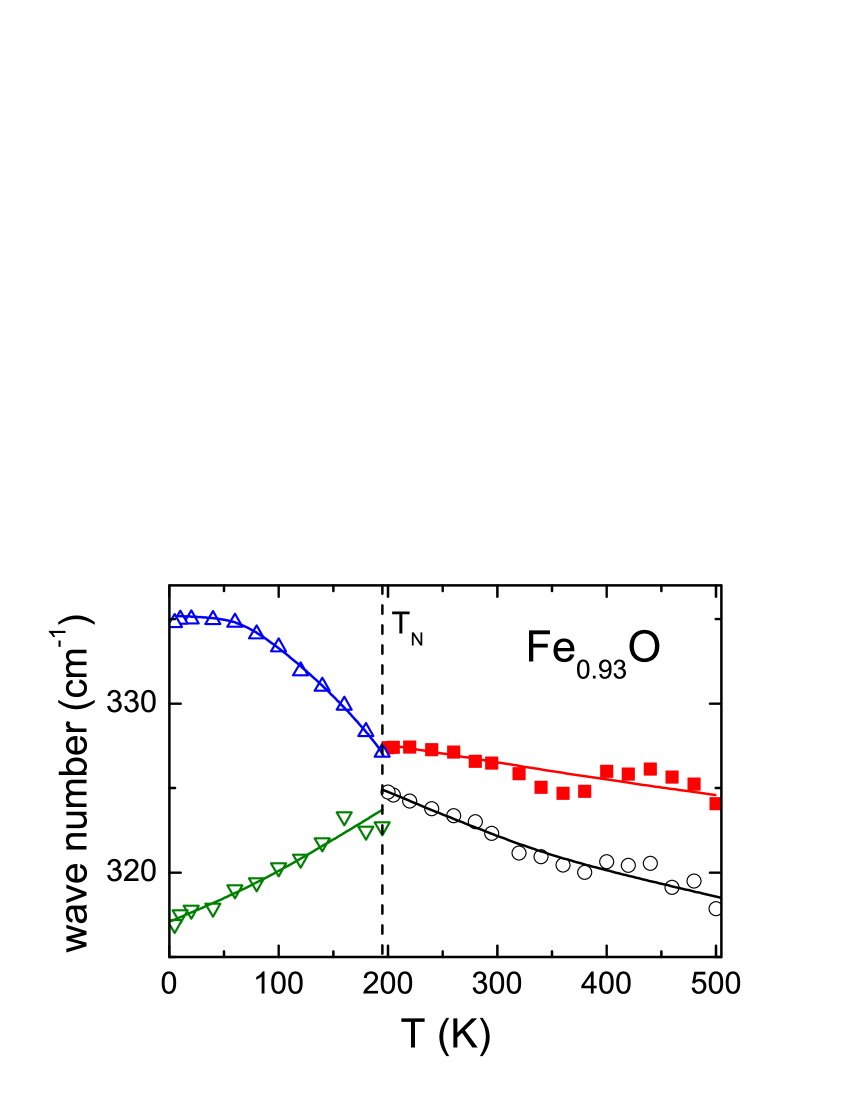
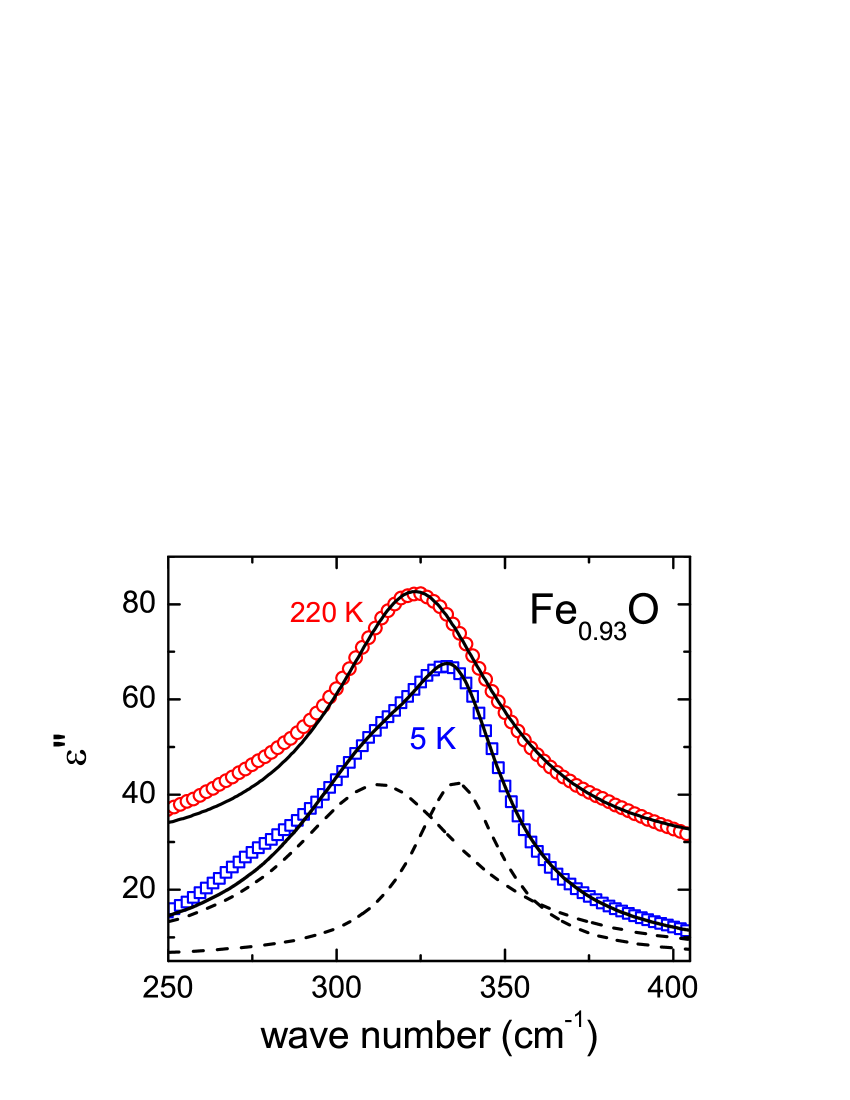
The resulting temperature dependence of the transverse phonon eigenfrequencies are shown in Fig. 6 as (red) squares, which only show a weakly temperature dependent phonon mode frequency of about 326 cm-1. This data is compared to the one obtained by the second approach, namely the evaluation of the dielectric loss obtained after Kramers-Kronig transformation. The results of this analysis have been reported previously Kant2009 and, therefore, will only shortly be summarized for completeness: An example of the dielectric loss in wüstite is shown in Fig. 7, presenting vs. wave number between 250 cm-1 and 400 cm-1 at 5 K, in the AFM state and at 220 K, just above the magnetic ordering temperature in the paramagnetic phase. While the dielectric loss at 220 K clearly shows a symmetric peak, a strong asymmetry evolves below the onset of magnetic order. The peak at 220 K can nicely be fitted with a single Lorentz oscillator, while two oscillators, indicated by dashed lines, are necessary to describe the low-temperature data. Deviations from the Lorentz fits appear close to 270 cm-1. These deviations are almost temperature independent and we have no explanation of their origin so far.
The splitting of the transverse optical phonon itself has been attributed to the effects of an mostly exchange-induced coupling mechanism Yamashita2000 ; Tchernyshyov2002 ; Massidda1999 ; Luo2007 ; Kant2011 . The eigenfrequencies which have been determined from these fits to the dielectric loss of wüstite are also plotted in Fig. 6. In the paramagnetic phase the eigenfrequencies reveal a similar temperature dependence as those determined from the fits to the reflectivity, but are shifted by approximately 5 cm-1 to lower energies. This deviation gives a rough estimate of the precision of the two different methods to derive the eigenfrequencies and probably results from the assumption of a frequency independent damping and from the fact that the dc conductivity has not been equally taken into account by the two different fitting scenarios. Below , in Fig. 6 the splitting of the modes is clearly visible and increases on decreasing temperature. At 5 K the splitting is of the order of 15 cm-1 and significantly smaller than the phonon splitting observed in isostructural and AFM MnO, where it amounts almost 25 cm-1 Rudolf2008 .
In the following we discuss the obtained fit parameters, namely the eigenfrequencies of transverse and longitudinal optical modes, the damping, which is assumed to be identical for both modes, and the static as well as the electronic or infinite dielectric constant (table 1).
| 322.3 cm-1 | 466.0 cm-1 | 76.1 cm-1 | 22.6 | 10.8 |
The eigenfrequencies are only partly in agreement with the results obtained by inelastic neutron scattering Kugel1977 . At room temperature, the zone-center optical eigenfrequencies were found to be = 320 cm-1 and = 526 cm-1. While the former certainly agrees within experimental uncertainties with the present value of 322 cm-1, the disagreement of the longitudinal eigenfrequencies is much larger. In the neutron work unpublished IR results are cited with = 290 cm-1 and = 535 cm-1. From further infrared reflectivity measurements the values of = 333.7 cm-1 and = 493.5 cm-1 have been determined Prevot1977 . In the latter work dielectric constants at zero and infinite frequencies are published with values of = 32.8 and = 9.63, respectively. The latter value is of the order of magnitude as determined here, but nevertheless seems quite large for transition metal monoxides. In MnO, CoO and NiO the electronic dielectric constant, 5, is by a factor of two smaller than in FeO. We think that the large value of in wüstite results from the crystal-field excitation which significantly contributes to the reflectivity at 1000 cm-1. In addition, at room temperature, and even more at elevated temperatures, conductivity contributions hamper an exact determination of the electronic dielectric constant. This uncertainty in the determination of could also provide a possible explanation for the enormous scatter of reported values of the longitudinal eigenfrequency. In the dielectric measurements of this work (section 3.1) we have determined a high-frequency value of the dielectric constant of 27, which is not too far from determined in the FIR experiments. If we take as determined from the dielectric measurement and as well as as determined from the infrared experiments and listed in Table 1, we determine an longitudinal optical eigenfrequency via Eq. (7), = 509.6 cm-1.
From the fits using Eq. (4) we also have deduced the relevant parameters of the free-carrier contribution. This was possible only for temperatures 150 K. Below 150 K, in the hopping regime (section 3.1), no conductivity contributions can be determined from the FIR experiments. For low temperatures wüstite behaves like an insulator. A closer inspection of the main frame of Fig. 5 also documents that electronic transitions dominate the optical response even well below 1 eV ( 8000 cm-1) and, hence, hamper the determination of the electronic relaxation time . From the fits as indicated in the inset of Fig. 5, only the dc conductivity can be determined, proportional to the product (see Eq. (6)). The inverse dc conductivity as determined from these fits is plotted in Fig. 1, in addition to the resistivity results. While the data are in reasonable agreement for high temperatures, significant deviations appear on cooling. From Fig. 1 it is clear that the dc conductivity, as determined from the reflectivity measurements at high frequencies, follows a significantly different Arrhenius behavior compared to determined from the low-frequency experiments. On further cooling additional deviations appear, which probably stem from the fact that for low temperatures the dc conductivity was too small and the reflectivity measurements did not cover sufficiently low frequencies to correctly determine the conductivity contributions. A fit to the high-frequency optical results of the dc resistivity as shown in Fig. 1 yields an energy barrier of 47.5 meV, almost a factor of 2 lower than the gap determined from the dc resistivity experiments.
3.4.2 Electronic transitions
Splitting of the ground state by spin-orbit coupling
In addition to the phononic and Drude contribution, the FIR spectra bear fingerprints of local Fe2+ transitions, which have been used already above to model the specific heat. In a system in an octahedral crystal field with a ground state ( = 2; ) we expect the splitting of the ground-state triplet into 3 levels, with the ground state at 0 and excited levels at 2 and 5 , so that the overall splitting is given by 5 , with being the spin-orbit coupling constant Goodenough1968b . To the best of our knowledge no optical information on the low-lying Fe2+ levels and the spin-orbit coupling is available in literature. Alone, an optical absorption line of dilute Fe2+ in MgO has been reported close to 10000 cm-1 Low1960b .
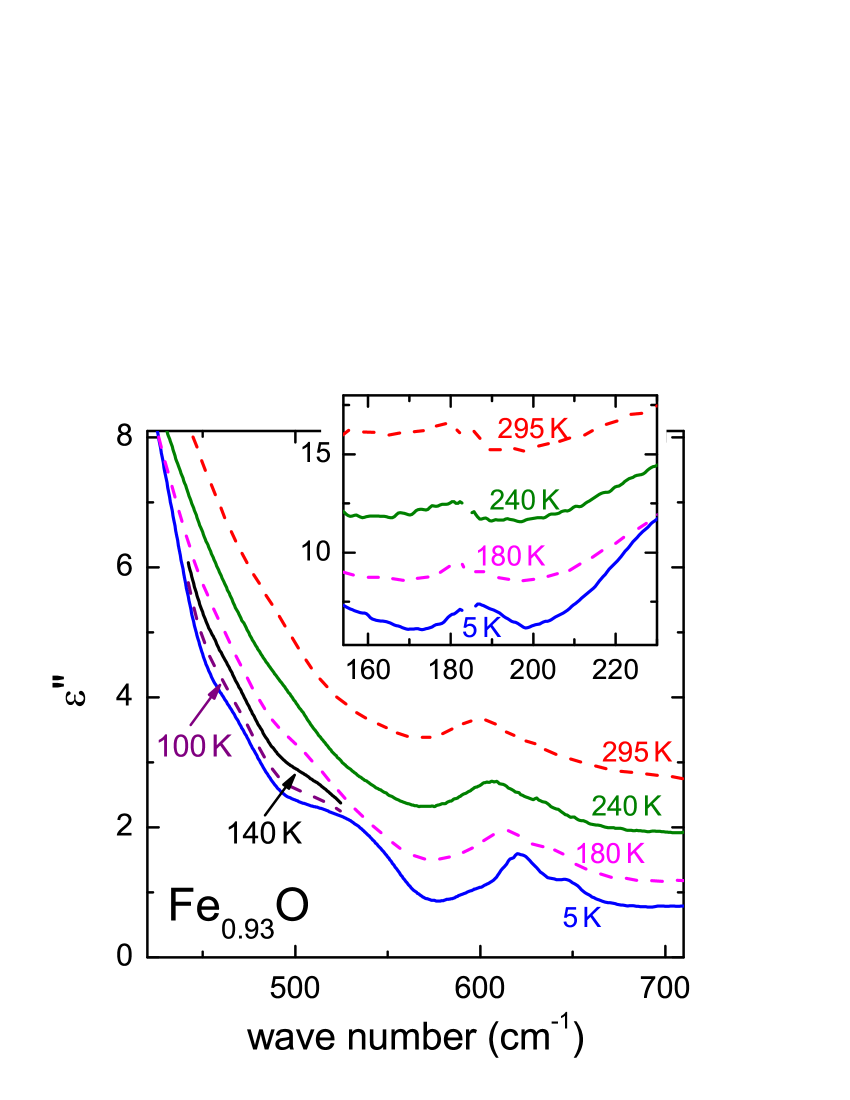
As documented in Fig. 8 (inset) we identify a weak structure close to 185 cm-1 which is almost temperature independent and in addition we detect a tiny anomaly close to 490 cm-1 at 240 K (main frame). This anomaly seems to split in the magnetically ordered state and becomes smeared out at higher temperature due to conductivity contributions to the dielectric loss. In addition, we find an anomaly close to 600 cm-1 at room temperature which strongly shifts to higher frequencies on cooling. This mode has been analyzed in detail by Seagle et al. Seagle2009 . From the observed pressure dependence they concluded that this mode corresponds to a localized defect excitation. Hence, we identify the two remaining excitations close to 185 and 490 cm-1 as transitions between the ground state split by spin-orbit coupling. Assuming a spin-orbit coupling constant of 95 cm-1 we expect two transitions close to 190 cm-1 and 475 cm-1 in good agreement with the observed transitions.
Band gap and crystal-field excitations
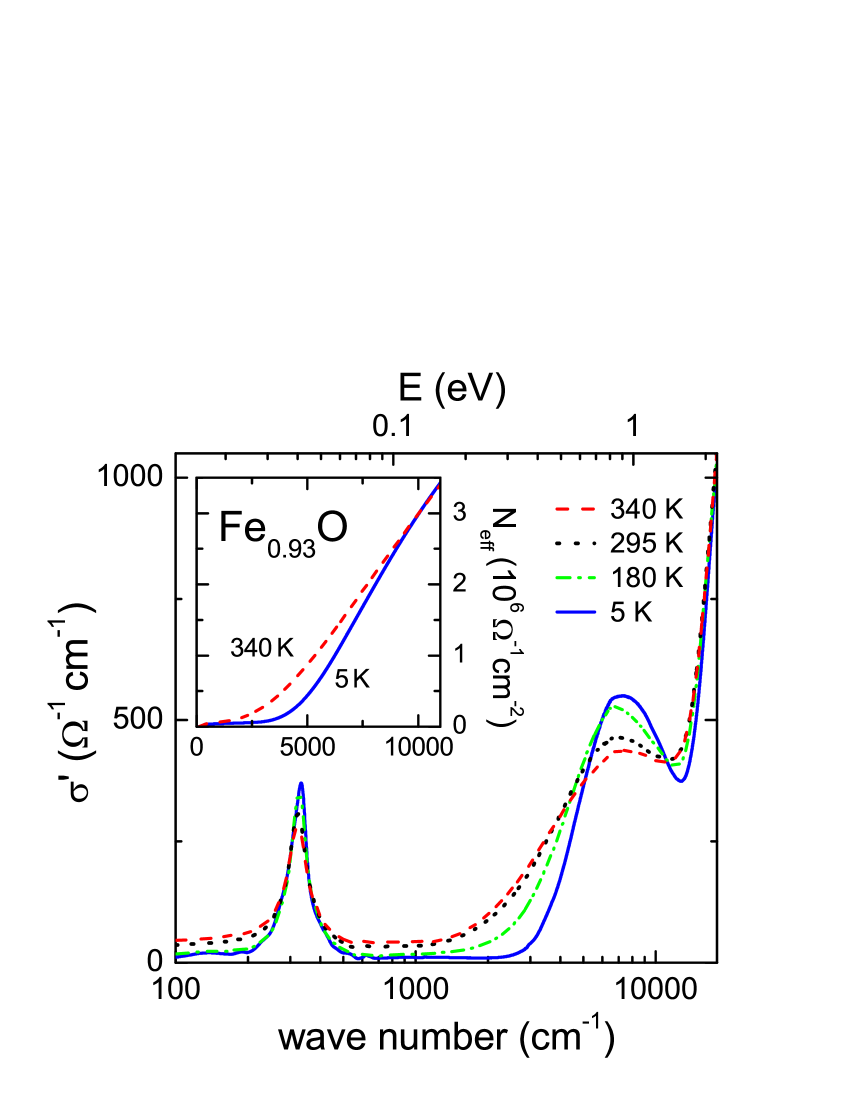
The optical conductivity as derived from the reflectivity (see Fig. 5) is documented in Fig. 9 for temperatures between 5 K and 340 K. The real part of the conductivity is given by . The transverse optical phonon mode close to 320 cm-1 is followed by a well defined electronic transition close to 7500 cm-1 and the onset of a charge-transfer excitation close to 12000 cm-1.
The electronic transition close to 7500 cm-1 is assigned to the spin-allowed crystal-field excitation from the ground state to the state which are separated by 10 in good agreement with the reported absorption spectra in the FeX3 systems, where = Cs, Rb and =F, Cl, Br Putnik1976 . In these materials a phonon-assisted mechanism has been suggested to explain the observation of the parity-forbidden - transition. A similar mechanism might be at work in iron oxide, however, the spectral weight of the excitation is much larger than expected for a conventional phonon-assisted - transition Sugano1970 . Moreover, the lineshape of this excitation in wüstite looks astonishingly similar to the excitation which has been observed in magnetite at about 5000 cm-1 Park1998 ; Gasparov2000 and analyzed in terms of a polaronic excitation, which has been observed and discussed in many transition-metal systems where electron-phonon coupling plays an important role, such as e.g. manganites Millis1996 ; Hartinger2004 ; Hartinger2006 and cuprates Calvani2001 . Consequently, we tried to describe the lineshape of this excitation in FeO by a small-polaron model Emin1993 , but could not obtain a satisfactory agreement with the data. Nevertheless, we want to recall that, similarly to the case of magnetite, in our sample both Fe2+ and Fe3+ ions are present, and the enhanced spectral weight of the crystal-field excitation in FeO might have its origin in the presence of mixed-valence Fe ions.
The intensity and shape of this excitation in FeO are strongly temperature dependent. At 5 K the conductivity up to 3000 cm-1 is very low and the excitation is narrow and well defined. On increasing temperature it broadens and transfers a significant part of its optical weight to lower frequencies, concomitantly with the increase of the dc conductivity contributions on increasing temperatures. At the same time the phonon intensity becomes strongly reduced a fact that results from the screening of the phonon modes by free charge carriers. In the inset of Fig. 9 we show the spectral weight up to wave numbers of 11000 cm-1 at 5 K and 340 K. The optical weight is given by the integral of the conductivity up to a given frequency.
As expected we find exactly the same optical weight when integrating the conductivity up to frequencies just covering the crystal field excitations, documenting that the optical weight, which is lost by the crystal field excitations indeed is shifted into the dc conductivity at lower frequencies. This fact also provides experimental evidence that a constant number of charge carriers is responsible for the dc conductivity as well as the large spectral weight of the crystal-field excitation. Similarly to magnetite this relation between the crystal-field excitation and the dc conductivity is reminiscent of polaron physics. With increasing temperatures bound polarons become mobile. Shape and temperature dependence of the electronic excitation depicted in Fig. 9 essentially resemble observations in the colossal resistance manganites revealing the melting of polarons into a Fermi liquid state when passing the ferromagnetic transition from above Millis1996 . However there is no one-to one correspondence: In the case of the manganites, mobile polarons establish a metallic low-temperature state, but in wüstite a paramagnetic semiconducting state with strongly increased mobility is formed at high temperatures.
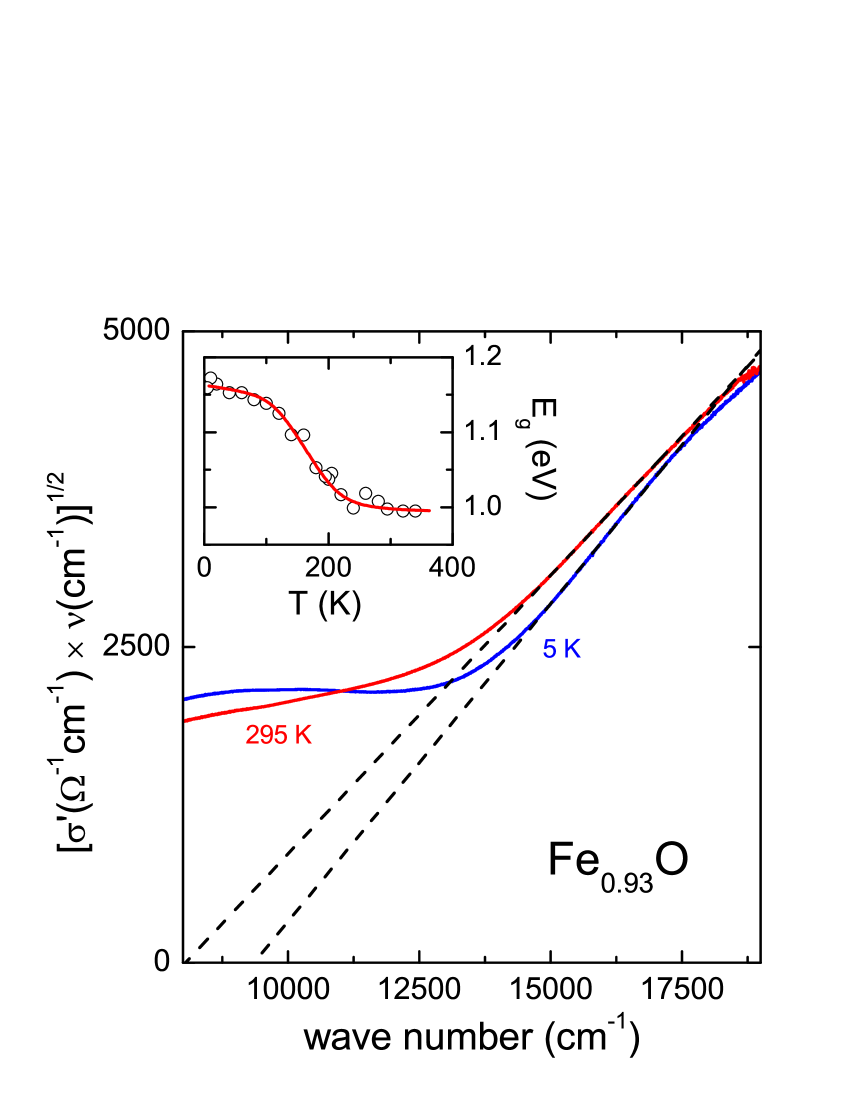
The optical transition across the semiconducting band gap observed close to 12000 cm-1 probably corresponds to a transition from the lower triplet of Fe2+ to the oxygen bands. If this assignment is correct, this transition is a typical charge transfer transition, as predicted to occur in the late transition metal monoxides Zaanen1985 . From an optical absorption experiment Bowen et al. determined a value of 2.4 eV by evaluating the onset of the absorption edge H.K.Bowen1975 , which is in agreement with the theoretical estimate of 2.1 eV Lee1991 . In our data (see Fig. 9) the onset also appears at about 2 eV. We analyzed the slope of this onset and found that the best fits can be obtained assuming an indirect allowed electronic transition Mott1979 , which is documented in Fig. 10 by plotting vs wave number. By extrapolating this behavior (dashed lines) we find a value of the band gap 1.0 eV above the onset of AFM order. Using this extrapolation procedure we want to discuss the temperature dependence of the band-gap as determined from our data in the following.
Blue shift of the fundamental absorption edge
In the inset of Fig. 10 we document the temperature dependence of . The gap energy is constant and approximately 1.0 eV in the paramagnetic phase and reveals a strong increase up to 1.15 eV in the AFM state. This blue shift of the band gap in the magnetically ordered state amounts to approximately 15%.
Shifts of absorption edges upon magnetic ordering have been studied intensively in the case of magnetic semiconductors. Systems dominated by ferromagnetic exchange rather reveal strong red shifts such as e.g. Eu chalcogenides Busch1964 ; Argyle1965 ; Busch1966b ; Suits1966 ; Methfessel1967 ; Busch1967 . or the chromium spinels CdCr2Se4 Busch1966 ; Harbeke1966 ; Harbeke1970 and HgCr2Se4 Lehmann1969 , as well as for ZnCr2Se4 Busch1966 , and HgCr2S4, which order antiferromagnetically but posses strong ferromagnetic exchange interactions Harbeke1968 ; Lehmann1970 . An exception seems to be CdCr2S4, where a blue shift has been observed Busch1966 ; Harbeke1966 , but it has been argued that the evaluated absorption feature is not the fundamental absorption edge, but rather the low-energy flank of a crystal-field excitation Wittekoek1969 ; Berger1969 ; Rudolf2009 . The red shifts in the ferromagnetic semiconductors have been theoretically tackled by Callen Callen1968 using the concept of magnetoelastic coupling, by Baltensperger Baltensperger1970 assuming that magnetic correlations influence the band states via exchange coupling and by Nolting Nolting1977 calculating the influence of the localized Heisenberg spins on the conduction band.
Blue shifts at the AFM phase transition have been reported and analyzed for compounds related to wüstite, namely for -MnS and CoO Chou1974 ; Terasawa1980 , and for hexagonal MnTe FerrerRoca2000 or NaCrS2 Blazey1969 . However, also red shifts can occur as in AFM MnO Chou1974 , and the shift seem to depend strongly on the different exchange interactions and magneto-structural effects and distortions of the particular compound Chou1974 ; Alexander1976 ; FerrerRoca2000 . The question which model is appropriate to explain the significant blue shift in passing the antiferromagnetic phase transition in wüstite remains to be answered.
4 Discussion and concluding remarks
In this work we have provided a detailed study of the optical properties of wüstite with stoichiometry Fe0.93O. In addition we have presented a detailed characterization of the sample with respect to electrical, magnetic, and thermodynamic properties. From electrical resistance experiments we find a purely thermally activated temperature dependence governed by an energy gap of 89 meV at elevated temperatures ( 150 K). At lower temperatures hopping conduction dominates. We conclude that charge transport in wüstite results from charge carriers located in the valence band below a mobility edge. Holes can be created by thermal excitations of electrons into an acceptor level just above the Fermi energy. In dielectric measurements we have determined a limiting high-frequency dielectric constant of 27. Moreover, we found clear indications of a relaxational process similar but significantly weaker when compared to that observed in magnetite Schrettle2010 . One could speculate on charge ordering processes between Fe2+ and Fe3+ or local relaxation phenomena of polar vacancies. However, no evidence of short or long range polar order could be detected in wüstite. For temperatures 80 K the dielectric constant increases to colossal values, a fact that can be explained in terms of Maxwell-Wagner relaxation.
Measurements of the magnetic susceptibility indicate pure Curie-Weiss behavior, indicative of localized moments with a Curie-Weiss temperature of = - 245 K and a magnetic ordering temperature of = 196 K. The temperature dependence of the heat capacity reveals a smeared-out anomaly close to the onset of antiferromagnetic order and could be nicely described by using the spectroscopic data obtained from the optical experiment.
The main focus of this work was dedicated to optical properties. Wüstite behaves like an insulator for temperatures below the Nèel temperature and reveals increasing conductivity contributions for higher temperatures. At 500 K a small Drude component in the conductivity and screening effects of the phonon excitations signal increasing metallic behavior. The observed transverse optical phonon modes have eigenfrequencies close to 325 cm-1. Below the AFM ordering temperature the TO branch splits into two modes with a mode splitting close to 15 cm-1. From reflectivity experiments up to 3 eV we observed the crystal-field excitation of the Fe2+ ions at about 7500 cm-1 yielding a crystal field parameter = 750 cm-1. In addition we provide experimental evidence for two further electronic Fe2+ excitations close to 185 and 490 cm-1 which are interpreted as transitions between the ground-state levels split by spin-orbit coupling. From this observation we conclude that wüstite is characterized by a spin-orbit coupling constant 95 cm-1.
Finally, we found a strong blue shift of the fundamental absorption edge on cooling across the antiferromagnetic phase transition. The blue shift amounts 0.15 eV which is an effect as large as 15%.
Acknowledgement: This work has partly been supported by the DFG via the Transregional Research Collaboration TRR 80 (Augsburg/Munich).
References
- (1) N. F. Mott, Proc. Phys. Soc. A 62, 416 (1949)
- (2) J. Hubbard, Proc. R. Soc. London A 277, 237 (1964)
- (3) R. W. Millar, J. Am. Chem. Soc. 51, 215 (1929)
- (4) H. Bizette and B. Tsai, C.R. Acad. Sci. Paris 217, 390 (1943)
- (5) M. Foex and P. Lebeau, C.R. Acad. Sci. Paris 227, 193 (1948)
- (6) C. G. Shull, W. A. Strauser, and E. O. Wollan, Phys. Rev. 83, 333 (1951)
- (7) W. L. Roth, Phys. Rev. 110, 1333 (1958)
- (8) J. B. Goodenough, Phys. Rev. 171, 466 (1968)
- (9) N. C. Tombs and H. P. Rooksby, Nature 165, 442 (1950)
- (10) T. Rudolf, C. Kant, F. Mayr, and A. Loidl, Phys. Rev. B 77, 024421 (2008)
- (11) C. Kant, T. Rudolf, F. Schrettle, F. Mayr, J. Deisenhofer, P. Lunkenheimer, M. V. Eremin, and A. Loidl, Phys. Rev. B 78, 245103 (2008)
- (12) A. B. Sushkov, O. Tchernyshyov, W. Ratcliff II, S. W. Cheong, and H. D. Drew, Phys. Rev. Lett. 94, 137202 (2005)
- (13) J. Hemberger, T. Rudolf, H. A. von Krug Nidda, F. Mayr, A. Pimenov, V. Tsurkan, and A. Loidl, Phys. Rev. Lett. 97, 087204 (2006)
- (14) J. Hemberger, H. A. K. von Nidda, V. Tsurkan, and A. Loidl, Phys. Rev. Lett. 98, 147203 (2007)
- (15) T. Rudolf, C. Kant, F. Mayr, J. Hemberger, V. Tsurkan, and A. Loidl, Phys. Rev. B 75, 052410 (2007)
- (16) C. Kant, M. Schmidt, Z. Wang, F. Mayr, V. Tsurkan, J. Deisenhofer, and A. Loidl, arXiv:1109.4809v1 (2011)
- (17) Y. Yamashita and K. Ueda, Phys. Rev. Lett. 85, 4960 (2000)
- (18) O. Tchernyshyov, R. Moessner, and S. L. Sondhi, Phys. Rev. Lett. 88, 067203 (2002)
- (19) C. Kant, F. Mayr, T. Rudolf, M. Schmidt, F. Schrettle, J. Deisenhofer, and A. Loidl, Eur. Phys. J. Special Topics 180, 43 (2010)
- (20) C. A. McCammon and L.-g. Liu, Phys. Chem. Minerals 10, 106 (1984)
- (21) C. A. McCammon, J. Magn. Magn. Mater. 104-107, Part 3, 1937 (1992)
- (22) D. S. Tannhauser, J. Phys. Chem. Solids 23, 25 (1962)
- (23) G. H. Geiger, R. L. Levin, and J. B. Wagner, Jr., J. Phys. Chem. Solids 27, 947 (1966)
- (24) H. K. Bowen, D. Adler, and B. H. Auker, J. Solid State Chem. 12, 355 (1975)
- (25) N. F. Mott, Phil. Mag. 19, 835 (1969)
- (26) N. F. Mott, Rev. Mod. Phys. 50, 203 (1978)
- (27) N. F. Mott, Phil. Mag. 26, 1015 (1972)
- (28) F. Schrettle, S. Krohns, P. Lunkenheimer, V. A. M. Brabers, and A. Loidl, Phys. Rev. B 83, 195109 (2011)
- (29) P. Lunkenheimer, V. Bobnar, A. V. Pronin, A. I. Ritus, A. A. Volkov, and A. Loidl, Phys. Rev. B 66, 052105 (2002)
- (30) J. C. Maxwell, Treatise on Electricity and Magnetism, volume 1, Oxford University Press, London (1873)
- (31) K. W. Wagner, Annalen der Physik 345, 817 (1913)
- (32) P. Lunkenheimer, M. Resch, A. Loidl, and Y. Hidaka, Phys. Rev. Lett. 69, 498 (1992)
- (33) A. Pimenov and A. Loidl, Phys. Rev. B 50, 4204 (1994)
- (34) R. Fichtl, V. Tsurkan, P. Lunkenheimer, J. Hemberger, V. Fritsch, H. A. K. von Nidda, E. W. Scheidt, and A. Loidl, Phys. Rev. Lett. 94, 027601 (2005)
- (35) S. R. Elliott, Advances in Physics 36, 135 (1987)
- (36) M. P. J. van Staveren, H. B. Brom, and L. J. de Jongh, Physics Reports 208, 1 (1991)
- (37) S. Emmert, M. Wolf, R. Gulich, S. Krohns, S. Kastner, P. Lunkenheimer, and A. Loidl, Eur. Phys. J. B 83, 157 (2011)
- (38) S. M. Ariya and G. Grossman, J. Inorg. Chem. USSR 1, 34 (1956)
- (39) F. B. Koch and M. E. Fine, J. Appl. Phys. 38, 1470 (1967)
- (40) G. Srinivasan and M. S. Seehra, Phys. Rev. B 28, 6542 (1983)
- (41) F. F. Y. Wang and M. Kestigian, J. Appl. Phys. 37, 975 (1966)
- (42) F. F. Y. Wang, D. E. Cox, and M. Kestigian, Phys. Rev. B 3, 3946 (1971)
- (43) T. Moriya, K. Motizuki, J. Kanamori, and T. Nagamiya, J. Phys. Soc. Jpn. 11, 211 (1956)
- (44) W. Low and M. Weger, Phys. Rev. 118, 1119 (1960)
- (45) A. Abragam and B. Bleaney, Electron paramagnetic resonance of transition ions, Dover Publications, New York (1986)
- (46) J. Kanamori, Prog. Theor. Phys. 17, 177 (1957)
- (47) S. S. Todd and K. R. Bonnickson, J. Am. Chem. Soc. 73, 3894 (1951)
- (48) R. Mainard, M. Boubel, and H. Fousse, C.R. Acad. Sci. Paris 266, 1299 (1968)
- (49) F. Grønvold, S. Stølen, P. Tolmach, and E. F. Westrum, JR., J. Chem. Thermodyn. 25, 1089 (1993)
- (50) S. Stolen, R. Glockner, F. Gronvold, T. Atake, and S. Izumisawa, Amer. Mineral. 81, 973 (1996)
- (51) B. Prévot, J. Biellmann, M. F. Meftah, and M. Sieskind, Phys. Status Solidi A 40, 503 (1977)
- (52) T. Henning and H. Mutschke, Astron. and Astrophys. 327, 743 (1997)
- (53) C. T. Seagle, W. Zhang, D. L. Heinz, and Z. Liu, Phys. Rev. B 79, 014104 (2009)
- (54) S. Massidda, M. Posternak, A. Baldereschi, and R. Resta, Phys. Rev. Lett. 82, 430 (1999)
- (55) W. Luo, P. Zhang, and M. L. Cohen, Solid State Commun. 142, 504 (2007)
- (56) G. Kugel, C. Carabatos, B. Hennion, B. Prevot, A. Revcolevschi, and D. Tocchetti, Phys. Rev. B 16, 378 (1977)
- (57) W. Low and M. Weger, Phys. Rev. 118, 1130 (1960)
- (58) C. F. Putnik, G. M. Cole, B. B. Garrett, and S. L. Holt, Inorg. Chem. 15, 826 (1976)
- (59) S. Sugano, Y. Tanabe, and H. Kamimura, Multiplets of transition-metal ions in crystals, Academic Press, New York (1970)
- (60) S. K. Park, T. Ishikawa, and Y. Tokura, Phys. Rev. B 58, 3717 (1998)
- (61) L. V. Gasparov, D. B. Tanner, D. B. Romero, H. Berger, G. Margaritondo, and L. Forró, Phys. Rev. B 62, 7939 (2000)
- (62) A. J. Millis, R. Mueller, and B. I. Shraiman, Phys. Rev. B 54, 5405 (1996)
- (63) C. Hartinger, F. Mayr, J. Deisenhofer, A. Loidl, and T. Kopp, Phys. Rev. B 69, 100403(R) (2004)
- (64) C. Hartinger, F. Mayr, A. Loidl, and T. Kopp, Phys. Rev. B 73, 024408 (2006)
- (65) P. Calvani, Rivista del nouvo Cimento 24, 1 (2001)
- (66) D. Emin, Phys. Rev. B 48, 13691 (1993)
- (67) J. Zaanen, G. A. Sawatzky, and J. W. Allen, Phys. Rev. Lett. 55, 418 (1985)
- (68) G. Lee and S. J. Oh, Phys. Rev. B 43, 14674 (1991)
- (69) N. F. Mott and E. A. Davis, Electronic Processes in Non-Crystalline Materials, Clarendon Press, Oxford (1979)
- (70) G. Busch, P. Junod, and P. Wachter, Physics Letters 12, 11 (1964)
- (71) B. E. Argyle, J. C. Suits, and M. J. Freiser, Phys. Rev. Lett. 15, 822 (1965)
- (72) G. Busch and P. Wachter, Phys. kondens. Materie 5, 232 (1966)
- (73) J. C. Suits, B. E. Argyle, and M. J. Freiser, J. Appl. Phys. 37, 1391 (1966)
- (74) S. Methfessel, M. J. Freiser, G. D. Pettit, and J. C. Suits, J. Appl. Phys. 38, 1500 (1967)
- (75) G. Busch, J. Appl. Phys. 38, 1386 (1967)
- (76) G. Busch, B. Magyar, and P. Wachter, Physics Letters 23, 438 (1966)
- (77) G. Harbeke and H. Pinch, Phys. Rev. Lett. 17, 1090 (1966)
- (78) G. Harbeke and H. W. Lehmann, Solid State Commun. 8, 1281 (1970)
- (79) H. W. Lehmann and F. P. Emmenegger, Solid State Commun. 7, 965 (1969)
- (80) G. Harbeke, S. B. Berger, and F. P. Emmenegger, Solid State Commun. 6, 553 (1968)
- (81) H. W. Lehmann and G. Harbeke, Phys. Rev. B 1, 319 (1970)
- (82) S. Wittekoek and P. F. Bongers, Solid State Commun. 7, 1719 (1969)
- (83) S. B. Berger and L. Ekstrom, Phys. Rev. Lett. 23, 1499 (1969)
- (84) T. Rudolf, C. Kant, F. Mayr, M. Schmidt, V. Tsurkan, J. Deisenhofer, and A. Loidl, Eur. Phys. J. B 68, 153 (2009)
- (85) E. Callen, Phys. Rev. Lett. 20, 1045 (1968)
- (86) W. Baltensperger, J. Appl. Phys. 41, 1052 (1970)
- (87) W. Nolting, Phys. Status Solidi B 79, 573 (1977)
- (88) H.-h. Chou and H. Y. Fan, Phys. Rev. B 10, 901 (1974)
- (89) H. Terasawa, T. Kambara, K. I. Gondaira, T. Teranishi, and K. Sato, Journal of Physics C: Solid State Physics 13, 5615 (1980)
- (90) C. Ferrer-Roca, A. Segura, C. Reig, and V. Munoz, Phys. Rev. B 61, 13679 (2000)
- (91) K. W. Blazey and H. Rohrer, Phys. Rev. 185, 712 (1969)
- (92) S. Alexander, J. S. Helman, and I. Balberg, Phys. Rev. B 13, 304 (1976)