Ab-initio study of the relation between electric polarization and electric field gradients in ferroelectrics
Abstract
The hyperfine interaction between the quadrupole moment of atomic nuclei and the electric field gradient (EFG) provides information on the electronic charge distribution close to a given atomic site. In ferroelectric materials, the loss of inversion symmetry of the electronic charge distribution is necessary for the appearance of the electric polarization. We present first-principles density functional theory calculations of ferroelectrics such as BaTiO3, KNbO3, PbTiO3 and other oxides with perovskite structures, by focusing on both EFG tensors and polarization. We analyze the EFG tensor properties such as orientation and correlation between components and their relation with electric polarization. This work supports previous studies of ferroelectric materials where a relation between EFG tensors and polarization was observed, which may be exploited to study the ferroelectric order when standard techniques to measure polarization are not easily applied.
I Introduction
There is great interest in ferroelectric/multiferroic materials nowadays due to their potential application in a plethora of subjects, ranging from high density memories to magnetoelectric sensors. *[][andreferencestherein.]Khomskii2009; Cheong2007 ; Bersuker2012 The complexity of electronic phenomena at the nanoscale makes them a hot research topic and a fertile ground for new experimental techniques, which are able to probe point-like, atomic-scale properties. To this aim, the use of local probes as in hyperfine interactions techniques, such as Mössbauer effect spectroscopy, perturbed angular correlation (PAC) spectroscopy, nuclear magnetic resonance (NMR), and nuclear quadrupole resonance (NQR), give access to atomic scale information of the electronic charge density Schatz1996 through the measure of the electric field gradients (EFGs), thus probing the phenomenology of materials at the nanoscale.
From a theoretical point of view, advances in modern density functional theory have made the calculation of the spontaneous electric polarization a routine calculation in an ab initio framework. Rabe2007 ; King-Smith1993 ; Resta1994 Recently, the calculation of EFGs has become also possible from first-principles. Blaha1985 ; Blaha1987 ; Blaha1988 ; Blaha1989 ; Ambrosch-Draxl1989 ; Ambrosch-Draxl1991 ; Blaha1992 However, to the best of our knowledge, a theoretical study based on ab-initio density functional methods aiming to investigate both the and EFGs in a ferroelectric material is still missing in the current literature despite the fact that a linear correlation Oja1969 ; Fitzgerald1970 ; Fitzgerald1973 between and EFG values at a given site was shown a long time ago. This “correlation” would suggest that information obtained through the measurements of EFG tensors can provide indirect access to the polarization as well. If true, one could study a macroscopic property of the crystal, such as by using local probes. In this work, we want to explore such a possibility.
A nucleus with a nonspherical nuclear charge distribution possesses an electric quadrupole moment which leads to a hyperfine splitting for a nuclear spin if subjected to an EFG. The hyperfine techniques previously mentioned can measure the quadrupole coupling constant, which is the interaction between the nuclear quadrupole moment and the EFG. The EFG, in turn, arises due to the Coulomb potential at the nucleus, and its measurement is sensitive to the surrounding electronic charge density. More precisely, it is defined as the symmetric traceless second-rank tensor of second derivatives of the Coulomb potential with respect to the spatial coordinates, , at the nuclear position. In the principal axis coordinate system, the tensor is diagonal and its elements are usually ordered by the convention . Usually and the asymmetry parameter are used in the analysis of measurements. We recall that the EFG is site dependent, and its principal axes (,,) may not be the same at every site, although they are usually along symmetry axes of the crystal. EFG studies are found in various types of materials, for example, intermetallics, Haarmann2011 metal complexes, Bjornsson2010 magnetic, Asadabadi2007 or multiferroic compounds. Lopes2011
Previous studies have shown that in some ferroelectric materials follows a temperature dependence which can be related to the EFG at specific atomic sites. For instance, NMR using 23Na in Rochelle salts [NaK(tartrate)4H2O] showed that and the EFG are linearly related. Oja1969 ; Fitzgerald1970 ; Fitzgerald1973 In 1978 Yeshurun suggested Yeshurun1978 that the EFG due to static displacements should be proportional to in perovskite crystals using an empirical model for interpreting previous 57Fe Mössbauer measurements in BaTiO3. Bhide1966 Dynamical aspects were also considered by relating the EFG to the electric susceptibility, and it was found that the EFG should have a critical behavior when approaching . Yeshurun1978 This peculiar feature was recently used in the identification of ferroelectricity with EFG measurements. Lopes2008 In this work, Pr1-xCaxMnO3 was studied with the measurement of the EFG at 111mCd probes implanted into the sample. An abrupt change was found in a short temperature interval. This was associated to the onset of ferroelectricity, since the EFG should be dominated by a contribution proportional to the electric susceptibility at the transition, i.e., with its critical behavior. Yeshurun1978 In the same work, Lopes2008 it was also suggested that the temperature dependence of EFG tensors can give information on the onset of charge or orbital ordering. In Ref. Dening1980, it was argued that the static part of should have the following behavior with respect to : either it is proportional to in sites which have inversion symmetry in the paraelectric structure, or it is proportional to , like in Rochelle salts. The quadratic relation was supported by experiments in NaNO2, Dening1980 in PbHfO3 not too close to (where critical behavior is found), by PAC measurements, Yeshurun1979 ; Schatz1996 and by NMR measurements in BaTiO3. Kanert1994 It is therefore clear from the current literature that and the EFG tensor are closely related quantities.
Our study aims to explore this relationship by calculating both and EFG for simple ferroelectric materials and studying a possible correlation between these quantities. Some of the previously mentioned results are obtained by impurity probes in the host materials. Here, we shall limit our studies to systems where the probes are natural constituents of the materials.
This work is organized as follows. In Sec. II we discuss the computational details. In Sec. III.1 we present the results and discuss the relationship between and EFGs for simple tetragonal or orthorhombic (Sec. III.2) systems. We analyze the possible linear correlations between EFG tensor components in Sec. III.3. A study of the variation of with the atomic numbers of different materials is shown in section IV. Finally, in Sec. V we draw our conclusions.
II Technical details
We have considered a series of simple O3 type perovskite compounds. King-Smith1994 For BaTiO3, PbTiO3 and KNbO3 we have considered the tetragonal experimental structures as references. We also considered other perovskite-related compounds, such as BaZrO3, CaTiO3, PbZrO3, SrTiO3, NaNbO3 and LiNbO3 by considering a pseudo-cubic phase at the experimental lattice constants of the cubic paraelectric phase. The ferroelectric distortion was mimicked by a polar displacement of the atoms. The experimental displacements in tetragonal BaTiO3 are , , and , in fractional coordinates. Kwei1993 We calculate the EFG as a function of , which represents the fraction of the displacements (, , ) mentioned above. Therefore corresponds to the equilibrium (experimental) structure. Values of are used, i.e., corresponds to undistorted, corresponds to the experimental equilibrium distortion (at 280 K) and corresponds to 20% additional distortion. For the compounds where the cubic structure is used, a ferroelectric state is considered using the same fractional distortions as in BaTiO3. Although these states may not be observed in normal conditions, this allows us to study the possible correlation of polarization and EFG in different systems or as a function of strain.
| Compound | ||||||
|---|---|---|---|---|---|---|
| BaTiO3a | 4.00 | 4.03 | 0.02 | -0.03 | -0.01 | |
| KNbO3 b,c | 4.00 | 4.06 | 0.02 | 0.04 | 0.04 | |
| PbTiO3 d,e | 3.90 | 4.16 | 0.04 | 0.11 | 0.12 | |
| BaZrO3f | 4.19 | |||||
| CaTiO3f | 3.83 | |||||
| NaNbO3f | 3.94 | |||||
| PbZrO3f | 4.13 | |||||
| SrTiO3f | 3.91 | |||||
| LiNbO3g | 4.00 |
-
a
Reference Kwei1993, .
-
b
Reference Hewat1973, .
-
c
Reference Shirane1954, .
-
d
Reference Mabud1979, .
-
e
Reference Nelmes1985, .
-
f
Cubic lattices, experimental values (Ref. King-Smith1994 ).
-
g
Theoretical lattice parameter, found by the volume optimization in the cubic phase, with atoms at the ideal positions.
For the density functional theory calculations we used the projector-augmented-wave (PAW) method, Blochl1994 as implemented in the Vienna ab-initio simulation package (VASP), Kresse1996 with the generalized gradient approximation (GGA)-Perdew, Burke and Ernzerhof (PBE) functional. Perdew1996 We used a -centered Monkhorst-Pack -points grid, and an energy cutoff of 400 eV. The polarization is calculated with the Berry phase approach. King-Smith1993 ; Resta1994 The EFG is calculated at the atomic sites , , apical O1, and equatorial O2 sites.
For the case of BaTiO3 we also performed calculations with the L/APW+lo method, implemented in the WIEN2k code. WIEN2k The basis set was limited by , where stands for the product of the smallest atomic sphere radius times the largest -vector of the plane wave expansion of the wave function, and a -points grid was used.
III Results and discussion
III.1 Relation between EFGs and
The lattice constants are shown in table 1, along with the experimental atomic distortions in the ferroelectric compounds BaTiO3, KNbO3, and PbTiO3. For the other cases, we have considered the fractional distortion of BaTiO3.
Let us start by considering the case of BaTiO3. The variation of the total energy with the atomic distortions is shown in Fig. 1, with the displacements considered along the polar axis in both directions. The curve shows the expected double well profile. The energy minimum is reached for 85% of the experimental distortion: the slight discrepancy is probably due to the approximation used here for the exchange-correlation functional. Given that both the experimental/theoretical displacements are very small, this discrepancy is reasonable. Note1 In all the following cases, the vertical dashed and dotted lines correspond to the theoretical energy minimum and the experimental distortions, respectively. The stable state has an energy lower than the undistorted one by meV, which compares well with previous calculations.
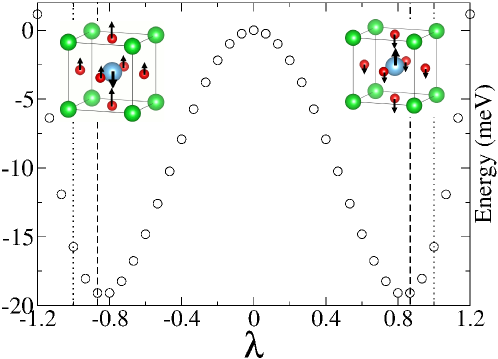
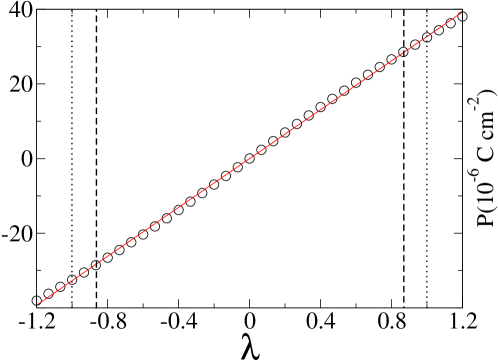
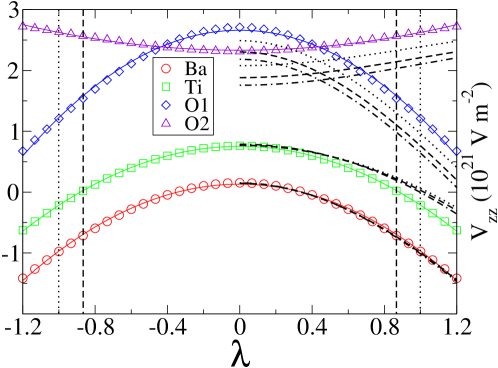
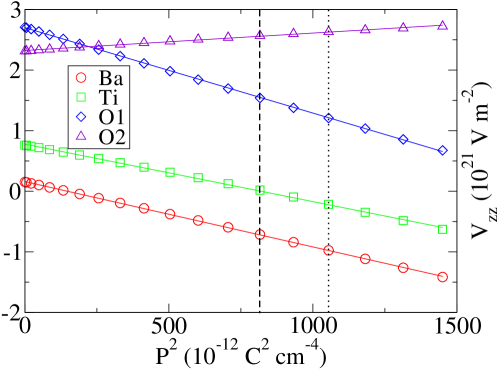
Figure 1 presents as a function of the ferroelectric distortion. It can be seen that is approximately a linear function of the distortion. This is not unexpected since we are considering displacive type ferroelectrics, as already discussed in previous works. Resta1993 The calculated at the experimental distortions is C cm-2, according to what can be seen in Fig. 1, while the experimental one Wieder1955 is C cm-2.
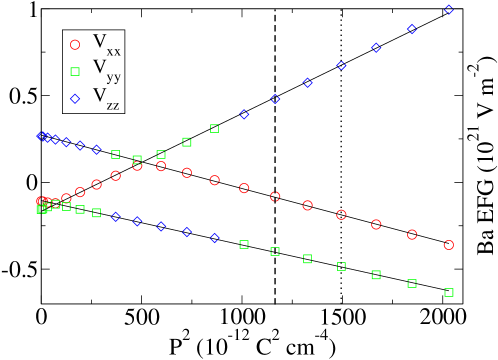
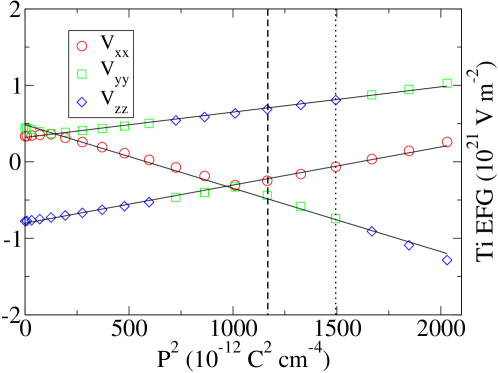
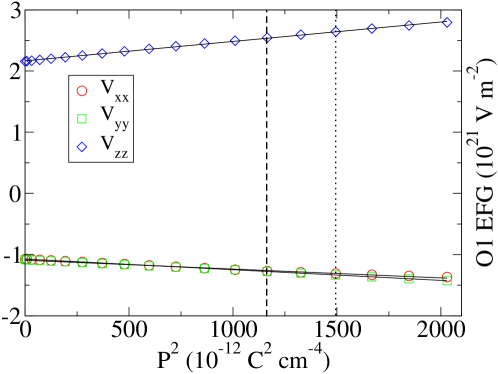
In Fig. 1 we show the EFG component as a function of distortion for all sites. Note2 It is evident that shows a quadratic dependence upon the distortion. The sign Koch2009 and magnitude of the values obtained are consistent with previous calculations. Alonso2004 ; Koch2009 Measurements Blinc2008 obtained at the O sites by NMR are in agreement for the equatorial site with , but at the apical site the experimental value is while our calculated value is smaller, (all in units of V m-2).
Furthermore, we investigated how the EFG results depend on the choice of method or functional [see fig. 1]. We have performed calculations using the L/APW+lo implementation of DFT, with the WIEN2k code. Three different functionals were used, which are represented in the plot by dotted, dashed, and dot-dashed lines, corresponding to the GGA-PBE, Perdew1996 GGA-Wu and Cohen (WC), Wu2006 and local-density approximation (LDA) Perdew1992 exchange-correlation functionals. The variation of EFG with distortion is the same, except for a small difference at Ti between the two implementations. There is also a shift in values at the O atoms, with a maximum difference of V m-2, when comparing LDA L/APW+lo and PBE PAW calculations, while maintaining the same variation with distortion. These differences are reasonable and the main feature, quadratic variation of with distortion, remains the same. All the following results are taken from the PAW calculations.
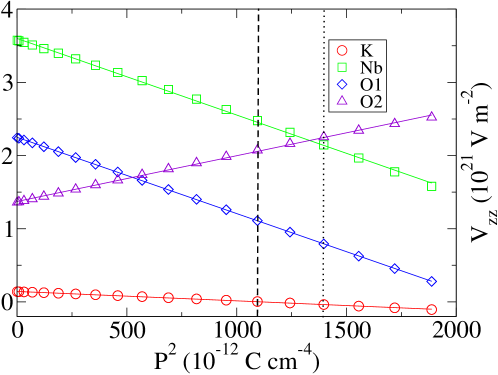
In order to get rid of the distortion parameter, in Fig. 1 we plot the EFG component as a function of . In this case, a fit of the data clearly shows a linear dependence.
For KNbO3 the trends are similar, and a linear relation is also obtained in Fig. 2. In this case, the calculated value of at the experimental distortion is C cm-2, consistent with the measured value. Resta1993 The calculated at Nb, V m-2 is also consistent with V m-2 obtained by an NMR experiment at C (Ref. Hewitt1961, ) [considering (Ref. Stone2005, )].
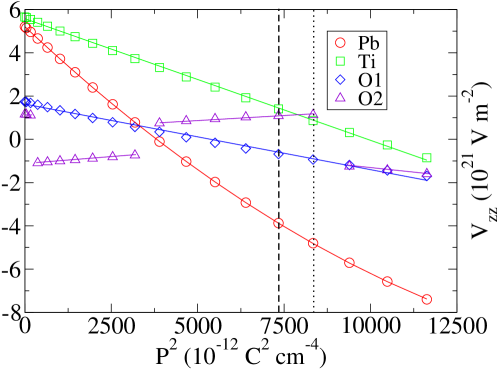
For the case of PbTiO3, presented in Fig. 2, much larger values of polarization are obtained. The polarization is () at the calculated (experimental) distortion, higher than the measured Hewat1973 C cm-2 at room temperature. Notably large variations of the EFG in the range of distortions are seen at the Pb and Ti sites. The obtained values of are in reasonable agreement with Ti NMR experiments (Table 3 of Ref. Padro2002, ) (better agreement is seen considering the calculation of minimum energy). at the O2 site has discontinuous changes, but the EFG tensor is continuous, as will be shown later.
The coefficients in the expression obtained are shown in Table 2, for all the atoms in the unit cell of all compounds considered. At the , , and apical O1 atoms, the relation found in almost all the compounds considered here is . However, since these sites have , the tensor is defined by only one independent parameter. , and the quadratic coefficients also follow the same symmetry . The equatorial oxygen sites (O2) do not have an -fold rotation axis with . This implies that the asymmetry parameter is not zero. In this case the coefficients of describing the variation of the EFG tensor do not show such a simple relation.
| BaTiO3 | KNbO3 | PbTiO3 | BaZrO3 | CaTiO3 | PbZrO3 | SrTiO3 | NaNbO3 | LiNbO3 | ||||||||||
|---|---|---|---|---|---|---|---|---|---|---|---|---|---|---|---|---|---|---|
| A | 0.16 | -1.079 | 0.14 | -0.128 | 5.28 | -1.787a | 0.00 | -0.945 | 0.00 | -0.186 | -0.01 | -1.911 | 0.00 | -0.551 | 0.00 | -0.077 | 0.00 | -0.012 |
| B | 0.78 | -0.949 | 3.60 | -1.046 | 5.58 | -0.562 | 0.00 | -0.757 | 0.01 | -0.724 | -0.02 | -0.985 | 0.01 | -0.834 | 0.00 | -0.163 | 0.00 | -0.311 |
| O1 | 2.70 | -1.410 | 2.25 | -1.042 | 1.63 | -0.303 | -1.43 | -1.124 | -0.11 | -1.025 | -3.61 | -1.009 | 1.08 | -1.193 | 0.30 | -0.882 | 0.67 | -0.940 |
| O2 | 2.32 | 0.288 | 1.37 | 0.625 | 1.18 | -0.461b | -1.41 | 0.300 | -0.10 | 0.349c | -3.59 | 0.232 | 1.11 | 0.253 | 0.32 | 0.389 | 0.69 | 0.363 |
-
a
An additional quartic term , with V Cm6, is needed to get a satisfactory fit for this atom.
-
b
This coefficient fits a component that is in the paraelectric phase, but is interchanged with other components in the distortion path. An additional quartic term , with V Cm6, is needed to get a satisfactory fit for this atom.
-
c
This coefficient fits a component that is in the paraelectric phase, but is interchanged with with other components in the distortion path. An additional quartic term , with V Cm6, is needed to get a satisfactory fit for this atom.
The variation of the EFG with displacements can be understood by considering a Taylor series expansion,
where are small deviations of the atomic positions relative to the paraelectric structure. When the transition involves small displacements and for atoms where the EFG does not undergo large changes in the transition this expansion should converge rapidly. For sites without inversion symmetry, the linear term should be dominant, whereas for sites with inversion symmetry the linear term vanishes and the quadratic term in the expansion becomes relevant. Dening1980
The Vzz component follows a quadratic variation for all the atoms in all the compounds studied, with only two exceptions, PbTiO3 and CaTiO3. At the O2 sites of PbTiO3 and CaTiO3 there are interchanges of tensor components which make the description of EFG variations in terms of the component inadequate. At the Pb site of PbTiO3 a small quartic term in the polarization is found necessary for a good fit of () (Terms with odd powers of are not allowed due to the inversion symmetry, in the paraelectric structure, of the sites involved in the distortion.)
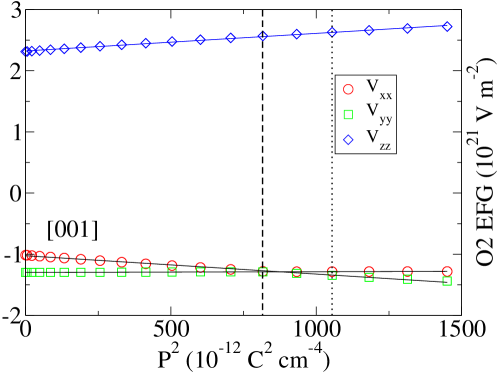
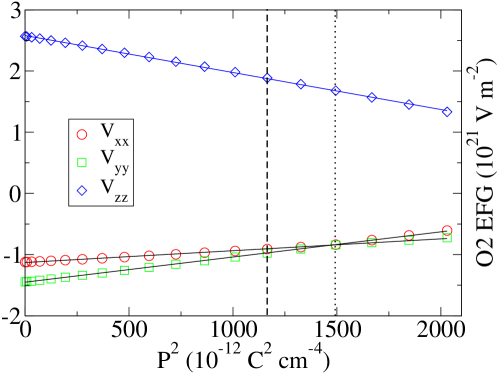
In the paraelectric structure of BaTiO3 the principal component of the tensor for Ba and Ti is directed along the axis. For the O atoms, the EFG tensor is also aligned with the tetragonal crystalline axes, and is directed to the neighboring Ti atoms. For BaTiO3, with increasing ferroelectric distortion (), in all distortions calculated, the direction of remains the same for all atoms. The and components also maintain their directions in this path, for the Ba, Ti and O1 atoms, along the and axes, respectively. For the O2 atoms, however, and do not always correspond to the same orientations. The three components of the EFG tensor for the O2 site in BaTiO3 are shown in Fig. 3. At a given distortion, due to the convention the regular curves followed by these components are interchanged. For distortion the directions for , are and for O2 at (0.5,0,0.5); and for O2 at (0,0.5,0.5). For higher these directions are interchanged. Nevertheless, the quadratic behavior of EFG() is maintained here and this interchange is ignored. Table 3 shows the coefficients of the quadratic terms for the variation of the EFG tensor components at each crystalline axis direction in BaTiO3. Unlike in the case of , the quadratic coefficients do not have the same symmetry as the EFG tensor components.
| Compound | EFG component | ||
|---|---|---|---|
| BaTiO3 | -1.31 | 0.019 | |
| -1.03 | -0.297 | ||
| 2.32 | 0.288 |
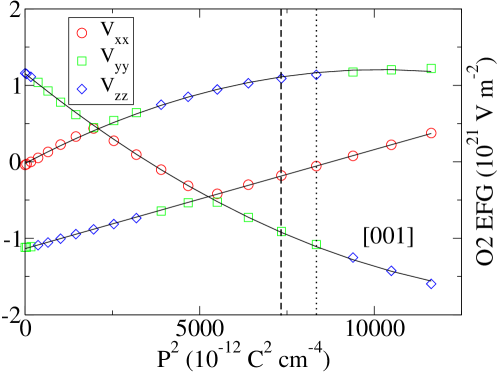
The tensor component interchanges may only happen at the O2 sites, where changes. For BaZrO3, PbZrO3, NaNbO3, LiNbO3 and SrTiO3 there are no interchanges between tensor components, for KNbO3 there is an interchange between and , while for CaTiO3 and PbTiO3 there are exchanges between the three components. For the sake of brevity, we only show here the O2 EFG tensor components for PbTiO3 [Fig. 3], where there are as many as five interchanges of one tensor component in the range of distortions considered. In particular, there is an interchange near the experimental distortion of which one should be aware in EFG measurements, since a kink measured in a dependence could be a consequence of the convention that is the largest EFG component in magnitude, instead of a phase transition.
Moreover, as already mentioned, to obtain a satisfactory fit to at the Pb site a small quartic term should also be considered [Fig. 2]. follows approximately a linear behavior for larger values of . At the O2 site two of the curves of components with constant direction also need quartic terms for a good fit [Fig. 3]. The much larger displacements in this compound would indeed indicate that the expansion does not converge as fast as in other cases. In order to confirm that with larger displacements additional terms must be included in , we performed the calculation of BaTiO3 again, but this time we doubled the size of the distortions, allowing . The variation of the EFG ceases to be properly described by a single quadratic term at the O sites, and an additional term is needed, as expected.
For the other cases there is only an exception in the O2 sites of CaTiO3 where a quartic term is also needed. We point out that CaTiO3 has the smaller unit cell (Table 1), so the ions will be closer with the same in comparison to the other compounds, which may be related to this exception.
In the pseudocubic cases the chosen distortions are arbitrary. Nonetheless, we can conclude from these cases that, for small distortions, a simple quadratic variation of with polarization is seen in several different systems, apart from small deviations.
III.2 Orthorhombic structure
BaTiO3 exhibits monoclinic, rombohedral, and orthorhombic phases at different temperatures. In order to see what are the differences in the EFG and with a change of structure, we have made a series of calculations in the orthorhombic phase. We also took one experimental measurement Kwei1993 of the orthorhombic structure as the reference distortion () and calculated from to of this distortion keeping the lattice parameters (, , ) constant. The theoretical distortion of minimum energy is once again found to be close to 85% of the experimental distortion.
The resolved components of the EFG tensors at the four inequivalent atoms against are displayed in Fig. 4, and the coefficients resulting from the fits are listed in Table 4. In this structure there is not a single site with axial symmetry, and the relationship between EFG and will never be as simple as discussed above. There are also discontinuities in at Ba and Ti sites due to the interchange of components. Nevertheless, ignoring these interchanges, the relation for each direction is purely quadratic in all cases. These results, like the previous ones, show that there is no physical meaning in the change of the principal axis definition (as , , or ), and that the conventional assignment may obscure a simpler relation with crystal axes.
| Ba | Ti | O1 | O2 | |
| -0.17 | -0.80 | 2.17 | -1.13 | |
| 0.563 | 0.498 | 0.318 | 0.193 | |
| -0.11 | 0.48 | -1.07 | -1.45 | |
| -0.256 | -0.829 | -0.174 | 0.411 | |
| 0.27 | 0.32 | -1.09 | 2.58 | |
| -0.307 | 0.331 | -0.144 | -0.605 |
III.3 Correlations between EFG tensor components
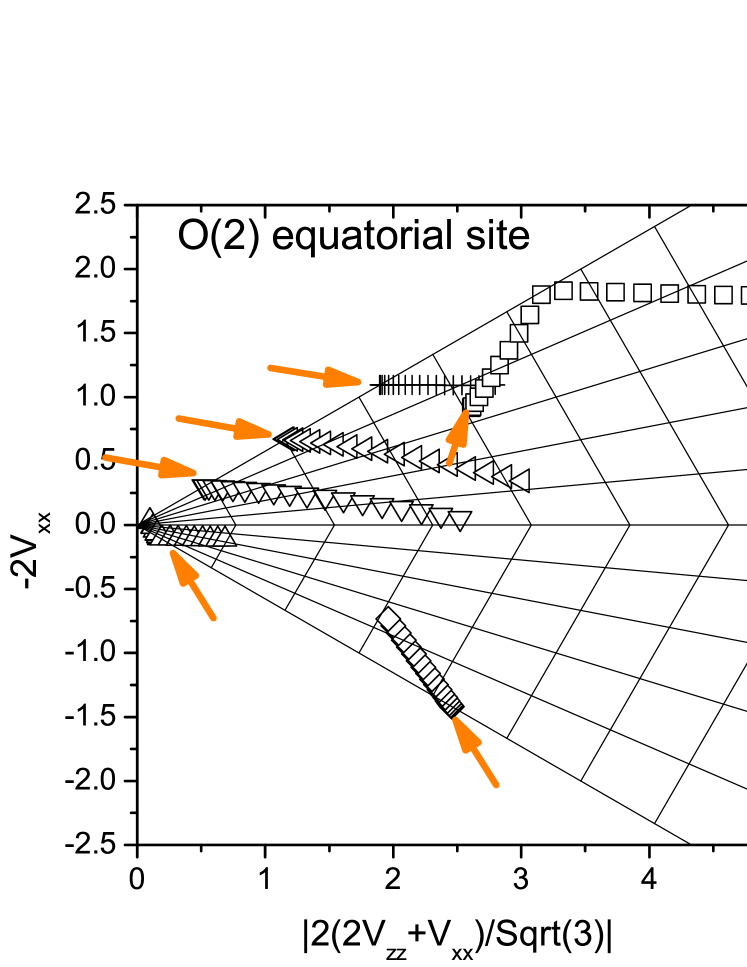
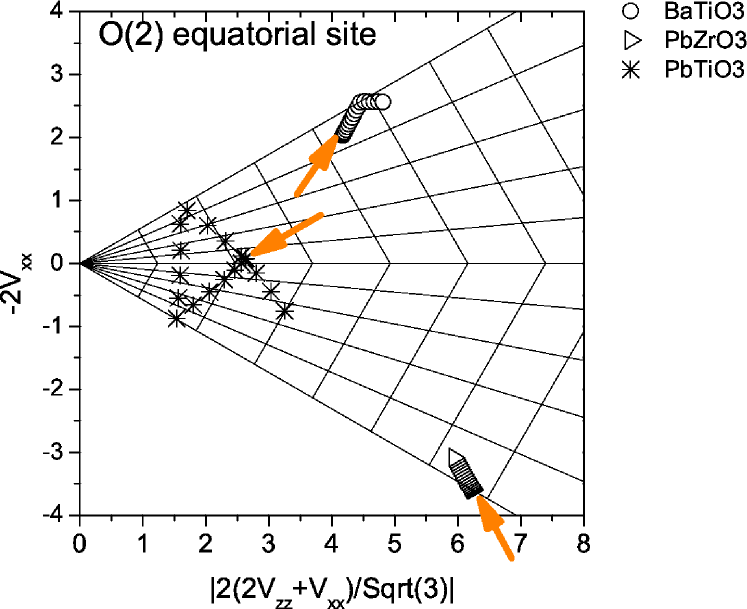
For the cases studied with tetragonal and cubic lattice parameters, only for the O2 atoms. For the components of the EFG are trivially related, but when , the possible correlation between tensor parameters should be studied. The usual parametrization of and assumes uncorrelated EFG components. Instead, correlations between the components of the tensors may be studied in a plot of one component against the other. However, just plotting against results in a distorted cobweb plot, and EFG tensor trajectories obtained by continuous variation of some parameter (temperature, distortion, pressure) may not be continuous (when , changes sign). Czjzek proposed a different system to eliminate these problems, Czjzek1983 initially to deal with the analysis of amorphous systems. However, it is also suited to investigate the correlations between the tensor components. Butz1996 ; Butz2010 This plot uses as a function of . With this linear combination of tensor components, the tractories are always continuous, and are straight lines if there is a linear dependence of on .
The trajectories in the Czjzek plot of all the tetragonal and pseudocubic cases are shown in Fig. 5 for the equatorial oxygen atoms, where changes and a non-trivial correlation may be present. In this plot, the lines of constant are the lines emerging from the origin: the boundary lines correspond to and the horizontal line corresponds to . The herringbone lines correspond to constant . Reflections at the boundary of the plots, seen for example in BaTiO3 and KNbO3, are associated with the interchange of and components previously shown, and the crossing of the trajectory of the line corresponds to a change in sign and orientation of . The equatorial oxygen sites still have axial symmetry () in the paraelectric structure in the cubic structures, since there is four-fold rotation symmetry around the axes connecting the O to the B sites. Therefore, in these cases, the trajectories start at the boundary of the plot. For the tetragonal cases, this symmetry is lost and even in the paraelectric phase: for BaTiO3, for KNbO3 and for PbTiO3. The upper (lower) wedge is for positive (negative) . The values of (O2) change significantly for the different compounds, even changing sign. KNbO3, SrTiO3, LiNbO3 and NaNbO3 always have positive values of , while the zirconates BaZrO3 and PbZrO3 have negative values of in distortions considered. The EFG changes sign in the trajectories of CaTiO3 and PbTiO3. In the case of CaTiO3 the trajectory overlaps with itself. It starts at negative EFG and , then it goes to positive EFGs, in the direction of the arrow, it is reflected and comes back the same way, changing sign again, and finally it is reflected to the horizontal path. In general the positive EFGs increase in absolute value with distortion, while the negative ones decrease. Exceptions in this respect are parts of the trajectories in PbTiO3 and CaTiO3.
The lengths of the trajectories in this plot are presented in Table 5.
| Compound | length | |
|---|---|---|
| BaTiO3 | 1 | 0.92 |
| SrTiO3 | 0.99 | 1 |
| CaTiO3 | 0.85 | 1 |
| BaZrO3 | 0.88 | 0.81 |
| LiNbO3 | 1.91 | 0.63 |
| NaNbO3 | 2.02 | 0.77 |
| PbZrO3 | 0.59 | 0.92 |
| KNbO3 | 2.87 | 1 |
| PbTiO3 | 5.76 | 0.46 |
The lengths are markedly larger for PbTiO3, KNbO3, LiNbO3, and NaNbO3. The cases of PbTiO3 and KNbO3 correspond to different fractional distortions in comparison to the other cases. However, all the other cases have fractional distortions equal to BaTiO3. In this respect, it is interesting to remark that both niobates (LiNbO3 and NaNbO3) have trajectories with approximately twice the length of the others, indicating that the local charge at the O2 atoms is more sensitive to displacements when Nb is the site.
From these plots it is also of interest to determine the “asymptotic” asymmetry parameter (), Butz2010 related to the slope of the trajectories after reflections at the boundaries, corresponding to the limiting value of for a given trajectory. These values are presented in Table 5. It can be seen that is large in most cases, with a smaller value for PbTiO3. It should be related to the different features of the distortion, due to the fact that this compound has ferroelectricity driven by the lone pair of electrons at the Pb ions, while ferroelectricity in other compounds is related to the configuration at the site.
If the trajectories in this plot are straight lines, this shows that the EFG tensor components are linearly related. This is usually the case, except for LiNbO3 and NaNbO3, where the trajectory is approximately straight for low values of , but becomes curved for higher values. The linearity in almost all cases means that the whole tensor, when considering the distortions that give rise to ferroelectric polarization, can be described by a single parameter. This might have important implications on the way experimental data should be analyzed, since the components are not independent, and the combination of all information will be more useful than each of them taken separately. The study of the EFG dependence on temperature (or on other variables) usually done by separating and , can be performed by identifying the global single parameter.
IV Relation between EFG and in different materials
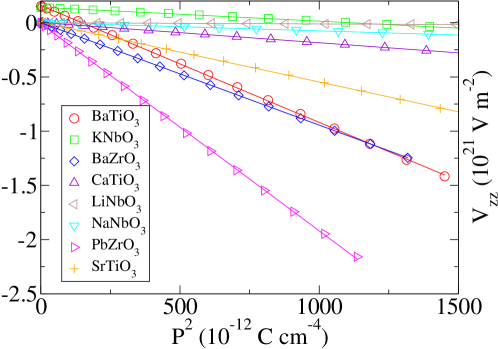
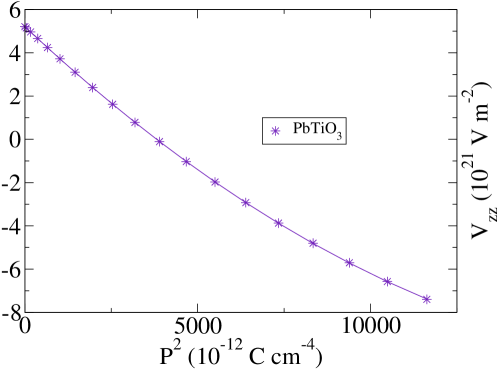
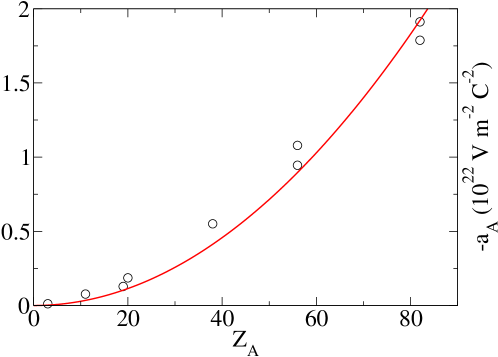
In the following we analyze the relations found in different materials. The quadratic coefficients in the expression follow an interesting trend with atomic number at the sites (), shown in Fig. 6. Figures 6 and 6 show at the site for the different cubic and tetragonal compounds. PbTiO3 introduces larger variations for and which may follow from the larger displacements in the experimental distortion, related, as previously discussed, to the different nature of the ferroelectricity.
is for the paraelectric cubic cases, while for the paraelectric tetragonal structures V has small nonzero values, except PbTiO3. The slopes of the trajectories correspond to the coefficients of the quadratic term, which are shown in Fig. 6. The sites with a larger number of electrons show a larger magnitude of , that follows a quadratic dependence on . There are two pairs of compounds with the same , but different metal sites, namely BaTiO3/BaZrO3, and PbTiO3/PbZrO3. The same trend is still qualitatively followed although small changes in the values of the coefficient are seen, and the changes do not follow a pattern: is higher for Ti than Pb in the cases with Ba, but the opposite happens when Pb. We did not find other trends for the other coefficients, or for , as a function of the atomic number of the different sites.
V Conclusions
In summary, our calculations provide an ab initio support for previous observations of a quadratic dependence of the EFG tensor versus in ferroelectric materials with the perovskite structure and other distorted structures. An exception to this rule is only seen in PbTiO3, at the Pb and equatorial O sites, and in CaTiO3 at the equatorial sites, where an additional quartic term dependence is observed. Moreover, for most cases the local symmetry of the atom means that the EFG tensor is axially symmetric and all the components are trivially related to each other. For the equatorial oxygen atoms this is not the case. Nevertheless, the components of the EFG tensor are also quadratically related to and there is a linear correlation among EFG tensor components for most cases. The relation between and EFGs follows a trend with the atomic number of the site, qualitatively a quadratic variation.
The EFG, working as a local analog of , has the added advantage of higher spatial resolution and short time scales, which allows local probing of nanoscale phenomena at specific lattice sites. The different types of lattice sites, including defects, can be discriminated by their different EFGs. Its critical behavior in phase transitions may be analyzed, and the order of the transitions can be established with a high degree of detail. In hysteresis loops, it can act as a static measurement of the electric polarization in individual domains, not limited by depolarization effects and is much more sensitive to polarization reversal. It is also suited to probe phase coexistence or inhomogeneous polarization states with atomic selectivity, well beyond the reach of conventional polarization measurements. Moreover, piezoelectric force microscopy is usually restricted to studies near the surface of samples, while EFG studies can be performed in bulk or at the surface of materials, by using diffusion, evaporation or implantation techniques to add the probe atoms in the environments to study.
Therefore, we hope this work will stimulate more EFG studies. However, one limitation of our results should be mentioned. In this paper we have analyzed the variation of the EFG with the scaling of the ferroelectric distortions as a whole. However, in experiments, the parameters, such as temperature, in general produce variations involving, for example, additional distortion modes, lattice vibrations, and lattice expansions. The variation of each independent atomic displacement may have a complex variation with changing temperature. Therefore, the relation investigated here can not be directly used to infer polarization variations from EFGs or vice-versa, except in well understood cases. Further work to improve this limitation could involve the study of different structural changes or temperature effects.
Acknowledgments
This work has been supported by the AQUIFER (Aquila Initiative for Ferroics) research program, sponsored by the International Center for Materials Research (ICMR) at UCSB, and research projects PTDC/FIS/105416/2008 and CERN/FP/116320/2010. J. N. Gonçalves acknowledges FCT Grant No. SFRH/BD/42194/2007. The theoretical research at CNR-SPIN has received funding by the European Community’s Seventh Framework Programme FP7/2007-2013 under Grant No. 203523-BISMUTH. A. S. thanks P. Barone for comments on the manuscript. Computational support by CASPUR Supercomputing center in Rome is acknowledged.
References
- (1) D. Khomskii, Physics 2, 20 (2009)
- (2) S.-W. Cheong and M. Mostovoy, Nat. Mater. 6, 13 (2007)
- (3) I. B. Bersuker, Phys. Rev. Lett. 108, 137202 (2012).
- (4) G. Schatz and A. Weidinger, Nuclear Condensed Matter Physics: Nuclear Methods and Applications (Wiley, New York, 1996)
- (5) Physics of Ferroelectrics: A Modern Perspective, edited by K. Rabe, C. H. Ahn, and J.-M. Triscone (Springer, Berlin, 2007)
- (6) R. D. King-Smith and D. Vanderbilt, Phys. Rev. B 47, 1651 (1993)
- (7) R. Resta, Rev. Mod. Phys. 66, 899 (1994)
- (8) P. Blaha, K. Schwarz, and P. Herzig, Phys. Rev. Lett. 54, 1192 (1985)
- (9) P. Blaha and K. Schwarz, J. Phys. F 17, 899 (1987)
- (10) P. Blaha, K. Schwarz, and P. H. Dederichs, Phys. Rev. B 37, 2792 (1988)
- (11) P. Blaha and K. Schwarz, Hyperfine Interact. 52, 153 (1989)
- (12) C. Ambrosch-Draxl, P. Blaha, and K. Schwarz, J. Phys.: Condens. Matter 1, 4491 (1989)
- (13) C. Ambrosch-Draxl, P. Blaha, and K. Schwarz, Phys. Rev. B 44, 5141 (1991)
- (14) P. Blaha, D. J. Singh, P. I. Sorantin, and K. Schwarz, Phys. Rev. B 46, 1321 (1992)
- (15) T. Oja and P. A. Casabella, Phys. Rev. 177, 830 (1969)
- (16) M. E. Fitzgerald and P. A. Casabella, Phys. Rev. B 2, 1350 (1970)
- (17) M. E. Fitzgerald and P. A. Casabella, Phys. Rev. B 7, 2193 (1973)
- (18) F. Haarmann, K. Koch, P. Jeglic̆, H. Rosner, and Y. Grin, Chem.–Eur. J. 17, 7560 (2011)
- (19) R. Bjornsson and M. Bühl, Dalton Trans. 39, 5319 (2010)
- (20) S. Jalali Asadabadi, Phys. Rev. B 75, 205130 (2007)
- (21) A. M. L. Lopes, G. N. P. Oliveira, T. M. Mendonça, J. A. Moreira, A. Almeida, J. P. Araújo, V. S. Amaral, and J. G. Correia, Phys. Rev. B 84, 014434 (2011)
- (22) Y. Yeshurun, Solid State Commun. 27, 181 (1978)
- (23) V. Bhide and M. Multani, Phys. Rev. 149, 289 (1966)
- (24) A. M. L. Lopes, J. P. Araújo, V. S. Amaral, J. G. Correia, Y. Tomioka, and Y. Tokura, Phys. Rev. Lett. 100, 155702 (2008)
- (25) D. C. Dening and P. A. Casabella, J. Magn. Reson. 38, 277 (1980)
- (26) Y. Yeshurun, J. Phys. Chem. Solids 40, 231 (1979)
- (27) O. Kanert, H. Schulz, and J. Albers, Solid State Commun. 91, 465 (1994)
- (28) R. D. King-Smith and D. Vanderbilt, Phys. Rev. B 49, 5828 (1994)
- (29) G. H. Kwei, A. C. Lawson, S. J. L. Billinge, and S.-W. Cheong, J. Phys. Chem. 97, 2368 (1993)
- (30) P. E. Blöchl, Phys. Rev. B 50, 17953 (1994)
- (31) G. Kresse and J. Furthmüller, Phys. Rev. B 54, 11169 (1996)
- (32) J. P. Perdew, K. Burke, and M. Ernzerhof, Phys. Rev. Lett. 77, 3865 (1996)
- (33) P. Blaha, K.Schwarz, G. Madsen, D. Kvasnicka, and J. Luitz, WIEN2k, An Augmented Plane Wave Plus Local Orbitals Program for Calculating Crystal Properties, Techn. Universität Wien, Vienna (2001).
- (34) A. W. Hewat, J. Phys. C 1074, 1074 (1973)
- (35) G. Shirane, R. Newnham, and R. Pepinsky, Phys. Rev. 96, 581 (1954)
- (36) S. A. Mabud, J. Appl. Crystallogr. 12, 49 (1979)
- (37) W. F. Nelmes, Solid State Commun. 54, 721 (1985)
- (38) For KNbO3 and PbTiO3 the same shape of energy curve is obtained with energy differences of and meV and theoretical distortions at and %. For the other compounds the energy minimum is the undistorted phase, as expected, except for LiNbO3 which has a minimum at small values of distortion.
- (39) R. Resta, M. Posternak, and A. Baldereschi, Phys. Rev. Lett. 70, 1010 (1993)
- (40) H. Wieder, Phys. Rev. 99, 1161 (1955)
- (41) For BaTiO and KNbO3 we considered the displacements also in opposite directions, with taking negative and positive values. In other cases the distortion is taken only for the positive direction along the polar axis. In this case, is increasing from 0 to a maximum.
- (42) K. Koch, R. O. Kuzian, K. Koepernik, I. V. Kondakova, and H. Rosner, Phys. Rev. B 80, 125113 (2009)
- (43) R. E. Alonso, C. O. Rodríguez, and A. López García, Phys. Rev. B 69, 212106 (2004)
- (44) R. Blinc, V. V. Laguta, B. Zalar, M. Itoh, and H. Krakauer, J. Phys.: Condens. Matter 20, 085204 (2008)
- (45) Z. Wu and R. E. Cohen, Phys. Rev. B 73, 235116 (2006)
- (46) J. P. Perdew and Y. Wang, Phys. Rev. B 45, 13244 (1992)
- (47) R. Hewitt, Phys. Rev. 121, 42 (1961)
- (48) N. Stone, At. Data Nucl. Data Tables 90, 75 (2005)
- (49) D. Padro, V. Jennings, M. E. Smith, R. Hoppe, P. A. Thomas, and R. Dupree, J. Phys. Chem. B 106, 13176 (2002)
- (50) G. Czjzek, Hyperfine Interact. 14, 189 (1983)
- (51) T. Butz, M. Ceolín, P. Ganal, P. Schmidt, M. A. Taylor, and W. Tröger, Phys. Scr. 54, 234 (1996)
- (52) T. Butz, Phys. Scr. 82, 025702 (2010)