The globular cluster system of NGC1316. I. Wide-field photometry in the Washington system ††thanks: Based on observations obtained at the Cerro Tololo Inter-American Observatory, Chile
Abstract
Context. NGC 1316 (Fornax A) is a prominent merger remnant in the outskirts of the Fornax cluster. The bulge stellar population of NGC 1316 has a strong intermediate-age component. Studies of its globular cluster system may help to further refine its probably complex star formation history.
Aims. The cluster system has not yet been studied in its entirety. We therefore present a wide-field study of the globular cluster system of NGC 1316, investigating its properties in relation to the global morphology of NGC 1316.
Methods. We used the MOSAIC II camera at the 4-m Blanco telescope at CTIO in the filters Washington C and Harris R. We identify globular cluster candidates and study their color distribution and the structural properties of the system. In an appendix, we also make morphological remarks, present color maps, and present new models for the brightness and color profiles of the galaxy.
Results. The cluster system is well confined to the optically visible outer contours of NGC 1316. The total number of cluster candidates down to R=24 mag is about 640. The color distribution of the entire sample is unimodal, but the color distribution of bright subsamples in the bulge shows two peaks that, by comparison with theoretical Washington colors with solar metallicity, correspond to ages of about 2 Gyr and 0.8 Gyr, respectively. We also find a significant population of clusters in the color range 0.8 C-R 1.1 which must be populated by clusters younger than 0.8 Gyr, unless they are very metal-poor. The color interval 1.3 C-R 1.6 hosts the bulk of intermediate-age clusters which show a surface density profile with a sharp decline at about 4′. The outer cluster population shows an unimodal color distribution with a peak at C-R= 1.1, indicating a larger contribution of old, metal-poor clusters. However, their luminosity function does not show the expected turn-over, so the fraction of younger clusters is still significant. We find a pronounced concentration of blue cluster candidates in the area of Schweizer’s (1980) L1-structure.
Conclusions. Cluster formation in NGC 1316 has continued after an initial burst, presumably related to the main merger. A toy model with two bursts of ages 2 Gyr and 0.8 Gyr is consistent with photometric properties and dynamical M/L-values. In this model, the older, metal-rich pre-merger population has an age of 7 Gyr, contributes 90% of the bulge mass and 70% of the luminosity. Its properties are consistent with spiral galaxies, where star-bursts were triggered by major/minor mergers and/or close encounters.
Key Words.:
Galaxies: individual: NGC 1316 – Galaxies: star clusters – Galaxies: peculiar1 Introduction
The study of globular clusters systems (GCSs) is motivated by the hope of finding clues to the formation and history of their host galaxies (for reviews see Brodie & Strader 2006; Harris 2010). Globular cluster (GC) formation occurs in a large variety of star forming environments and at all epochs.
The formation of massive clusters is apparently favored in star bursts as they occur in merger events (e.g. Whitmore & Schweizer 1995; de Grijs et al. 2003b), but one finds GCs also in star-forming disks of normal spiral galaxies where enhanced star formation rates again seem to be related to an enhanced efficiency of massive cluster formation (Larsen & Richtler, 1999, 2000). Against traditional wisdom, intermediate-age globular clusters exist even in the Milky Way (Davies et al., 2011).
The old globular cluster systems of elliptical galaxies exhibit characteristic properties. A striking pattern is the color-bimodality, featuring a blue (bona fide metal-poor) peak and a red (bona fide metal-rich) peak (e.g. Larsen et al. 2001; Kundu & Whitmore 2001).
Since early merger events are believed to be the driver for the formation of elliptical galaxies, the properties of GCSs of known merger remnants may provide more insight into the formation mechanisms.
The nearest merger remnant is NGC 5128 (Cen A) at a distance of 3.8 Mpc. Its stellar population is best described by the bulk of stars (about 80%) being very old, while a younger component (2-4 Gyr) contributes 20%-30% (Rejkuba et al., 2011). The GCS is well investigated regarding kinematics, ages, and abundances (Peng et al., 2004a, b; Woodley et al., 2010b, a). Most GCs are old, but there are also intermediate-age and younger clusters. The kinematics of both planetary nebulae and GCs indicate the existence of a massive dark halo (Woodley et al., 2010b). Cen A is a “double-double” radio galaxy (e.g. Saikia & Jamrozy 2009) with probably recurrent nuclear activity.
Next in distance to Cen A is NGC 1316 (Fornax A) in the outskirts of the Fornax cluster. There is a vast quantity of literature on NGC 1316 with studies in many wavelength bands. We give a representative overview.
The morphology of NGC 1316 is very different from Cen A and is characterized by an inner elliptical body with a lot of fine dust structure in its central region, best admired in HST images, and an extended elongated structure with loops, tails, and tidal arms which cover almost an area on the sky comparable to the full moon. These were first described by Schweizer (1980) in a wide-field photographic study. Schweizer (1981) also noted the high central surface brightness. Furthermore, he performed kinematical measurements and found an abnormally low which in part is a consequence of his large adopted distance of 32.7 Mpc. More modern values are higher, e.g. (Shaya et al., 1996) and (Nowak et al., 2008), but still clearly indicate an intermediate-age population. Schweizer (1980), moreover, detected an inner ionizing rotating disk and a giant HII-region south of the center. He suggested a merger which occurred between 0.5 and 2 Gyr ago.
Mackie & Fabbiano (1998), on the base of deep B-band imaging and imaging in Hα and NII, revisited the morphology and studied the distribution of gaseous line emission. They detected faint emission to the North, between the nucleus and the companion galaxy NGC 1317. They also detected the interesting “Extended Emission Line Region (EELR)”, an elongated feature of length 1.5′South-West to the nucleus at a distance of about 6′, in a region without any signature of ongoing star formation. Using ROSAT data, they detected hot gas apparently associated with Schweizer’s tidal features L1 and L2 (see Fig.2 of Schweizer 1980). Their general assessment of NGC 1316’s history is a disk-disk or disk-E merger older than 1 Gyr and a smaller merger about 0.5 Gyr ago.
Horellou et al. (2001) studied the content of atomic and molecular gas. Molecules are abundant in the central region, but HI has been detected only in some single spots, among them the EELR and the southern HII-region.
NGC 1316 has been observed in the X-rays with practically all X-ray satellites (Einstein: Fabbiano et al. 1992; ROSAT: Feigelson et al. 1995, Kim et al. 1998; ASCA: Iyomoto et al. 1998). More recently, Kim & Fabbiano (2003) used Chandra to constrain the temperature of the hot ISM (0.6 keV), to detect a low-luminosity AGN, and to detect 96 X-ray point sources. They quote a range 0.25 Z⊙ Z 1.3 Z⊙ for the metal-abundance of the ISM. The values derived from Suzaku-data are lower than solar (Konami et al., 2010) (e.g. Fe is only 0.44 solar). NGC 1316 also is among the sample of elliptical galaxies by Fukazawa et al. (2006) who quote X-ray based dynamical masses. Nagino & Matsushita (2009) used XMM-Newton to constrain the gravitational potential.
Kinematics of the stellar population and abundances have been studied by Kuntschner (2000), Thomas et al. (2005), and Bedregal et al. (2006). The luminosity-weighted abundance is higher than solar (Z 0.03).
Arnaboldi et al. (1998) presented kinematics of 43 planetary nebulae and long-slit spectroscopy along the major and the minor axis. They analyzed the velocity field and gave some dynamical considerations, resulting in a total mass of and a mass-to-light ratio in the B-band of 8 within 16 kpc.
Nowak et al. (2008) investigated the very inner kinematics in order to constrain the mass of the supermassive black hole. They found a mass of about marginally consistent with the mass-sigma relation from Tremaine et al. (2002). Noteworthy is the double giant radio lobe with centers in projected galactocentric distances of about 100 kpc (e.g. see Fig.1 of Horellou et al. 2001). Lanz et al. (2010) used mid-infrared and X-ray data to develop a scenario in which the lobes have been created by a nuclear outburst about 0.5 Gyr ago.
Very recently, McNeil-Moylan et al. (2012) presented radial velocities of almost 800 planetary nebulae in NGC 1316, one of the largest samples so far. A spherical Jeans model indicates a high dark matter content, characterized by a dark halo with a large core.
The GCS has been investigated several times with various intentions. Apparently, the first observations devoted to GCs were done using HST (WF/PC-I) (Shaya et al., 1996). These authors list 20 clusters in the very central region. One object has which, if old, today would be called an Ultracompact Dwarf (e.g. Mieske et al. 2008).
More work on GCs, using the HST and the NTT, was presented by Goudfrooij et al. (2001a, b, 2004). Based on infrared colors, they found ages for the brightest clusters consistent with 2-3 Gyrs. The luminosity function (LF) of red GCs was found to be a power law with the exponent -1.2, flatter than that of normal ellipticals, while the blue clusters exhibit the normal LF with a turn-over at about (but see our remarks in Sec.8.3).
At the same time, Gómez et al. (2001) studied the GCS photometrically, using images obtained with the 3.6m telescope on La Silla, ESO, in B,V,I. They did not detect a clear bimodality but a difference in the azimuthal distribution of blue and red clusters in the sense that the red clusters follow the ellipticity of the galaxy’s bulge, while the blue clusters are more circularly distributed. Moreover, they confirmed the very low specific frequency previously found by Grillmair et al. (1999) of .
Our intention is to study the GCS on a larger field than has been done before. Moreover, our Washington photometry permits a useful comparison to the Washington photometry of elliptical galaxies, obtained with the same instrumentation (Dirsch et al., 2003a, b, 2005; Bassino et al., 2006a). We adopt a distance of 17.8 Mpc , quoted by Stritzinger et al. (2010) using the four type Ia supernovae which appeared so far in NGC 1316. The high supernova rate is a further indicator for an intermediate-age population. The surface brightness fluctuation distance (Blakeslee et al., 2009) is Mpc which may indicate a still unsolved zero-point problem.
This paper is the first in a series devoted to NGC 1316 and its globular cluster system. Future papers will treat the kinematics and dynamics of the GCS as well as SH2, the HII-region detected by Schweizer (1980).
2 Observations and reductions
2.1 Data
Since the present data have been taken and reduced together with the data leading to the Washington photometry of NGC 1399 (Dirsch et al., 2003b), all relevant information regarding the reduction technique can be found there. We thus give the most basic information only.
The data set consists of Washington wide-field images of NGC 1316 taken with the MOSAIC camera mounted at the prime focus of the CTIO 4m Blanco telescope during the night 20/21 November 2001 (the entire run had three nights). We used the Kron-Cousins R and Washington C filters. Although the genuine Washington system uses T1 instead of R, Geisler (1996) has shown that the Kron-Cousins R filter is more efficient than T1, due to its larger bandwidth and higher throughput, and that R and T1 magnitudes are closely related, with only a very small color term and a zero-point difference of 0.02 mag.
The MOSAIC wide-field camera images a field of 36′ 36′, with a pixel scale of 0.27″/pixel. The observations were performed in the 16 channel read-out mode. We obtained three R exposures with an exposure time of 600 sec each, and three C-exposures with an exposure time of 1200 sec each. Additionally, we observed standard stars for the photometric calibration. In the following, we refer to colors as C-R and not as C-T1, although the calibration provides Washington colors. The C-images have not been dithered.
The seeing was about 1″ in the R-images and 1.5″ in the C-images.
2.2 MOSAIC reduction and photometry
The MOSAIC data were reduced using the mscred package within IRAF. In particular this software is able to correct for the variable pixel scale across the CCD which would cause otherwise a 4 percent variability of the brightness of stellar-like objects from the center to the corners. The flatfielding resulted in images that had remaining sensitivity variations of the order of 1.5%. In particular Chip 4 and Chip 5 showed discernible remaining flatfield structure (but within the given deviation).
The actual photometry has been performed by using DAOPHOT II.
2.3 Photometric calibration
Standard fields for the photometric calibration have been observed in each of the 3 nights. The weather conditions were photometric. We observed 4-5 fields, each containing about 10 standard stars from the list of Geisler (1996), with a large coverage of airmasses (typically from 1.0 to 1.9). It was possible to use a single transformation for all three nights, since the coefficients derived for the different nights were indistinguishable within the errors. We derived the following relations between instrumental and standard magnitudes:
The standard deviation of the difference between our calibrated and tabulated magnitudes is 0.018 mag in R and 0.027 mag in C.
To calibrate the NGC 1316 field we identified isolated stars which were used to determine the zero points. The scatter between the zero points determined from individual stars is 0.03 mag and most probably due to flat field uncertainties.
The final uncertainties of the zero points are 0.03 mag and 0.04 mag for R and C, respectively. This results in an absolute calibration uncertainty in C-T1 of 0.05 mag (the uncertainty in the color term can be neglected). See, however, Fig. 4 which indicates that the calibration is quite precise in the interval 0.5 C-R 2.5.
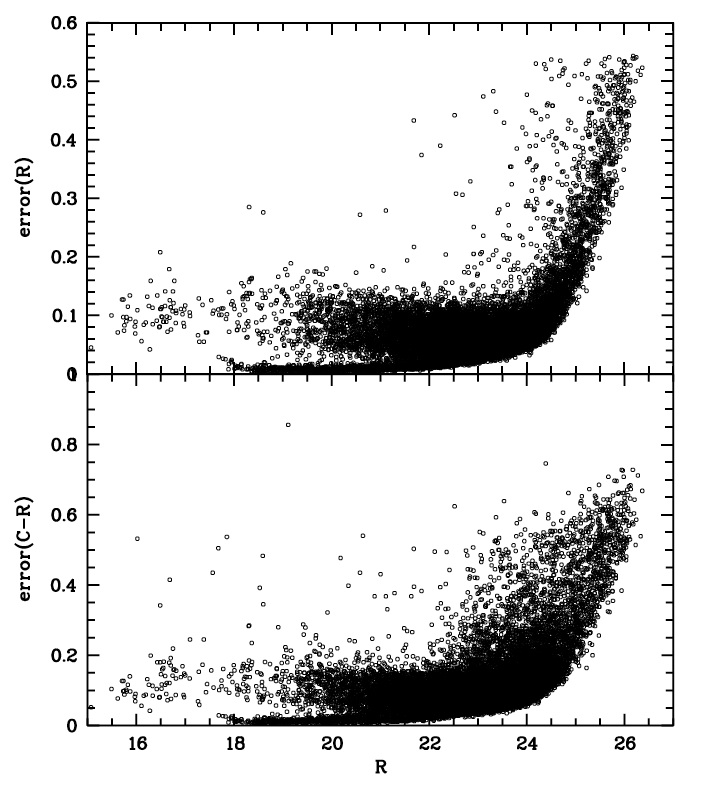
2.4 Photometric uncertainties and selection of point sources
Fig. 1 shows the photometric errors as given by DAOPHOT for all sources. The upper panel shows the uncertainties in R, the lower panel in C-R. The point sources and resolved sources are clearly separated for magnitudes fainter than R=18. Brighter point sources are saturated. The uncertainties in color grow quickly for R 24 mag. However, we want to select GC candidates not only on account of photometric uncertainties, but by goodness of fit and degree of resolution through the ALLSTAR parameters chi and sharp.
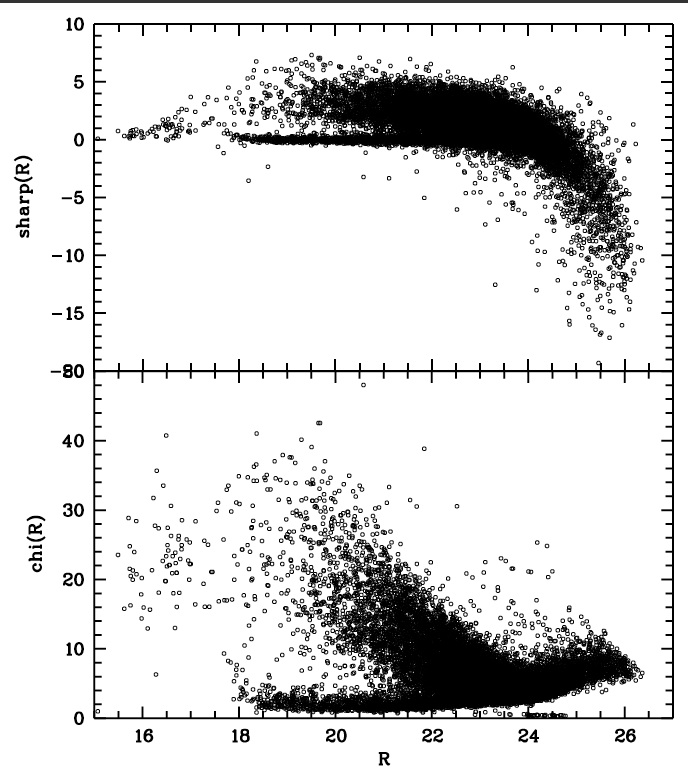
These parameters are plotted in Fig. 2 with sharp in the upper panel and chi in the lower panel. Positive values of sharp indicate resolved objects, negative values deficiencies in the photometry, mainly for the faintest objects. The unsaturated resolved objects are of course galaxies, but we cannot exclude that some extended GCs are among them (see the remark in Section 2.5).
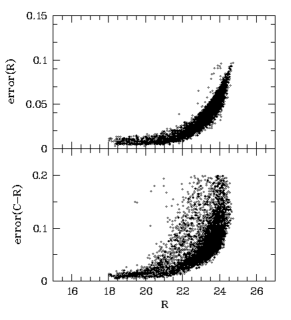
Guided by Fig. 2, we select as point sources objects within the sharp-parameter interval and chi less than 4. We use the R-image due to its better seeing. Furthermore, we select the magnitude interval 18 R 24 and the uncertainties in R and C-R to be less than 0.1 mag and 0.2 mag, respectively. This selection reduces the full sample of about 22000 objects found in the entire field to 4675. The resulting photometric errors for the so selected point sources are shown in Fig.3.
2.5 Comparison with previous photometry
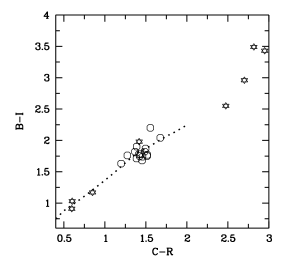
We now compare for confirmed clusters in NGC 1316 our photometry with the B-I photometry of Goudfrooij et al. (2001a). There are 17 clusters and 10 stars for which B-I and C-R colors exist. Our point source selection excludes the object 211 of Goudfrooij et al. which seems to be very extended. Fig.4 shows the comparison. Star symbols denote stars, circles denote clusters. For C-R colors bluer than 2, the agreement is very satisfactory with the exception of one cluster (the object 115 in Goudfrooij at al.’s list). This cluster is projected onto the immediate vicinity of a dust patch which may have influenced its photometry. The stars redder than C-R=2.5 deviate significantly which plausibly shows a deficiency of the photometric calibration which may be not valid for such red objects. The dotted line represents the theoretical integrated single stellar population colors for solar metallicity, taken from Marigo et al. (2008). Again, the agreement is very satisfactory. All clusters (except 115 of Goudfrooij et al. ) are located outside of the inner dust structures. However, only a strong reddening would be detectable. The reddening vector in Fig.4 is E(B-I) = 1.18 E(C-R), adopting the reddening law of Harris & Canterna (1977), thus almost parallel to the (B-I)-(C-R)-relation.
3 The CMD of point sources
The CMD of the selected 4675 point sources is shown in Fig.5 (left panel) together with their location (in pixels; right panel). Visible are the vertical stellar sequences at C-R=0.7 and C-R=3. The bulk of GC candidates are found between C-R=1 and C-R=1.8 for R-magnitudes fainter than 20. There may be also GCs brighter than R=20. The bulge of NGC 1316 is striking. We recall that the optically visible full diameter of NGC 1316 is about 27′, corresponding to 6000 pixels. At first glance there is no bimodality. A more detailed look into color intervals will modify this impression. R=18 mag is approximately the saturation limit for point sources. A comparison with the field around NGC 1399 (Dirsch et al., 2003b) (their Fig.3) shows that the present data are considerably deeper. At a magnitude level of R=24 mag, the incompleteness due to faint sources in C starts at C-R=1.3, while around NGC 1316, it starts at C-R=2.3.
The inner blank region of NGC 1316 shows the incompleteness where the galaxy light gets too bright. To avoid this incompleteness region, we shall consider only GC candidates with distances larger than 2′.
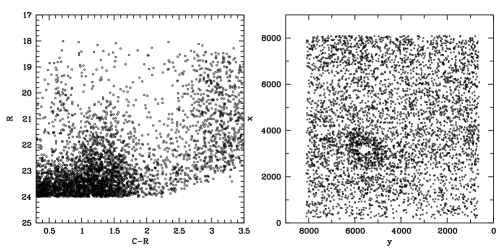
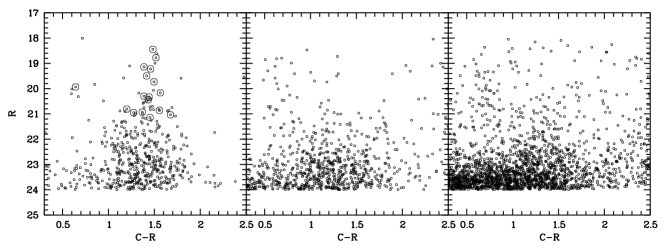
Fig. 6 shows CMDs with three different radius selections (see figure caption). In the inner region (which in fact is blank within the inner 30″; here we consider also clusters closer to the center than 2′) the vertical sequence of bright objects at C-R=1.5 is striking. Some of these GC candidates are already confirmed clusters from the radial velocity sample of Goudfrooij et al. (2001b). Very interesting is the blue object with C-R=0.64 (object 119 in Goudfrooij et al.’s list) which must be quite young, about 0.5 Gyr (see Sec. 8.3), assuming solar metallicity. Two more objects with very red colors, which appear as GCs in the list of Goudfrooij et al. (numbers 122 and 211), are not marked. With R=20.37, C-R = 3.26, and R= 20.77, C-R=3.57, they fall drastically outside the color range of GCs. They are not obviously associated with dust. On our FORS2/VLT pre-images (seeing about 0.5″), used for the spectroscopic campaign, they are clearly resolved and might be background galaxies, in which case the velocities are incorrect.
However, if one bright young cluster exists, then we expect also fainter ones of similar age. We shall show that statistically. The middle panel demonstrates that the occurrence of these bright clusters is restricted to the inner region, but there are still overdensities of GC candidates. The right panel shows almost exclusively foreground stars and background galaxies. We now have a closer look at the distribution of colors.
4 Color distribution
Fig. 7 displays the color distribution in different radial regimes (left: radius 10′; middle: 4′ radius 10′; right: 2 radius 4′) for all magnitudes (R 24 mag)(lower row) , for bright magnitudes (R 22) (upper row), and for an intermediate sample magnitudes (R 23) (middle row). A radius of 4′ approximately marks the extension of the bulge. The ordinates are given in numbers per arcmin2. The corresponding values and their uncertainties are given in Table 1 for the case R 24 mag and in Table 2 for the case R 23 mag.
The counts are background corrected, the background being evaluated outside 13′.
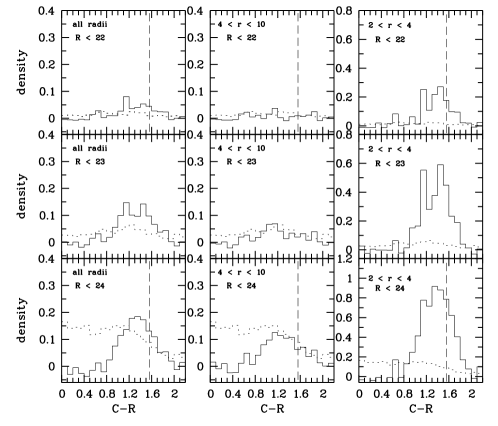
The main observations from Fig.7 are:
– the entire system shows a continuous distribution of colors with no sign of bimodality
– the peak of the color distribution is displaced bluewards with respect to the galaxy color, more so for the outer clusters
– the inner bright clusters show a pronounced bimodality with peaks at C-R=1.4 and C-R=1.1. These peaks are already indicated
in the small, but clean, spectroscopic sample of Goudfrooij et al. (2001a)
– the outer clusters show only a peak a C-R=1.1
– there is evidence for a small GC population bluer than C-R=1.0 which is approximately the metal-poor limit for old clusters (see Fig.14).
The color distribution of GCs in a typical elliptical galaxy in our photometric system is bimodal with two peaks at C-R=1.35 and C-R=1.75 (Bassino et al., 2006b) with little scatter. A Gauss fit to the entire sample in the color range 0.8-2 gives a peak color of and a sigma of which resembles indeed the position of the “universal” blue peak color in the GCS of elliptical galaxies while the distribution is broader. On first sight, this is somewhat surprising since we expect a quite different composition of GCs: there should be a mixture of old GCs from the pre-merger components, and an unknown fraction of GCs, presumably a large one, which stem from one or more star-bursts. Later star forming-events with GC production might also have occurred. The facts that the already confirmed clusters define such a sharp color peak (Fig. 6) and that the existence of intermediate-age clusters has already been shown, strongly suggest that among the bright clusters, intermediate-age objects are dominating. Older clusters are then cumulatively mixed in with decreasing brightness.
The peak color for the outer sample is and for the inner sample . This difference must, in part, be due to a different composition of GC populations since the density of red clusters shows a steeper decline, but we cannot exclude a contribution from differential reddening. However, this must be small since there are hardly any cluster candidates redder than C-R=1.9. Moreover, the excellent reproduction of the theoretical color-color relations in Fig. 4 indicates the absence of strong reddening for this inner sample where we would expect to see reddening effects first.
| Color | background | 2r10 | 4r10 | 2r4 |
|---|---|---|---|---|
| 0.650 | 0.144 0.014 | 0.041 0.028 | 0.026 0.029 | 0.148 0.089 |
| 0.750 | 0.167 0.015 | -0.01 0.026 | -0.01 0.028 | -0.03 0.061 |
| 0.850 | 0.155 0.014 | 0.033 0.028 | 0.023 0.030 | 0.111 0.085 |
| 0.950 | 0.167 0.015 | 0.085 0.032 | 0.064 0.033 | 0.231 0.104 |
| 1.050 | 0.159 0.015 | 0.141 0.034 | 0.083 0.034 | 0.398 0.122 |
| 1.150 | 0.163 0.015 | 0.216 0.038 | 0.113 0.035 | 0.766 0.158 |
| 1.250 | 0.156 0.014 | 0.214 0.037 | 0.089 0.034 | 0.693 0.151 |
| 1.350 | 0.138 0.014 | 0.225 0.037 | 0.084 0.032 | 0.896 0.166 |
| 1.450 | 0.121 0.013 | 0.226 0.036 | 0.087 0.031 | 0.860 0.162 |
| 1.550 | 0.098 0.011 | 0.176 0.032 | 0.053 0.026 | 0.777 0.153 |
| 1.650 | 0.077 0.010 | 0.137 0.028 | 0.063 0.025 | 0.613 0.136 |
| 1.750 | 0.058 0.009 | 0.076 0.022 | 0.025 0.020 | 0.393 0.110 |
| 1.850 | 0.047 0.008 | 0.077 0.021 | 0.055 0.021 | 0.165 0.075 |
| 1.950 | 0.036 0.007 | 0.015 0.015 | 0.005 0.014 | 0.070 0.054 |
| 2.050 | 0.054 0.009 | -0.01 0.014 | -0.00 0.016 | -0.02 0.028 |
| 2.150 | 0.036 0.007 | 0.021 0.015 | 0.009 0.015 | 0.096 0.060 |
| Color | background | 2r10 | 4r10 | 2r4 |
|---|---|---|---|---|
| 0.650 | 0.042 0.007 | 0.032 0.017 | 0.026 0.018 | 0.064 0.054 |
| 0.750 | 0.048 0.008 | 0.003 0.015 | 0.004 0.016 | -0.02 0.028 |
| 0.850 | 0.039 0.007 | 0.018 0.015 | 0.018 0.016 | 0.014 0.038 |
| 0.950 | 0.034 0.007 | 0.056 0.018 | 0.042 0.018 | 0.152 0.071 |
| 1.050 | 0.047 0.008 | 0.099 0.023 | 0.066 0.022 | 0.165 0.075 |
| 1.150 | 0.056 0.009 | 0.147 0.027 | 0.068 0.023 | 0.554 0.128 |
| 1.250 | 0.065 0.009 | 0.101 0.025 | 0.041 0.022 | 0.280 0.096 |
| 1.350 | 0.047 0.008 | 0.096 0.023 | 0.013 0.017 | 0.377 0.106 |
| 1.450 | 0.046 0.008 | 0.142 0.026 | 0.034 0.019 | 0.591 0.130 |
| 1.550 | 0.030 0.006 | 0.098 0.021 | 0.020 0.015 | 0.448 0.113 |
| 1.650 | 0.032 0.007 | 0.066 0.019 | 0.032 0.017 | 0.233 0.084 |
| 1.750 | 0.023 0.006 | 0.038 0.015 | 0.007 0.012 | 0.189 0.075 |
| 1.850 | 0.013 0.004 | 0.044 0.014 | 0.039 0.015 | 0.040 0.038 |
| 1.950 | 0.013 0.004 | 0.002 0.008 | 0.002 0.009 | 0.013 0.027 |
| 2.050 | 0.030 0.006 | -0.01 0.010 | -0.01 0.011 | -0.03 0.006 |
| 2.150 | 0.020 0.005 | 0.002 0.010 | -0.00 0.010 | 0.006 0.027 |
5 Spatial distribution of clusters
5.1 Density profile and total numbers
Given the complicated morphology and a probable mixture of bulge and disk symmetry, a surface density profile for GCs in NGC 1316 will not have the same meaning as in spherical elliptical galaxies, where deprojection is possible. We rather use the density profile to evaluate the total extent of the cluster system and possible features in the profile. For convenience we count in circular annuli and select point sources in the color range 0.9-2 according to the above selection. The full annuli become sectors for distances larger than 10′, when the image border is reached. We correct for this geometrical incompleteness.
First we show the general density profile, then the two-dimensional distribution in various color intervals, and finally the radial density profiles in these intervals.
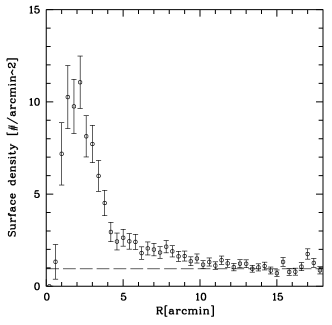
Fig. 8 shows the resulting surface densities. Inside 2′ the counts are severely affected by incompleteness due to the galaxy light and possible extinction by dust. Outside 13′ the counts are not distinguishable anymore from the background, for which we determine 0.946 objects/arcmin2.
Summing up the bins in Fig.8, we find 636 35 as the total number of GC candidates down to our magnitude limit of R=24 and in the color range 0.9 C-R 2.0 inside 13′. Correcting for the inner incompleteness would not enhance this number considerably. In case of an old GCS of a normal elliptical galaxy with a Gaussian-like luminosity function and a turn-over magnitude (TOM) corresponding to its distance, one would roughly double this number to have a fair estimation of the total number. Since a single TOM, valid for the entire cluster system, does not exist, one would underestimate this number. About 1400-1500 clusters seems to be a good guess, somewhat larger than the number given by Gómez et al. (2001). In any case, it is a relatively poor cluster system. We come back to this point in the discussion.
This radius of 13′ agrees well with the extension of NGC 1316 seen in Fig.16 which we expect if the extension of NGC 1316 is determined by the dynamical processes during the merger event(s). One notes an inflection point in Fig.8 at about 4′. Its nature becomes clearer if we subtract the background and plot surface densities for different color intervals. This is done in Fig.10 in a linear display, including the interval 0.8C-R1.1, and in Fig.11 in double-logarithmic display. The existence of a blue population is statistically well visible, although poor. GC candidates in the color interval 1.3-1.6 show a sharp decline at 4′, which defines the bulge. The outer clusters in this sample are mainly located to the South.
5.2 The two-dimensional distribution of clusters
NGC 1316 exhibits an elliptical symmetry only in its inner parts. At larger radii, the overall morphology is characterized by tidal(?) tails and loops. It is now interesting to ask whether morphological features of NGC 1316 can be found back in the distribution of GCs. Naturally, one does that in color intervals to suppress the background and (hopefully) get insight into the nature of the cluster candidates.
We plausibly assume that intermediate-age and younger clusters have at least the metallicity of the stellar bulge, i.e. at least solar metallicity. Refer to Fig.14 for a theoretical relation between age and Washington colors.
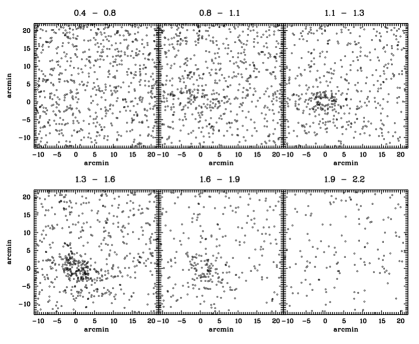
Fig.9 shows the 2-dimesional distribution of objects in six different color-intervals.
Interval 0.4 C-R 0.8:
Here we expect younger clusters with ages about 0.5 Gyr or somewhat younger. NGC 1316 is statistically not visible but note the cluster with C-R = 0.6 in Fig.6. We
anticipate (Richtler et al., in prep.) that we identified another object with C-R=0.4 by its radial velocity. Certainly there are not
many bright clusters within this age range and they do not seem to belong to a particularly strong star formation epoch.
Interval 0.8 C-R 1.1
Now the field of NGC 1316 becomes recognizable. With solar metallicity or higher, ages are between 0.6 and 1 Gyr. Noteworthy are the clumps roughly 1.5′ to the NE
and a slight overdensity which is projected roughly onto the L1-feature.
Interval 1.1 C-R 1.3:
In this interval we expect old, metal-poor clusters and younger clusters between 1 and 1.5 Gyr. NGC 1316 is now clearly
visible. The major axis of the distribution seems to show a position angle of about 90∘, different from the main
body. However, the more quantitative source counts in dependence on azimuth still show an overdensity at the
position angle of the major axis of NGC 1316 towards the North-East, while the peak towards the South-West is less
pronounced (Fig. 12).
The fraction of intermediate-age clusters is unknown. We shall discuss this issue further in Sec. 8.5, where we
argue that younger clusters actually provide the dominating population.
Interval 1.3 C-R 1.6
This interval samples the maximum of the color distribution. One notes the sharp definition of the galaxy’s luminous body. Perpendicular to
the major axis the cluster reaches the background at about 2.5′. A gap is visible at a distance of approximately
4′ to the South. Even further to the South, the cluster candidates populate a region roughly defined
by Schweizer’s L1-structure.
Note also the
horizontal boundary of cluster candidates at a distance of 8′ which delineates nicely the sharp ridge in NGC 1316.
Interval 1.6 C-R 1.9
Here we expect the majority of the metal-rich GCs of the pre-merger components. The fact that NGC 1316 is still well visible,
indicates a similar concentration as that of the metal-poor clusters. The overall symmetry follows the main body of NGC 1316,
which indicates the presence of an old population. In fact, as we argue in Section 8.6, this population dominates
the bulge mass.
Interval 1.9 C-R 2.2
One would expect old, metal-rich, and reddened clusters in this interval. However, NGC 1316 is not longer visible.
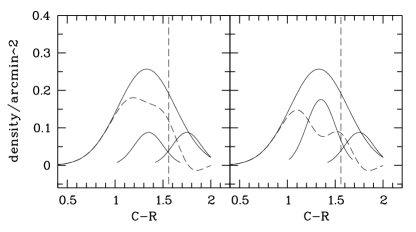
5.3 Density profiles in various color intervals
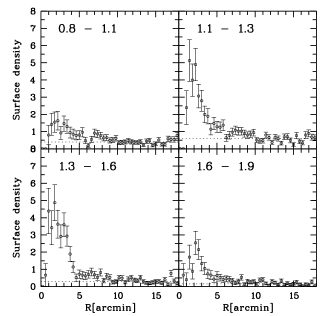
We now consider the radial distributions in different color intervals. This is done in Figs. 10 and 11. Fig. 10 plots the surface densities linearly and includes the color interval 0.8 C-R 1.1 where the clusters should be younger than 1 Gyr. This population is well visible in Fig. 10 at radii corresponding to the bulge region, and less conspicous at larger radii (due to the poor statistics we choose a larger bin in Fig.11).
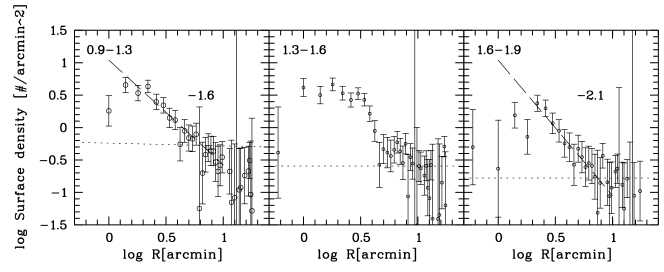
In Fig. 11, the left panel shows a blue sample (0.9 C-R 1.3), the middle panel an intermediate sample (1.3 C-R 1.6), and the right panel (1.6 C-R 1.9) the red sample. It becomes clear that the inflection point in Fig.8 is caused by the intermediate sample whose density shows a rapid decline at 4.0′ and remains more or less constant for larger radii. Since we are azimuthally averaging along structures which are azimuthally strongly inhomogeneous, this constancy does not reflect a true radial constancy. Interestingly, the inflection point is not visible in the luminosity profile of NGC 1316. Given all evidence, we identify this sample with the bulk of intermediate-age clusters. For the blue and the red sample, the indicated power-law indices refer to the radial interval 0.4 log(r) 0.9. The red GC candidates show a somewhat steeper decline. They perhaps preserved their initially more concentrated profile.
Fig.9 shows that the distribution of the intermediate sample at larger radii is concentrated towards the south, roughly delineating Schweizer’s L1-structure.
6 Azimuthal distribution
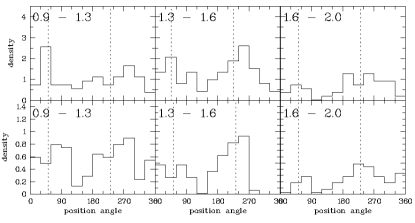
Fig. 12 shows the azimuthal distribution for three color-subsamples of GC candidates for the radial range 2′ - 4′ (inner sample) and 4′ - 10′ (outer sample). The bin width is 30∘ and the counts have been performed in circular annuli. The abscissas are the position angles measured counterclockwise with zero in the North. The ordinates are background-subtracted number densities per arcmin2. The first observation is that no subsample shows a spherical distribution, This stands in some contradiction to Gómez et al. (2001) who found, using BRI colors, for their blue sample a spherical distribution, while their red sample followed the galaxy’s ellipticity. We suspect that this is due to our more precise background subtraction and, because of the C filter inclusion, a more precise color subsampling. The highest degree of symmetry is found for the inner intermediate-color sample, once more demonstrating the strong confinement of this population to the bulge. The outer intermediate sample shows the strong dominance of the southern region. Most of these clusters might be attributed to the L1 feature. The red sample, in which we expect old metal-rich clusters, also shows the bulge symmetry.
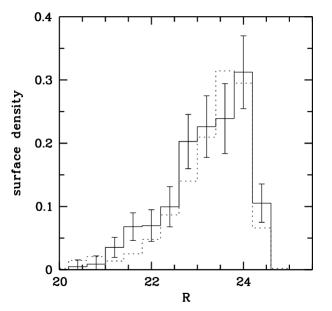
7 Luminosity function
The luminosity function (LF) of the GCS has been derived to very faint magnitudes by HST (Goudfrooij et al., 2001b), although only for the central parts. The main result is that the LF misses a well-defined turn-over magnitude (TOM) , which for “normal” elliptical galaxies is an excellent distance indicator (Villegas et al., 2010; Richtler, 2003). This can be understood by the relative youth of the cluster system which contains still unevolved clusters, an effect already noted by Richtler (2003) in galaxies with younger populations.
Our data cannot compete in depth with the HST observations, but we can probe the outer parts of the GCS, where our data are complete down to R=24 mag, in order to see whether a TOM is visible. With a distance modulus of 31.25 and a TOM of we expect it at about V= 23.8 and with a mean V-R=0.5. At R=23.3, a TOM-brightness outside the main body of NGC 1316 should be clearly visible.
As the radial interval we choose 4-9 arcmin in order to avoid the galaxy light, have reasonable number counts and avoid the very outskirts. Fig. 13 shows the background-corrected LF in this radial range, where the background counts refer to the complete field outside 12′. Surface densities are numbers/arcmin2. The uncertainties are calculated as the square root of background corrected counts. The dotted histogram shows the background counts.
The expected turn-over at R23.3 mag is not visible, resembling the HST results of Goudfrooij et al. (2004) for the central part and for the red clusters. The conclusion is that in this outer region the LF of intermediate-age clusters contribute significantly. The data of Goudfrooij et al. (2004) indicate a turn-over for their blue sample, but see our remarks in Sect.8.3 for counterarguments.
8 Discussion
8.1 External and internal reddening
The foreground reddening toward NGC 1316 is low. The all-sky maps of Burstein & Heiles (1982) and (Schlegel et al., 1998) give E(B-V)=0 and E(B-V)=0.02, respectively. This difference is the zero-point difference between the two reddening laws. According to Schlegel et al., the accuracy of both values is comparable below a reddening of E(B-V)=0.1. Therefore the reddening in C-R is E(C-R)= 0.04 or probably smaller, comparable with the uncertainty of the photometric calibration. We thus prefer not to correct for foreground reddening, also given that no conclusion depends on such a precision. The reddening by dust within NGC 1316 outside a radius of 1′ seems to be low as well. We point to the fact that our reddest GC candidates have C-R1.9, which the appropriate color for old, metal-rich GCs.
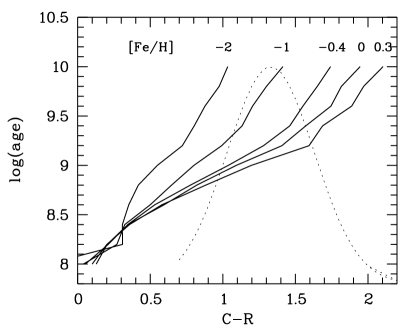
8.2 Theoretical Washington colors
We use theoretical isochrones for relating cluster ages to Washington colors. Fig. 14 compares the color distribution of GC candidates with theoretical models of single stellar populations from Marigo et al. (2008), using their web-based tool (http://stev.oapd.inaf.it/cgi-bin/cmd). Models are shown for five different metallicities. The highest metallicity refers to the stellar population (e.g. Kuntschner 2000) Overplotted (in arbitrary units) is a Gaussian representing the color distribution for GC candidates between 2′ and 10′ radius.
8.3 Color distribution and ages
What are the implications of the color distribution in Fig. 7 for possible scenarios of the cluster formation history of NGC 1316? First we compare our C-R photometry with the HST-photometry in B,V,I of the cluster sample of Goudfrooij et al. (2001a). These authors find two peaks at B-I=1.5 and B-I=1.8. Translating these values into Washington colors with the help of Fig. 4, one estimates for these peaks C-R=1.1 and C-R=1.4, respectively. This is indeed consistent with what is seen in Fig. 7. Already Goudfrooij et al. (2001b) interpreted the peak at B-I=1.8 as the signature of intermediate-age clusters with ages around 3 Gyr which was backed up by the spectroscopic ages and metallicities derived for a few bright objects (Goudfrooij et al., 2001a). From Fig.14 one would rather assign an age of somewhat less than 2 Gyr. If the bluer peak indicates old, metal-poor clusters of the pre-merger components, the metallicity distribution of old clusters must be strongly biased to very metal-poor objects and thus be very different from that in “normal” globular cluster systems of ellipticals (and also spirals) which show a more or less universal peak at C-R = 1.35 (Bassino et al., 2006b).
Since we can identify clusters with ages even younger than what would correspond to C-R=1.1, that means below 1 Gyr, one rather expects a mixture of old and intermediate-age clusters of unknown proportions. The hypothesis that the blue peak does not represent an overabundance of very metal-poor clusters, but marks a second burst of star formation with an age of about 1 Gyr, is interesting. A counterargument could be that the luminosity function in a V,V-I diagram seems to show a turn-over at about V= 24.6 mag (Goudfrooij et al., 2004). However, a number of points related to Fig.3 of Goudfrooij et al. create doubts whether this turn-over really corresponds to the universal turn-over magnitude in GCS. Firstly, Goudfrooij et al. (2004) adopted a distance of 22.9 Mpc which means a brightening of 0.5 mag in absolute magnitudes with respect to the supernova distance of 17.8 Mpc, we adopted. So the turn-over would be at , i.e. almost 0.7 mag fainter than the ”normal” turn-over, while one would expect the turn-over to be brighter due to the bias to low metallicities. Secondly, the turn-over itself is not well defined, the highest number count being even fainter than the formal turn-over from the fit, leaving the question open whether there is a decline at fainter magnitudes or not. Thirdly, their color interval which defines ”old clusters” is , a sample which clearly includes intermediate-age clusters (here we also point to the superiority of the Washington system with respect to V-I and refer the reader to Fig. 7 of Dirsch et al. 2003b ).
Evidence from our photometry comes from the fact that the red peak is strongly constrained to the bulge (Figs. 11 and 10). The blue clusters, on the other hand, are abundant still in the outskirts of NGC 1316. If this outer cluster population would consist exclusively of old clusters, then a turn-over magnitude should be visible in our luminosity function which is not even corrected for incompleteness.
The absence of the striking red peak in the outer region shows that these stellar populations do not stem from the first star-burst. The dynamical age of these regions is unknown, but plausibly younger than the inner star burst.
The light of the inner bulge is redder than the peak color of the GCS by about 0.15 mag in C-R and shows only a small radial transition to bluer colors. 111Strictly speaking, this difference is not exactly valid, because we measure the color of the stellar population by using the total projected light and calculate a color for the GCs by averaging over magnitudes. The difference, however, is negligible.
A differential reddening between clusters and stellar population is not probable. The selection of cluster candidates between 1′ and 3 ′ (236 objects), where the reddening should be strongest, still gives a peak color of C-R=1.38, while the galaxy has C-R=1.57. An explanation for this difference may be sought in the fact that the clusters are (more or less) single stellar populations of intermediate-age, while the total bulge light has a contribution from old populations. We shall argue that this contribution is significant.
We find statistical evidence for clusters between which are neither old and metal-poor nor can be related to a starburst 2 Gyr ago, but must be younger even if their metallicities are lower than solar. Plausibly, these clusters should have a metallicity at least as high as the intermediate-age stellar population, if they formed in NGC 1316.
However, there is still the possibility that infalling dwarf galaxies provided clusters with low metallicities
8.4 Comparison with spectroscopic ages
Goudfrooij et al. (2001b) provide spectroscopic ages and metallicities for three clusters, their objects No.103, No.114, and No. 210. There exist C-R measurements for 103 and 210 (114 is too close to the center). These clusters have solar abundance and a common age (within the uncertainties) of 3 Gyr. The C-R colors for 103 and 210 are 1.48 and 1.51, respectively. A comparison with Fig.14 shows that these colors are a bit too blue for full consistency with the model colors for 3 Gyr and solar abundance. A shift to the red of 0.1 mag in C-R would be necessary to achieve perfect agreement, but given that various models with their respective uncertainties and the uncertainty of the absolute photometric calibration are involved, one can consider the agreement to be satisfactory. In any case, these two clusters do not seem to be reddened.
8.5 Subpopulations
A bimodal color distribution is not exclusively a feature of elliptical galaxies, as the example of the Milky Way shows. As a working hypothesis, we assume that the color histogram of old GCs of NGC 1316 also has a bimodal appearance. Moreover, we assume that clusters redder than the galaxy color belong to the old, metal-rich subpopulation. Bassino et al. (2006b) compiles values for the blue and the red peak of early-type galaxies in the Washington system. Adopting these values, we fix the Gaussian of the red peak with a maximum at C-R=1.75 and a dispersion of 0.15. We cannot distinguish old, metal-poor clusters from younger, metal-rich clusters that populate the same color range, but may assume that their color distribution follows the almost universal distribution known from other galaxies, for which Bassino et al. (2006b) quotes C-R=1.32 for the peak color and 0.15 mag for the dispersion.
In order to get an impression of what the pre-merger GCSs could look like, we fit the corresponding Gaussian to the color bins redder than C-R=1.6, assuming that all clusters redder than the galaxy light are old. The amount of old, metal-poor clusters is unknown, but we assume two cases: equal to and twice the metal-rich population. The subtraction of these two Gaussians from the Gaussian describing the entire sample down to R=24 mag in Sect. 4 reveals the GC population which has been formed in the merger and and perhaps in following star-forming events.
Fig. 15 shows these two cases. In the left panel (case 1) the dashed line results from the subtraction of the assumed bimodal color distribution of old clusters. In this case, intermediate-age clusters are dominating the color interval 1.3-1.6. In the the right panel (case 2), old clusters dominate which contradicts the behaviour of clusters in this color range. Therefore, case 1 may be closer to the true situation.
8.6 A star formation history
The star formation history of NGC 1316 was probably complex. A merger event is not a simple infall, but is preceded by close encounters which can trigger starbursts, in time separated by the orbital period. See, for example, Teyssier et al. (2010) and Di Matteo et al. (2008) for modern simulations of mergers and starbursts. Teyssier et al. resolve the multi-phase ISM and find that the main trigger for starbursts is not a large-scale gas flow, but a fragmentation of gas into cold and dense clumps, favoring star cluster formation. A realistic scenario would probably involve many individual starbursts which perhaps can be identified in future high S/N spectra of globular clusters in NGC 1316. Our intention in simplifying the star formation history is to show that in order to bring photometric properties and dynamical determined mass-to-light ratios into agreement, the properties of the pre-merger population rule out an elliptical galaxy. Moreover, a contribution of a population significantly younger than 2 Gyr is needed.
We therefore ask whether it is possible to find a simple model, inspired by the color distribution of GCs, which is consistent with the color and the mass-to-light ratio of the bulge stellar population. We adopt three populations: a pre-merger population (pop.1) with an a-priori unknown age, and two populations representing starbursts with ages 2 Gyr (pop. 2) and 0.8 Gyr (pop. 3). Since the luminosity weighted metallicity of the bulge is at least solar (Kuntschner, 2000), we adopt solar metallicity for each of them. The color of NGC 1316 then results from a composite of these populations to which we assign the integrated color C-R=1.55 (see Fig.20).
Mass-to-light ratios for the inner bulge have been quoted by several authors in various photometric bands. To transform an M/L-value from one band to another, is in the case of NGC 1316 not completely trivial, since published aperture photometries (Prugniel & Heraudeau, 1998) measure a color which is reddened by the dust within about 1′ radius. We therefore adopt theoretical colors (including Washington colors) from the Padova models (http://stev.oapd.inaf.it/cgi-bin/cmd; Marigo et al. 2008). The relation between M/L-ratios (denoted by ) in filters i and j is
C-R=1.55 corresponds to a good approximation to a single stellar population with solar metallicity and an age of 2.5 Gyr. For that population we find B-V=0.81, B-R=1.34, and R-I=0.56. Furthermore, we adopt the solar absolute magnitudes of Binney & Merrifield (1998) (p.53) and thus can transform M/L-values into the R-band.
Schweizer (1981) gives for a distance of 32.7 Mpc, corresponding to for our distance (M/L is inversely proportional to the distance). Shaya et al. (1996) give , corresponding to (distance 16.9 Mpc). Arnaboldi et al. (1998), by using dynamics of planetary nebulae, quote inside a radius of 200″ (distance 16.9 Mpc). However, they find lower values for smaller radii, down to at a radius of 45″ which corresponds to . This early result, based on only a few planetary nebulae, is superseded by the recent work of McNeil-Moylan et al. (2012), who quote (distance 21.5 Mpc) for the stellar population, which transforms into . Due to the large database of their dynamical model, this value certainly has a high weight. However, it is based on spherical modeling and the authors caution that it may change with more realistic models. Nowak et al. (2008), modeling the central kinematics with a black hole, have found for the central region a value in the -band between 0.7 and 0.8 (distance 18.6 Mpc), corresponding to a value between 2.8 and 3.2 in the R-band (setting = and adopting R-K=2.60 for the stellar population). Future work will probably lower the uncertainties. For the moment, seems to be a good value to adopt.
Perhaps the best empirical determinations of M/L-values of stellar populations of early-type galaxies come from the SAURON-group (Cappellari et al., 2006). The highest values, they quote in the I-band inside one effective radius, are around 5 (their ”Jeans”-values). Considering that a dark halo can contribute up to 8% of the total mass, values around 4 for metal-rich, old populations seem reasonable. The Padova models give =4.1 for a 12 Gyr old population of solar metallicity (with =+4.10), assuming a log-normal IMF (Chabrier, 2001), reproducing the empirical values quite well.
Adopting their M/L-ratios also for younger populations, we now can assign colors and M/L-values to our model populations and estimate under simplifying assumptions the properties of the pre-merger population.
Table 3 lists the models, ages, metallicities, Washington colors, and R-band mass-to-light-ratios (columns 1-5). We assume two different pre-merger populations with ages of 12 Gyr (pop.1a) and 7 Gyr (pop.1b). The equation to be solved is then
where L1, L2, L3 are the respective luminosities in C and R. If we use the R-luminosity of the bulge as unit and assume a certain mass proportion of pop.2 and pop.3, one can solve for L2 and L3. Since in case 1 of Fig. 15 the young clusters are of comparable number, we assume pop.2 and pop.3 to contribute with equal stellar mass. L2 and L3 (R-band) are given in column 6. Column 7 gives the resulting stellar masses for the bulge (inside a radius of 240″ ) using the bulge luminosity of Table 4. These values are upper limits since in reality one must use the deprojected bulge luminosities, but the global symmetry of NGC 1316 is not known.
Having these values, one can calculate the resulting M/L of the composite population.
| Pop. | Z | age[Gyr] | C-R | |||
| (1) | (2) | (3) | (4) | (5) | (6) | (7) |
| 1a | 0.019 | 12 | 1.99 | 5.2 | 0.60 | |
| 2 | 0.019 | 2 | 1.49 | 1.1 | 0.13 | |
| 3 | 0.019 | 0.8 | 0.96 | 0.57 | 0.27 | |
| composite | 1.55 | 3.4 | 1 | |||
| 1b | 0.019 | 7 | 1.84 | 3.4 | 0.67 | |
| 2 | 0.019 | 2 | 1.49 | 1.1 | 0.11 | |
| 3 | 0.019 | 0.8 | 0.96 | 0.57 | 0.22 | |
| composite | 1.55 | 2.55 | 1 |
What one learns from this exercise is that a pre-merger population of 12 Gyr with solar metallicity, representative of an elliptical galaxy, does not agree well with a composite =2.5. In contrast, a 7 Gyr old population fits well, which one would expect if the pre-merger was one or two spiral galaxies with an already existing mix of old to intermediate-age populations.
Moreover, a population significantly younger than 2 Gyr is necessary in case of =2.5. If only the 2 Gyr population would exist, it would be so dominant ( in the case of a 12 Gyr pre-merger population) that . This value would even be lower in the case of a younger pre-merger population.
These considerations are viable only for the bulge. In the outer parts, the galaxy gets bluer, but we have no knowledge of the metallicities or ages. However, one might suspect that younger ages dominate over decreasing metallicity, since the Southern L1-structure is traced by GCs of probable intermediate age.
We thus have a total stellar bulge mass of about of which only 10% have been produced in both starbursts. These 10% are, however, responsible for the majority of bright (!) GCs, emphasizing once more that the efficiency of GC formation in phases of high star formation rates is greatly enhanced (Whitmore & Schweizer, 1995; Larsen & Richtler, 2000; de Grijs et al., 2003b, a; Kravtsov & Gnedin, 2005).
One has to account for a gas mass of which has been transformed into stars. Since we must assume a strong galactic wind with heavy mass loss during the burst phases, the total gas mass needed was probably higher. A gas mass of this order is easily provided by one or two spiral galaxies (e.g. McGaugh & de Blok 1997).
9 Conclusions
We present wide-field photometry (36 36 arcmin2) in Washington C and Kron-Cousins R around the merger remnant NGC 1316 (Fornax A) in order to investigate the globular cluster system of NGC 1316 on a larger scale than has been done before. The data consist of MOSAIC images obtained with the 4-m Blanco telescope at CTIO. The Washington system is particularly interesting due to its good metallicity resolution in GCSs containing old clusters and for the comparison with the well-established bimodal color distribution of elliptical galaxies.
Our main findings are:
The GC candidates are well confined to the region of the optical extension of NGC 1316. Outside a radius of
12′ (corresponding to 62 kpc), a cluster population is statistically not detectable.
The entire system down to R = 24 mag shows a broad
Gaussian-like distribution with a peak at C-R = 1.37, somewhat bluer than the color of the inner bulge. A selection of brighter GC candidates shows a bimodal color distribution, best visible for bulge objects, with peaks
at C-R=1.1 and C-R=1.4. We find a small population of GC candidates bluer
than C-R=1.0, which is the limit for old metal-poor clusters. Clusters bluer than C-R=0.8 are statistically not
detectable, but casual confirmations through radial velocities show that there are sporadically clusters
as blue as C-R=0.4. The brighter population of cluster candidates therefore consists of intermediate-age clusters,
while older clusters of the pre-merger galaxy are progressively mixed in at fainter magnitudes.
Assuming that younger cluster have at least the metallicity of the bulge population, one can assign ages, using theoretical Washington isochrones and integrated colors. The peak at C-R=1.4 then corresponds to an age of about 1.8 Gyr, the peak at C-R=1.1 to an age of 0.8 Gyr, and the bluest colors to less than 0.5 Gyr. The peaks plausibly stem from epochs of very high star formation rates, connected to one or several merger events. The bluest clusters could indicate ongoing star formation younger than 0.8 Gyr. Alternatively, they could be metal-poorer clusters of somewhat older age from infalling dwarf galaxies or could be formed in one of the star bursts from metal-poor gas of one of the pre-merger components.
The intermediate color interval shows a radial surface density profile very different from the other color regimes. Here we find the bulk of intermediate-age clusters. These objects are strongly confined to the inner bulge, showing an inflection at about 4′. For radii larger than 4′, their distribution is azimuthally inhomogeneous with a pronounced concentration in the area of Schweizer’s (1980) L1-structure. The blue clusters () fall off without showing an inflection with a power-law exponent of -1.6. The red clusters () follow a somewhat steeper power-law with an exponent of -2.1.
Outside the bulge, the luminosity function of cluster candidates does not show the turn-over expected for an old cluster system, indicating that also at larger radii, younger clusters contribute significantly.
Guided by the color distribution of GCs, we present a simple model, which as the main ingredient adopts two burst of star formation with ages 2 Gyr and 0.8 Gyr added to an older population of solar metallicity. In order to reproduce the color of the bulge of NGC 1316, and the stellar M/L-value from dynamical estimates, this older population has an age of about 7 Gyr as a single stellar population. In reality, this population is expected to be a mix of populations and thus the age indicates spiral galaxies as merger components rather than an old elliptical galaxy. The existence of a population significantly younger than 2 Gyr is necessary in order to avoid the dominance of this population which would result in too low M/L-values.
The stellar masses of the younger populations account for only 10% of the total stellar mass, while their luminosity contributes 30% of the total luminosity.
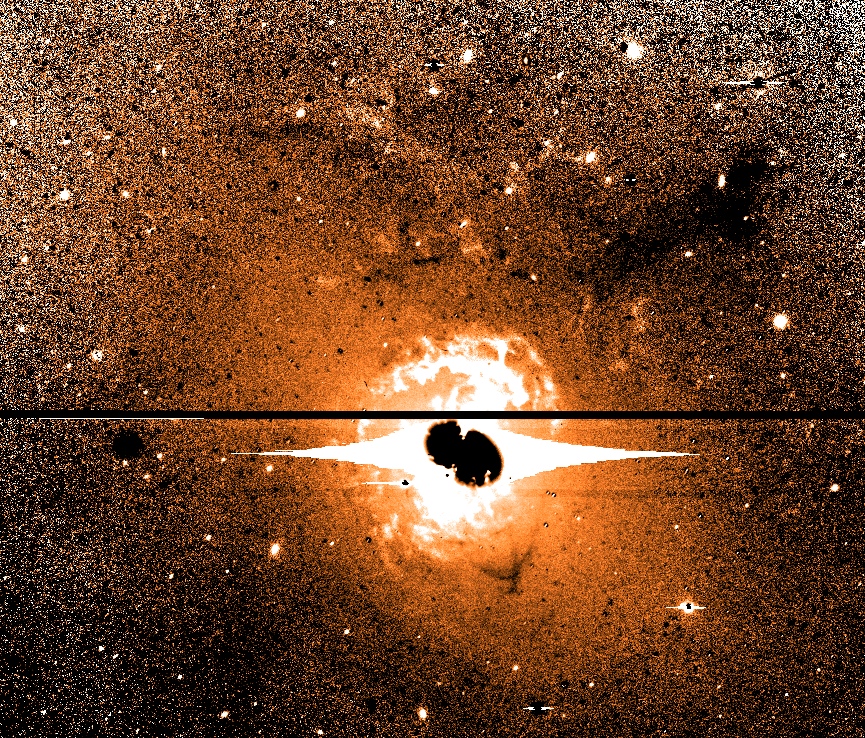
As an appendix, we present our image and add morphological remarks. The wide-field morphology of NGC 1316 does not reveal new features with respect to the photographic morphological study of Schweizer (1980) with the exception of a faint arc which morphologically could be a continuation of the prominent L1-feature. We also present a color map of the inner regions showing details, which to our knowledge have not been mentioned in the literature, among them a curved feature which may be the relic of a spiral arm.
The color gradient is very shallow out to 6′ pointing to a well mixed stellar population. We construct a new spherical model of the R-brightness profile and give its main characteristics.
Acknowledgements.
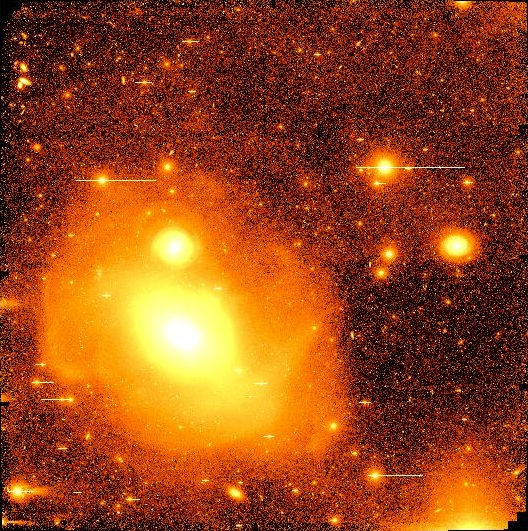
We thank an anonymous referee for valuable remarks and constructive criticism. TR acknowledges financial support from the Chilean Center for Astrophysics, FONDAP Nr. 15010003, from FONDECYT project Nr. 1100620, and from the BASAL Centro de Astrofisica y Tecnologias Afines (CATA) PFB-06/2007. He also thanks the Arryabhatta Institute for Observational Sciences, Nainital, for warm hospitality and financial support. LPB gratefully acknowledges support by grants from Consejo Nacional de Investigaciones Científicas y Técnicas and Universidad Nacional de La Plata (Argentina). We thank Richard Lane for a careful reading of a draft version.Appendix A Morphology of NGC 1316
The morphology of NGC 1316 has been discussed several times (e.g. Schweizer 1980; Mackie & Fabbiano 1998), but to our knowledge, a wide-field deep CCD image of NGC 1316 does not exist in the literature. Moreover, the color map of the inner region exhibits details, which are worth to be shown.
A.1 Global morphology
A deep wide-field image of NGC 1316 reveals a wealth of faint structures. This paper has the emphasis on GCs, but it is appropriate to make a few remarks on the global morphology. Schweizer (1980) gave a thorough morphological description of the NGC 1316 complex on a scale of about 1 degree. For orientation and labels of the various features, we refer the reader to Fig.2 of Schweizer (1980).
It is interesting to see that our deep CCD-image (Fig. 16) is not much superior to photographic Schmidt plates regarding the detection of faint areal structures. In Fig. 16 almost all features labeled by Schweizer are visible. There are only two structures which we do not have in common. One is the very faint arc to the SE (Schweizer’s Fig.9) which is outside our field. The other is an extremely faint curved arc (resembling a “spiral arm”), which appears as a continuation of the L1 structure reaching out to the NW. Regarding this feature, one may think of the “rows” in grand design spiral galaxies where parts of spiral arms are straight lines rather than curved. This has not been discussed much in the literature. Chernin (1998) gives a gas dynamical interpretation, but encounters may also play a role.
For example, the structure of the grand design spiral M51 has been analyzed by Dobbs et al. (2010) through hydrodynamical models who identified tidal influences (in the case of M51 the interaction with NGC 5195) as a main driver for shaping spiral structure. In analogy, NGC 1316 could have interacted with its companion NGC 1317 or with a later merged galaxy.
Intuitively, the region outside the bulge gives the impression of an inclined disk rotating clockwise. Practically all loops are consistent with this sense of rotation except the outermost loop in the SW. However, a bulge component kinematically dominates outside 35″ (Bedregal et al., 2006).
Very noticable is the sharp border in the South. This may be another hint that we are looking onto a (thick?) disk since 3-dimensional structures in projection should not be so sharply confined.
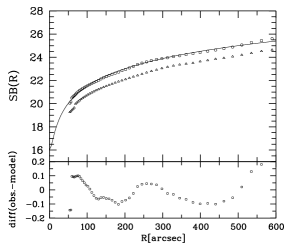
A.2 The surface brightness profile
Due to the inner saturated region, we can measure the surface brightness profile of NGC 1316 in the R-band on our MOSAIC image only from about 50″outwards. In order to enable the comparison with published aperture photometry, we use the ellipse-task in IRAF to measure (almost) circular “isophotes” and try to find an analytic spherical model for the surface brightness. We integrate this radial model and calculate aperture photometric values which we compare with the compilation of aperture photometries of Prugniel & Heraudeau (1998). For the model, we chose a ”beta-model” which turns out to work surprisingly well. The exponent of -1 enables deprojection and integrated mass to be written analytically (which here would result in only approximate values, since the system is not spherical) (e.g. see Schuberth et al. 2010; Richtler et al. 2011).
| (1) |
with = 3.90210-7, = 8″, = . To transform this surface brightness into , one has to apply a factor to the argument of the logarithm (where we used ). The foreground extinction in the R-band is 0.056 mag (Schlegel et al. 1998) which we neglect.
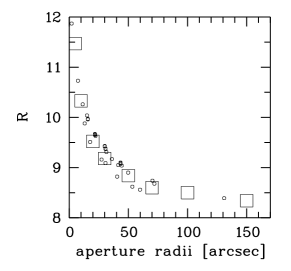
Fig.17 shows in its upper panel the beta-model (solid line), the spherical model (open circles), and measurements of elliptical isophotes (ellipticity 0.3, position angle 50∘). These measurements have been shifted by 0.5 mag to enhance the visibility. In the spherical model, the bulge does not emerge as a separate entity, because the sphericity introduces some smoothing. Also in the elliptical isophotes, it is hardly visible. We compare our model with published aperture photometry (Prugniel & Heraudeau, 1998) by integrating within given apertures. The result is shown in Fig. 18 for eight apertures and is found to be very satisfactory.
| Radius | ||
|---|---|---|
| 240″ (bulge) | -23.07 | |
| 600″ | -23.33 |
Table 4 lists the absolute R-magnitudes and corresponding luminosities for the bulge and the total extension of NGC 1316. The effective radius is 69.5″, corresponding to almost exactly 6 kpc.
A.3 Color image
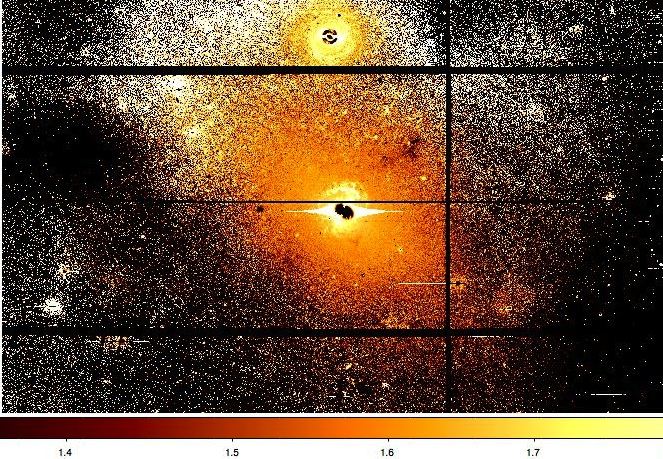
The color image is restricted in size because of the strong flatfield features present on the western part of the C-image.
Fig.19 displays the color in magnitudes. Its size is 23.3′ 14.5′. After subtracting the sky, we divided the C-image by the R-image and converted the resulting image to a magnitude scale. We selected from the GC photometry 10 of the brightest non-saturated objects at small radii and applied their calibrated magnitudes to the galaxy light to make sure that the galaxy colors are measured differentially to the GC colors. The resulting scatter is 0.03 mag in C-R. The dynamical range of Fig.19 covers the color interval 1.3 - 1.9, which has been found the most satisfactory. Dark is blue and bright is red. The magnitude scale itself is displayed logarithmically. Due to the uncertain flat-field of the C-image at low intensity levels, the colors beyond about 8′ are not reliable. Particularly, we are reluctant to claim the reality of the outer red structures in the North, but mention that on Schweizer’s plate (his Fig.1) the Northern extension of NGC 1316 appears more diffuse than the Southern border.
The extended line emission region of Mackie & Fabbiano (1998) is visible as the bright spot, presumably dust, in the South just above the CCD-gap, which unfortunately covers part of the structure. The southern HII-region, detected by Schweizer (1980) appears as a dark spot not well visible in this display. It is an extremely interesting object, apparently showing globular cluster formation under quite isolated conditions. We intend to devote an own contribution to this object.
A.4 The color profile
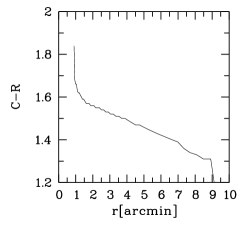
The color map does not exhibit a clear elliptical appearance. In spite of that we adopt the ellipticity of the optical isophotes and evaluate the color by averaging along ”color-isophotes” with a fixed ellipticity of 0.3 and a position angle of 50∘, corresponding to the major axis of NGC 1316. Fig.20 shows the radial dependence of color. The inner jump to very red colors is due to the central dust structures. The gradient has been noted already by Schweizer (1980) who attributed it to a declining abundance in the outer parts. The question, whether age or abundance is the dominant factor, must be left for future investigations of the outer clusters.
A.5 Color image of the central parts
The wealth of structure and features which is visible in the inner color map, deserves a special description. The basis is Fig.21. This map displays C-R in the range from 1.5 to 1.7. White is red, dark is blue. The reddest colors are caused by dust, while bluer colors are caused by bluer stellar populations and/or perhaps by strong emission of the OII-3727 line which falls into the C-filter. The inner dust features best known from HST images appear white with a color about C-R = 1.9. They fit well to non-stellar PAH emission (Temi et al., 2005; Kaneda et al., 2007). Note that the overall symmetry of the dust distribution differs from the spheroid. It shows a slightly elliptical distribution with its major axis at a PA of about -30∘.
Note the many tiny dust patches in the north which are absent in the south. Remarkable is the slightly curved brighter feature, beginning at about 2.5′ to the North, the PA first being 70∘ and 90∘ on its eastern part. The overall impression is that of a relic of a spiral arm, which may be a direct clue to the nature of the original galaxy. At its southern border, it is accompanied by a more blueish color, reminding of the fact that dust usually follows trailing spiral arms.
One of the most conspicuous features is Schweizer’s ”plume”, pointing towards the NW. Neither Schweizer nor Mackie & Fabbiano (1998) detected line emission. No atomic or molecular gas has been detected (Horellou et al., 2001). Dust also seems to be absent. Its total extent in the NW-direction is almost 2′, corresponding to 10 kpc. One finds the bluest color at the ”head” in some blue spots which have C-R=1.1. Towards the SE-direction, the color becomes somewhat redder, typically 1.4. Since we observe in projection, this does not mean that the color of the associated stellar population is really varying, but only that its density varies. The true color might be quite blue and homogenous. Unless this population has a low metallicity (an infalling dwarf galaxy in tidal dissolution cannot be excluded), it must be younger than 1 Gyr. Graham (1987) made the interesting suggestion that the plume might represent young stars whose formation was triggered by a nuclear jet. A correspondence might be seen in a group of blue stars in CenA that has it probably origin in star formation triggered by the X-ray jet (Graham & Fassett, 2002). However, its major axis does point neither to the nucleus nor to the center of the western inner radio lobe (which is not necessarily a counterargument after roughly a crossing time). The alternative (also mentioned by Graham 1987) is an infalling dwarf galaxy in dissolution, which appears more probable.
Striking is also the psi-shaped irregular structure 1′ to the south, which is bluer than its environment by 0.05 mag which to our knowledge has not yet been mentioned in the literature. Whether the color is due to a bluer population or due to line emission, must be cleared up by spectroscopy.
References
- Arnaboldi et al. (1998) Arnaboldi, M., Freeman, K. C., Gerhard, O., et al. 1998, ApJ, 507, 759
- Bassino et al. (2006a) Bassino, L. P., Faifer, F. R., Forte, J. C., et al. 2006a, A&A, 451, 789
- Bassino et al. (2006b) Bassino, L. P., Richtler, T., & Dirsch, B. 2006b, MNRAS, 367, 156
- Bedregal et al. (2006) Bedregal, A. G., Aragón-Salamanca, A., Merrifield, M. R., & Milvang-Jensen, B. 2006, MNRAS, 371, 1912
- Binney & Merrifield (1998) Binney, J. & Merrifield, M. 1998, Galactic Astronomy, ed. Binney, J. & Merrifield, M.
- Blakeslee et al. (2009) Blakeslee, J. P., Jordán, A., Mei, S., et al. 2009, ApJ, 694, 556
- Brodie & Strader (2006) Brodie, J. P. & Strader, J. 2006, ARA&A, 44, 193
- Burstein & Heiles (1982) Burstein, D. & Heiles, C. 1982, AJ, 87, 1165
- Cappellari et al. (2006) Cappellari, M., Bacon, R., Bureau, M., et al. 2006, MNRAS, 366, 1126
- Chabrier (2001) Chabrier, G. 2001, ApJ, 554, 1274
- Chernin (1998) Chernin, A. D. 1998, Astrophysics, 41, 399
- Davies et al. (2011) Davies, B., Bastian, N., Gieles, M., et al. 2011, MNRAS, 411, 1386
- de Grijs et al. (2003a) de Grijs, R., Anders, P., Bastian, N., et al. 2003a, MNRAS, 343, 1285
- de Grijs et al. (2003b) de Grijs, R., Lee, J. T., Mora Herrera, M. C., Fritze-v. Alvensleben, U., & Anders, P. 2003b, New A, 8, 155
- Di Matteo et al. (2008) Di Matteo, P., Bournaud, F., Martig, M., et al. 2008, A&A, 492, 31
- Dirsch et al. (2003a) Dirsch, B., Richtler, T., & Bassino, L. P. 2003a, A&A, 408, 929
- Dirsch et al. (2003b) Dirsch, B., Richtler, T., Geisler, D., et al. 2003b, AJ, 125, 1908
- Dirsch et al. (2005) Dirsch, B., Schuberth, Y., & Richtler, T. 2005, A&A, 433, 43
- Dobbs et al. (2010) Dobbs, C. L., Theis, C., Pringle, J. E., & Bate, M. R. 2010, MNRAS, 403, 625
- Fabbiano et al. (1992) Fabbiano, G., Kim, D.-W., & Trinchieri, G. 1992, ApJS, 80, 531
- Feigelson et al. (1995) Feigelson, E. D., Laurent-Muehleisen, S. A., Kollgaard, R. I., & Fomalont, E. B. 1995, ApJ, 449, L149
- Fukazawa et al. (2006) Fukazawa, Y., Botoya-Nonesa, J. G., Pu, J., Ohto, A., & Kawano, N. 2006, ApJ, 636, 698
- Geisler (1996) Geisler, D. 1996, AJ, 111, 480
- Gómez et al. (2001) Gómez, M., Richtler, T., Infante, L., & Drenkhahn, G. 2001, A&A, 371, 875
- Goudfrooij et al. (2001a) Goudfrooij, P., Alonso, M. V., Maraston, C., & Minniti, D. 2001a, MNRAS, 328, 237
- Goudfrooij et al. (2004) Goudfrooij, P., Gilmore, D., Whitmore, B. C., & Schweizer, F. 2004, ApJ, 613, L121
- Goudfrooij et al. (2001b) Goudfrooij, P., Mack, J., Kissler-Patig, M., Meylan, G., & Minniti, D. 2001b, MNRAS, 322, 643
- Graham (1987) Graham, J. A. 1987, in Bulletin of the American Astronomical Society, Vol. 19, Bulletin of the American Astronomical Society, 1048–+
- Graham & Fassett (2002) Graham, J. A. & Fassett, C. I. 2002, ApJ, 575, 712
- Grillmair et al. (1999) Grillmair, C. J., Forbes, D. A., Brodie, J. P., & Elson, R. A. W. 1999, AJ, 117, 167
- Harris & Canterna (1977) Harris, H. C. & Canterna, R. 1977, AJ, 82, 798
- Harris (2010) Harris, W. E. 2010, Royal Society of London Philosophical Transactions Series A, 368, 889
- Horellou et al. (2001) Horellou, C., Black, J. H., van Gorkom, J. H., et al. 2001, A&A, 376, 837
- Iyomoto et al. (1998) Iyomoto, N., Makishima, K., Tashiro, M., et al. 1998, ApJ, 503, L31+
- Kaneda et al. (2007) Kaneda, H., Onaka, T., & Sakon, I. 2007, ApJ, 666, L21
- Kim & Fabbiano (2003) Kim, D.-W. & Fabbiano, G. 2003, ApJ, 586, 826
- Kim et al. (1998) Kim, D.-W., Fabbiano, G., & Mackie, G. 1998, ApJ, 497, 699
- Konami et al. (2010) Konami, S., Matsushita, K., Nagino, R., et al. 2010, PASJ, 62, 1435
- Kravtsov & Gnedin (2005) Kravtsov, A. V. & Gnedin, O. Y. 2005, ApJ, 623, 650
- Kundu & Whitmore (2001) Kundu, A. & Whitmore, B. C. 2001, AJ, 121, 2950
- Kuntschner (2000) Kuntschner, H. 2000, MNRAS, 315, 184
- Lanz et al. (2010) Lanz, L., Jones, C., Forman, W. R., et al. 2010, ApJ, 721, 1702
- Larsen et al. (2001) Larsen, S. S., Brodie, J. P., Huchra, J. P., Forbes, D. A., & Grillmair, C. J. 2001, AJ, 121, 2974
- Larsen & Richtler (1999) Larsen, S. S. & Richtler, T. 1999, A&A, 345, 59
- Larsen & Richtler (2000) Larsen, S. S. & Richtler, T. 2000, A&A, 354, 836
- Mackie & Fabbiano (1998) Mackie, G. & Fabbiano, G. 1998, AJ, 115, 514
- Marigo et al. (2008) Marigo, P., Girardi, L., Bressan, A., et al. 2008, A&A, 482, 883
- McGaugh & de Blok (1997) McGaugh, S. S. & de Blok, W. J. G. 1997, ApJ, 481, 689
- McNeil-Moylan et al. (2012) McNeil-Moylan, E. K., Freeman, K. C., Arnaboldi, M., & Gerhard, O. E. 2012, ArXiv e-prints
- Mieske et al. (2008) Mieske, S., Hilker, M., Jordán, A., et al. 2008, A&A, 487, 921
- Nagino & Matsushita (2009) Nagino, R. & Matsushita, K. 2009, A&A, 501, 157
- Nowak et al. (2008) Nowak, N., Saglia, R. P., Thomas, J., et al. 2008, MNRAS, 391, 1629
- Peng et al. (2004a) Peng, E. W., Ford, H. C., & Freeman, K. C. 2004a, ApJS, 150, 367
- Peng et al. (2004b) Peng, E. W., Ford, H. C., & Freeman, K. C. 2004b, ApJ, 602, 705
- Prugniel & Heraudeau (1998) Prugniel, P. & Heraudeau, P. 1998, A&AS, 128, 299
- Rejkuba et al. (2011) Rejkuba, M., Harris, W. E., Greggio, L., & Harris, G. L. H. 2011, A&A, 526, A123+
- Richtler (2003) Richtler, T. 2003, in Lecture Notes in Physics, Berlin Springer Verlag, Vol. 635, Stellar Candles for the Extragalactic Distance Scale, ed. D. Alloin & W. Gieren, 281–305
- Richtler et al. (2011) Richtler, T., Salinas, R., Misgeld, I., et al. 2011, A&A, 531, A119+
- Saikia & Jamrozy (2009) Saikia, D. J. & Jamrozy, M. 2009, Bulletin of the Astronomical Society of India, 37, 63
- Schlegel et al. (1998) Schlegel, D. J., Finkbeiner, D. P., & Davis, M. 1998, ApJ, 500, 525
- Schuberth et al. (2010) Schuberth, Y., Richtler, T., Hilker, M., et al. 2010, A&A, 513, A52+
- Schweizer (1980) Schweizer, F. 1980, ApJ, 237, 303
- Schweizer (1981) Schweizer, F. 1981, ApJ, 246, 722
- Shaya et al. (1996) Shaya, E. J., Dowling, D. M., Currie, D. G., et al. 1996, AJ, 111, 2212
- Sikkema et al. (2006) Sikkema, G., Peletier, R. F., Carter, D., Valentijn, E. A., & Balcells, M. 2006, A&A, 458, 53
- Stritzinger et al. (2010) Stritzinger, M., Burns, C. R., Phillips, M. M., et al. 2010, AJ, 140, 2036
- Temi et al. (2005) Temi, P., Mathews, W. G., & Brighenti, F. 2005, ApJ, 622, 235
- Teyssier et al. (2010) Teyssier, R., Chapon, D., & Bournaud, F. 2010, ApJ, 720, L149
- Thomas et al. (2005) Thomas, D., Maraston, C., Bender, R., & Mendes de Oliveira, C. 2005, ApJ, 621, 673
- Tremaine et al. (2002) Tremaine, S., Gebhardt, K., Bender, R., et al. 2002, ApJ, 574, 740
- Villegas et al. (2010) Villegas, D., Jordán, A., Peng, E. W., et al. 2010, ApJ, 717, 603
- Whitmore & Schweizer (1995) Whitmore, B. C. & Schweizer, F. 1995, AJ, 109, 960
- Woodley et al. (2010a) Woodley, K. A., Gómez, M., Harris, W. E., Geisler, D., & Harris, G. L. H. 2010a, AJ, 139, 1871
- Woodley et al. (2010b) Woodley, K. A., Harris, W. E., Puzia, T. H., et al. 2010b, ApJ, 708, 1335