X-ray and TeV emissions from High Frequency Peaked BL Lacs
Abstract
The majority of the extragalactic sources yet detected at TeV photon energies belong to the class of “high frequency peaked BL Lacs” (HBLs) that exhibit a spectral energy distribution with a lower peak in the X-ray band. Such spectra are well described in terms of a log-parabolic shape with a considerable curvature, and widely interpreted as synchrotron emission from ultrarelativistic electrons outflowing in a relativistic jet; these are expected to radiate also in rays by the inverse Compton process. Recently we have compared the X-ray spectral parameter distributions of TeV detected HBLs (TBLs) with those undetected (UBLs), and found that the distributions of the peak energies are similarly symmetric around a value of a few keVs for both subclasses, while the X-ray spectra are broader for TBLs than for UBLs. Here we propose an acceleration scenario to interpret both the and the spectral curvature distributions in terms of a coherent and a stochastic acceleration mechanisms, respectively. We show how the curvature parameter of the synchrotron X rays, that depends only on the latter acceleration component, can be related to the inverse Compton luminosity in rays, so introducing a link between the X-ray and the TeV observations of HBLs.
1 Introduction
The BL Lac objects constitute a rare class of Active Galactic Nuclei (AGNs). Their observational features include: weak or absent emission lines, high radio and optical polarization, superluminal motions, and a typical double-humped spectral energy distribution (SED, ). Their continuum emission is dominated by non-thermal radiations from radio to -ray frequencies, that make them the most frequently detected class of extragalactic sources at TeV energies. The observed broadband emission is widely interpreted as arising in a jet of relativistic particles closely aligned to our line of sight (l.o.s.) (Blandford & Rees, 1978).
In the widely accepted framework of leptonic Synchrotron Self-Compton (SSC) radiation, the low-energy bump is constituted by synchrotron emission from ultrarelativistic electrons accelerated in the jets; the high-energy component is due to inverse-Compton scattering of these synchrotron photons by the same electron population (e.g., Marscher & Gear, 1985; Inoue & Takahara, 1996).
The BL Lacs come in two subclasses: the “low-frequency peaked BL Lacs” (LBLs) in which the synchrotron peak falls in the IR-optical range, and the “high-frequency peaked BL Lacs” (HBLs) where it falls in the UV-X-ray bands (Padovani & Giommi, 1995). To mark the HBLs detected at TeV energies from those undetected, we refer to the former as TBLs and to the latter as UBLs (Massaro et al., 2011a).
A convenient description of the BL Lac SEDs has been suggested by Landau et al. (1986) in terms of a log-parabolic (LP) model, i.e., a curved, parabolic shape in a double-log plot. Subsequently, the LP model has been frequently adopted to describe the X-ray spectral continuum in HBLs (Tanihata et al., 2004; Massaro et al., 2004, 2008) as well as the TeV emission from the TBLs (Massaro et al., 2006; Aharonian et al., 2009); it has been also used González-Nuevo et al. (2010); Giommi et al. (2011) to describe BL Lac SEDs in the sub-mm and infrared bands.
Such curved spectra are known to arise both by synchrotron or inverse-Compton radiations from electron distributions featuring in turn a log-parabolic shape (Massaro et al., 2004; Tramacere et al., 2007; Paggi et al., 2009).
Recently, we carried out an extensive investigation of the X-ray synchrotron emission of both TBL and UBL subclasses, based on archival observations carried out by BeppoSAX, XMM-Newton and Swift between 1997 and 2010 (Massaro et al., 2011a). On adopting the LP model, the X-ray SED of HBLs is described in terms of 3 parameters: the SED peak position , its maximum flux evaluated at (or the corresponding peak luminosities in terms of the luminosity distance ), and the spectral curvature around (Tramacere et al., 2007; Massaro et al., 2008).
Comparing the spectral properties of TBLs and UBLs, we found that: (i) the distributions of UBLs and TBLs are similarly symmetric around a value of few keVs for both subclasses; and (ii) the X-ray spectral curvature is systematically lower in UBLs than in TBLs, so that the former feature narrower spectral shapes (Massaro et al., 2011a).
In this Letter we compare the X-ray synchrotron luminosities of the TBLs and the UBLs, as derived from our previous analysis (Massaro et al., 2011a). Motivated by the observational results recalled above, we interpret both the TBLs and UBLs distributions in terms of a coherent electron acceleration scenario, and those of as due to accompanying stochastic acceleration. Finally, we provide a relation between the X-ray spectral curvatures and the IC luminosities.
We use cgs units throughout this Letter and assume a flat cosmology with km s-1 Mpc-1, and (e.g., Dunkley et al., 2009). In the following, the parameters , and refer to the observer reference frame, while all unprimed quantities refer to the jet frame.
2 Log-parabolic Synchrotron Spectra
Log-parabolic electron energy distributions (PEDs; i.e., number of particles per unit volume and Lorentz factor ) are generally written in the form , where is the electron Lorentz factor, the normalization, the mean particle energy (i.e., the peak of ) and the electron curvature parameter. Such PEDs represent the general solution of the energy and time dependent Fokker-Planck kinetic equation, that includes systematic (e.g., electrostatic or electrodynamic) and stochastic (e.g., turbulent) accelerations, together with radiative and adiabatic cooling as well as particle escape and injection terms (Kardashev, 1962; Paggi et al., 2009; Tramacere et al., 2011).
In general, both the peak energy and the peak luminosity of a synchrotron SED emitted by a curved electron distribution depend on , the peak energy of the distribution . But in the case of a log-parabolic spectrum is proportional to itself to imply
| (1) |
given that the relation between the curvature parameter of the PED and the homologous of the synchrotron SED reads simply (e.g., Massaro et al., 2006). Then for a typical TBL with 0.3 or UBL with 0.7 (Massaro et al., 2011a) the ratio of to is always 3.
The synchrotron peak energy is generally proportional to , where is the mean magnetic field and the beaming factor , with the bulk Lorentz factor in the jet and its opening angle (e.g., Paggi et al., 2009; Tramacere et al., 2009). In the case of a log-parabolic PED, this relation simplifies to the proportionality on account of Equation 1 (e.g., Massaro et al., 2010, 2011b). In addition, the synchrotron peak luminosity scales proportionally to when considering variations of the PED, spectral shape (Tramacere et al., 2011). But, in the case of log-parabolic PEDs, for the product obtains, where is the total number of emitting electrons, and is a spectral factor depending only on and ranging from 2.5 to 1.3 for the typical values of spectral curvature of the TBLs and UBLs, respectively.
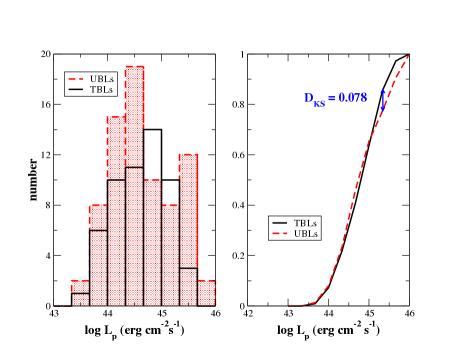
We compare the distributions of the two HBL subclasses by performing a KS test, and find that they are indistinguishable at a confidence level of 99% (see Figure 1). The distribution for the two HBL populations may still differ within one standard deviation. As complementary test, we simulate the two distributions of with the same number of events (i.e., 55 for TBLs and 76 for UBLs), adopting the statistical approach described in Massaro et al. (2011a). We considered two gaussian simulated distributions, having the same median ((UBLs) = 43.80 and (TBLs) 44.17), the same variance ((UBLs) = 0.06 and (TBLs) = 0.11) of the observed distributions and spanning the same range of . Then, we measured the KS variable, , between the two simulated distributions. We built the distribution of repeating the simulations 8000 times and we found that the probability to obtain, randomly, the observed is 86%. Thus, UBLs and TBLs have the same and distributions, and differ, significantly, only as for the spectral curvature .
Accordingly, we can assume that , , and have close values in both TBLs and UBLs. Then, given the proportionality relations for and written above, these observational results allow to consider a similar number of emitting electrons for both HBL subclasses. Moreover, the impact of limited variations of is softened on and even more on , since we expect (see Section 3.1); furthermore, the values of are closely the same for the two populations, and so turns out to be proportional to .
3 Electron acceleration in BL Lac objects
The characteristic energy of the PED, simply relates to the synchrotron SED peak energy by as said in Section 2, is mainly set by the systematic acceleration component. On the other hand, the stochastic acceleration mechanism is responsible for the curvature of the PED, related to the spectral width .
In the following, we assume the acceleration mechanisms effective in BL Lac jets to be a combination of systematic coherent acceleration, responsible for the energy peak position of the PED, and of stochastic acceleration, which accounts for the broadened PED around its peak related to the lower spectral curvature.
We consider inverse Compton radiative losses to be subdominant compared to those by synchrotron emission, consistent with the observational lack of inverse Compton dominance in the HBL SEDs, (e.g., PKS 0548-322, Aharonian et al. 2010, 1ES 0806+524, Acciari et al. 2008), for which any external component appears to be necessary to describe their spectral evolution.
3.1 Systematic acceleration
According to Cavaliere & D’Elia (2002), BL Lac jets are likely to be powered by the Blandford & Znajek (BZ, 1977) or the Blandford & Payne (1982) mechanism (see also Lovelace 1976; Ghosh & Abramowicz 1997; Krolik 1999; Livio 1999), i.e., by the extraction of rotational power from a spinning supermassive black hole via the Poynting flux associated with the adjacent magnetosphere.
As discussed by the above authors, the simple force-free condition governing these magnetospheres is likely to break down at the jet boundaries, due to considerable electric fields parallel to magnetic field (e.g. Cavaliere & Morrison 1980); such fields are present in the BZ configuration, especially at the jet boundary. Alternatively, they may result from magnetic field reconnections in current layers at the jet boundary (e.g. Litvinenko 1996, 1999); the related systematic acceleration mechanism is primarily electrostatic (see Massaro et al. 2011b for the case of gamma-ray bursts (GRBs).
However, these electric fields will be electrodynamically screened out by the embedding plasma at distances that exceed the screening length defined by
| (2) |
(Cavaliere & D’Elia, 2002). Here is the plasma frequency, is the characteristic electron Lorentz factor, is the electron mass, its electric charge, the speed of light, and the total electron (e.g., Massaro et al. 2011b).
Accordingly, the electron energy gained for each acceleration step writes
| (3) |
Assimilating , from Equations 2 and 3 we obtain the expression for the typical Lorentz factor of the accelerated electrons
| (4) |
The peak energy of the synchrotron emission for an electron of Lorentz factor 105 falls in the X-ray band, on adopting for the parameters standard values for HBLs 25, cm-3 and 1 G (e.g., Massaro et al., 2006; Paggi et al., 2009; Celotti & Ghisellini, 2008; Acciari et al., 2008; Aharonian et al., 2009).
The maximal energy radiated by an electron with Lorentz factor 105 is 0.05 TeV. Then, considering again 25 we expect the peak of the inverse Compton emission to lie at around 0.5 TeV. This is consistent with all TBL observations that have a -ray photon index typically 2 or higher in the TeV energy range, implying the energy peak of their inverse Compton component to lie below a few TeVs.
To complete the above scenario, the limiting electron Lorentz factor attained by an electron corresponds to the condition where the acceleration compensates the radiative (mainly synchrotron) losses. This occurs for
| (5) |
at values considerably higher than given by Equation 4 for our standard values of and .
Thus, the maximal energy available to the bulk of the electron population is of order 1 TeV for 1G, in agreement with the observed TeV spectral “tail” of TBLs. Finally, we note that lower values of the magnetic field coupled with high Doppler factors have also been found to provide good fits of the HBL spectra during high luminous states (e.g. Finke et al., 2008).
3.2 Geometry and timescales
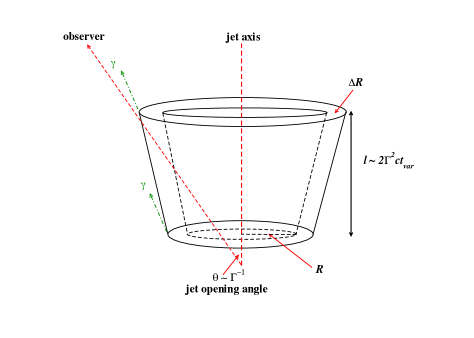
The simplest source condition obtains when the acceleration and the emitting region are cospatial. In particular, we suggest that the emission arises from thin sheaths of thickness that bound the jet with radius , as shown in Figure 2. There the particle density is low, and the screening length is sufficiently long as to allow the electrons to attain the required high energies to emit up to TeV energies as discussed above.
In this scenario the relativistic aberration of light concentrates radiation isotropically emitted in the comoving frame into a cone with opening angle , where is the bulk Lorentz factor of the jet. On the other hand, only photons emitted within around the l.o.s. will be detected by the observer.
The typical delay time between two photons emitted simultaneously in the comoving frame from different points on the jet surface is
| (6) |
The variability timescale consistent with the delay time of the photons in the observer’s frame implies an upper limit on the physical length of the emitting region of order
| (7) |
This differs from the one usually adopted based on the motion of the jet bulk toward the observer and implying . Such a “flashlight” effect is analogous to the one presented by Ryde & Petrosian (2002) in the case of GRBs, but adapted to a cylindrical geometry, and so more like a flash along the jet axis over cm, produced by a relativistic shear instability.
Observed variability timescales of order 103s imply 1015cm to hold for a bulk beaming factor 25. This is also consistent with the synchrotron loss length
| (8) |
of order 1014cm for an electron with 105 in a field 1 G. Considering these emitting regions to lie at the base of the jet close to the supermassive black hole central to the AGN, the jet radius can match the height (i.e., , see Figure 2). Assuming for the thickness of the effective acceleration and emitting region 10, the total volume filled by the emitting electrons is 1044 cm3, close to the standard values considered for leptonic radiation processes of HBLs (e.g., Massaro et al. 2006; Aharonian et al. 2009).
3.3 Stochastic acceleration
The observational evidence reported in Section 1 that UBLs feature systematically narrower spectra compared to TBLs may be interpreted in terms of a less efficient stochastic acceleration occurring in the former’s jets.
In fact, the curvature parameter of the PED is related to the stochastic acceleration term in a Fokker-Planck kinetic equation (e.g., Kardashev, 1962; Tramacere et al., 2007, 2009; Paggi et al., 2009; Tramacere et al., 2011), and is inversely proportional to the stochastic acceleration rate; thus the synchrotron SEDs are relatively broader when the stochastic acceleration is more efficient. Specifically, the PED curvature is directly related to the diffusion coefficient in the Fokker-Planck kinetic equation by . Higher values of and faster diffusion also imply less time spent in the acceleration region (see Ginzburg & Syrovatskii, 1964; Protheroe & Clay, 2004).
In a simple statistical picture, is proportional to the energy gain itself, while it is inversely proportional to the number of acceleration steps, and to the variance of the energy gain; in sum, (Massaro et al., 2004; Tramacere et al., 2011). As TBLs and UBLs show similar distributions, we can assume that both subclasses have similar values of and of the ratio. Thus higher values of correspond to lower values of ; we suggest such high values of to be comparable with smaller acceleration regions, since each acceleration step is shorter. So, the observational evidence that is systematically larger in UBLs than in TBLs is consistent with larger volumes for the former than for the latter.
Finally, we remark that while the average magnetic field is comparable in TBLs and UBLs, the difference is due to the small scale fluctuations in the power spectrum. On large scales B is related to the electric field (see Section 3.1) which is responsible for the systematic acceleration; on small scales, a turbulent component gives rise to stochastic diffusion (see e.g., Brunetti & Lazarian 2011, for a related approach concerning radio volumes). The latter component yields different numbers of acceleration steps in TBLs and UBLs, but averages out on large scales.
On the other hand, considering that the similarities between the and distributions of TBLs and UBLs have been interpreted in terms of similar numbers of emitting electrons (see Sect. 2), the curvature-volume relation described above suggests that the electron density is larger in TBLs than in UBLs, making a brighter inverse Compton peak in a SSC scenario. We conclude that the TBLs, not only have wider X-ray spectra, but are also expected to be brighter in -rays than UBLs.
In addition, the diffusion/acceleration timescale is inversely proportional to the diffusion coefficient; so low values of will correspond to less variable sources. This feature is also consistent with the lower variability and the lack of giant X-ray flares found in the whole sample of UBLs in comparison with the TBLs (Massaro et al., 2011a).
4 Conclusions and Discussion
In Massaro et al. (2011a), we analyzed and compared the X-ray spectral properties of TBLs and UBLs, finding that they have similar distributions, both symmetric around a value of few keVs, while the X-ray spectral curvature is systematically lower in the former.
In this Letter, we have compared the distributions of the two HBL subclasses, finding them similar at high level of confidence level. Then UBLs and TBLs differ mainly as for the spectral curvature ; these observational results likely imply similar numbers of emitting electrons for both subclasses.
We have proposed to interpret the and distributions on assuming that the electron energy gain is due to both coherent and stochastic particle accelerations. The scenario is based on re-acceleration rather than continuous injection of fresh highly relativistic electrons; re-acceleration occurs via both systematic and stochastic mechanisms, with equilibrium occurring between the overall acceleration rate and the radiative losses.
Describing the coherent acceleration in terms of energy gain from an electric field, we have derived a relation for the expected particle Lorentz factors 105. Thus for a typical HBL with magnetic fields B 1 G, plasma density 1 cm-3 and a beaming factor 25, the expected synchrotron peak energy is at 1 keV, as in fact observed in the X-ray SEDs of HBLs (Massaro et al., 2008, 2011a).
On the other hand, the stochastic acceleration component is mainly responsible for spectral broadening around . In fact, the curvature of the X-ray spectra is only dependent on the stochastic acceleration term in a Fokker-Planck equation, and thus is inversely proportional to the diffusion coefficient and to the stochastic acceleration rate , that is, . Thus, we interpret the narrow X-ray SEDs of UBLs in terms of less efficient stochastic acceleration compared to TBLs.
Finally, pursuing the stochastic acceleration scenario we have linked the curvature parameter to the volume of the emitting region, through its inverse proportionality to the number of acceleration steps (see Section 3.3). This curvature-volume relation, combined with the above consideration of similar values of , indicates the emitting electron density to be larger in TBLs than in UBLs, making the inverse Compton peak brighter in the former than in the latter.
Thus electron energies sufficiently high to radiate in the TeV range are related to sufficient bright luminosities for effective detection. Conversely, narrower SEDs and lower fluxes make UBLs harder to detect in the TeV range than TBLs, in agreement with our previous results concerning their X-ray observations.
References
- Acciari et al. (2008) Acciari, V. et al. 2008 ApJ 690, 126L
- Aharonian et al. (2009) Aharonian, F., Akhperjanian, A. G., Anton, G., et al. 2009, A&A, 502, 749
- Aharonian et al. (2010) Aharonian, F., Akhperjanian, A. G., Anton, G., et al. 2010 A&A, 521, 69
- Blandford & Znajek (1977) Blandford, R. D., Znajek, R. L. 1977 MNRAS, 179, 433
- Blandford & Rees (1978) Blandford, R. D., Rees, M. J., 1978, PROC. P̈ittsburgh Conference on BL Lac objects”, 328
- Blandford & Payne (1982) Blandford, R.D., & Payne, D. G. 1982, MNRAS, 199, 883
- Cavaliere & Morrison (1980) Cavaliere, A. & Morrison, P. 1980 ApJ, 238L, 63
- Cavaliere & D’Elia (2002) Cavaliere, C. & D’Elia V. 2002 ApJ, 571, 226
- Celotti & Ghisellini (2008) Celotti, A. & Ghisellini, G. 2008 MNRAS, 385, 283
- Dunkley et al. (2009) Dunkley, J., 2009 ApJ, 701, 1804
- Finke et al. (2008) Finke, J. D., Dermer, C. D. & Bottcher, M. 2008 ApJ, 686, 181
- Ghosh & Abramowicz (1997) Ghosh, P., Abramowicz, M. 1997, MNRAS, 292, 887
- Giommi et al. (2011) Giommi, P. et al. 2011 A&A in press [arXiv:1108.1114]
- Ginzburg & Syrovatskii (1964) Ginzburg, V. L. & Syrovatskii, S. I. ”The origin of Cosmic rays”, New York: Macmillan, 1964
- González-Nuevo et al. (2010) González-Nuevo, J., de Zotti, G., Andreani, P., Barton, E., J., Bertoldi, F., et al. 2010, A&A, 518L, 38
- Inoue & Takahara (1996) Inoue, S., Takahara F., 1996, ApJ, 463, 555
- Kardashev (1962) Kardashev, N. S., 1962, SvA, 6, 317
- Krolik (1999) Krolik, J. H. 1999, ApJ, 515, 73
- Landau et al. (1986) Landau, R., Golish, B., Jones, T. J., et al. 1986, ApJ, 308, L78
- Litvinenko (1996) Litvinenko, Y. E. 1996 ApJ, 462, 997
- Litvinenko (1999) Litvinenko, Y. E. 1999 A&A, 349, 68
- Livio (1999) Livio, M., Ogilvie, G., & Pringle, J. 1999, ApJ, 512, 100
- Lovelace (1976) Lovelace, R. V. E. 1976 Natur, 262, 649
- Marscher & Gear (1985) Marscher, A. P., Gear, W. K. 1985, ApJ, 298, 114
- Massaro et al. (2004) Massaro, E., Perri, M., Giommi, P., et al. 2004, A&A, 422, 103
- Massaro et al. (2006) Massaro, E., Tramacere, A., Perri, M., Giommi, P., Tosti, G., 2006, A&A, 448, 861
- Massaro et al. (2008) Massaro, F., Tramacere A., Cavaliere A., et al. A&A 2008a, 478, 395
- Massaro et al. (2010) Massaro, F., Grindlay, J. E., Paggi, A. 2010a, ApJL, 714, 299
- Massaro et al. (2011a) Massaro, F., Paggi, A., Elvis, M., Cavaliere, A. 2011 ApJ, 739, 73 (M11)
- Massaro et al. (2011b) Massaro, F. & Grindlay, J. E. 2011 ApJ, 727L, 1
- Massaro et al. (2011c) Massaro, F., Harris, D. E. & Cheung, C. C. 2011 ApJS in press
- Padovani & Giommi (1995) Padovani, P., & Giommi, P., 1995, MNRAS, 277, 1477
- Paggi et al. (2009) Paggi, A., Massaro, F., Vittorini, V. et al. 2009 A&A, 504, 821
- Protheroe & Clay (2004) Protheroe R. J. & Clay, R. W. 2004 PASA, 21, 1
- Ryde & Petrosian (2002) Ryde, F. & Petrosian, V. 2002 ApJ, 578, 290
- Tanihata et al. (2004) Tanihata, C., Kataoka, J., Takahashi, T., et al. 2004, ApJ, 601, 759
- Tramacere et al. (2007) Tramacere, A., Massaro, F., Cavaliere, A., 2007, A&A, 466, 521
- Tramacere et al. (2009) Tramacere, A., Giommi, P., Perri, M. et al. 2009 A&A, 501, 879
- Tramacere et al. (2011) Tramacere, A., Massaro, E., & A. M. Taylor et al. 2011 ApJ, in press