Absolute specific heat measurements of a microgram Pb crystal using ac nanocalorimetry
Abstract
Heat capacity measurements using the ac steady state method are often considered difficult to provide absolute accuracy. By adjusting the working frequency to maintain a constant phase and using the phase information to obtain the heat capacity, we have found that it is possible to achieve good absolute accuracy. Here we present a thermodynamic study of a Pb superconducting crystal to demonstrate the newly opened capabilities. The sample is measured using a differential membrane-based calorimeter. The custom-made calorimetric cell is a pile of thin film Ti heater, insulation layer and thermometer fabricated in the center of two Si3N4 membranes. It has a background heat capacity at , decreasing to at . The sample is characterized at temperatures down to . The zero field transition at has a width and displays no upturn in . From the heat capacity jump at and the extrapolated Sommerfeld term we find . The latent heat curve obtained from the zero field heat capacity measurement, and the deviations of the thermodynamic critical field from the empirical expression are discussed. Both analyses give results in good agreement with literature.
1 Introduction
Calorimetry is a powerful tool that allows complete thermodynamic characterization of materials. In particular, nanocaloric measurements are suitable to study phase transitions and specific heat dependencies of new superconductors, often available in just g quantities. In the past two decades much attention was devoted to studies of high- superconductors [1] and, more recently, the iron-based superconductors [2]. The electronic specific heat is one of the crucial parameters for understanding high-temperature superconductivity, but it is very hard to measure with good absolute accuracy. Furthermore, it represents just a fraction of the total heat capacity and therefore requires high resolution techniques. The AC steady state method [3] is a very sensitive technique which usually gives only relative heat capacity values [1] because of the difficulties related to the choice of the working frequency.
In this method, a certain power modulates the temperature of sample and calorimetric cell that oscillate with amplitude and a phase lag . The heat capacity is given by [4]:
| (1) |
The optimal frequency range is usually quite narrow and depends on several factors, such as temperature, sample heat capacity and device thermal link. If is too high the sample becomes thermally disconnected and the signal probes just the heat capacity of the cell. On the other hand, the resolution degrades at too low frequencies [5]. We have implemented a measurement method which avoids these problems and furnishes absolute values [6]. It requires continuous tuning of the frequency based on the reading of the phase. The measured heat capacity can be written as:
| (2) |
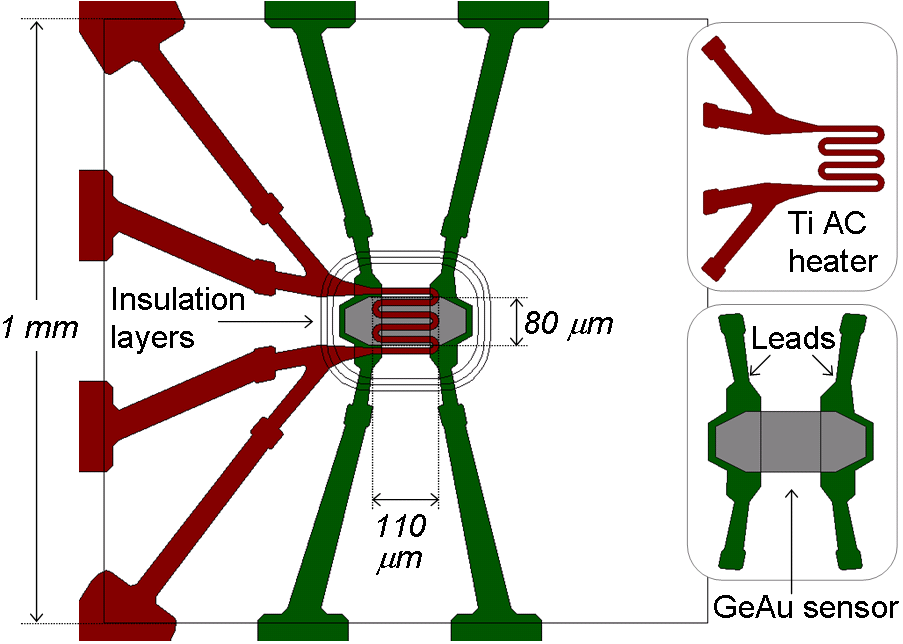
where is the background heat capacity (see Fig. 1) and is a frequency dependent function. Inaccuracies in the evaluation of the sample heat capacity are due to non-zero values of which, in turn, are caused by a finite thermal conductance between sample and cell. The tangent of the phase is an excellent indicator of the working conditions. It has a local maximum at a certain frequency , after which the absolute accuracy decreases quickly and the working conditions become unstable. The key parameter which controls this maximum is : . In general, the absolute error at the maximum is . By tuning to keep a constant phase the error can be minimized while maintaining a good resolution. To demonstrate the effectiveness of the technique we here characterize a microgram Pb sample.
2 Experimental
The calorimetric cell used for measuring the Pb sample is shown in Fig. 1. The crystal is selected to match the dimensions of the calorimeter central area. To reach a uniform temperature along the sample thickness at a given frequency, the crystal should be thinner than the length of the thermal wave. It was chosen to be less than thick. Apiezon grease, with thermal conductance , is used to ensure thermal contact between the sample and the pile of heater and thermometer underneath. Because of the design with all layers stacked on top of each other, the relaxation time within the calorimetric cell is negligible. In our case, at room temperature. During each temperature scan the frequency is automatically varied to maintain the phase constant well below . Between and the drive frequency spans the range . The temperature oscillation amplitude is chosen to be a certain fraction of the absolute temperature , and is changed accordingly. For a certain phase, the resolution improves with higher temperature oscillation amplitudes. For example, a typical resolution is achieved at for a integration time constant. The drawback of a high ratio is a smearing effect of the absolute temperature scale. By decreasing it is possible to contain this effect still maintaining a reasonable resolution. To measure the superconducting transition we used and time constant which gave . The empty cell, and cell with grease were pre-characterized to be able to subtract each contribution from the total signal. To explain the residual in the superconducting state and obtain absolute agreement with the specific heat at , reported by Shiffman et al. [7], of the normal state heat capacity had to be subtracted in addition to the device background. Whether this unexplained sample contribution is in reality due an absolute accuracy issue is left as an open question.
3 Results
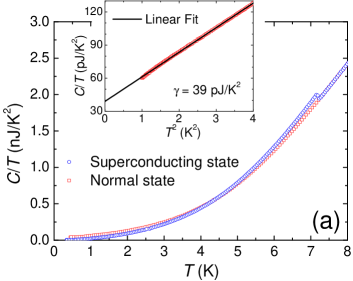
The Pb sample was characterized down to . To obtain a pure superconducting state curve a small field was applied to compensate the remanent field of the magnet. The normal state was measured in . The curves of the Pb sample are shown in Fig. 2a. The low temperature data (inset of Fig. 2a) were fitted by a linear function to extrapolate the normal state electronic heat capacity at zero temperature . The zero field superconducting transition displayed in Fig. 2b, has a width and no upturn in .
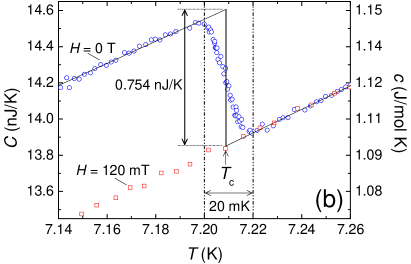
From the step height at and the Sommerfeld term , we find in agreement with the values obtained from magnetic [8] and other calorimetric [7, 9] measurements. The normalized slope of the specific heat discontinuity at is an indicator of the coupling strength of the superconductor. From the data in Fig. 2 we obtain , close to the value obtained from strong-coupling theory [10].
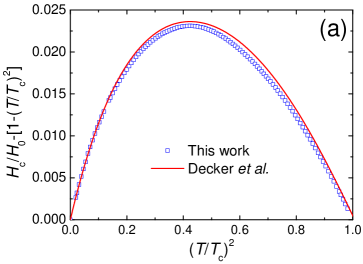
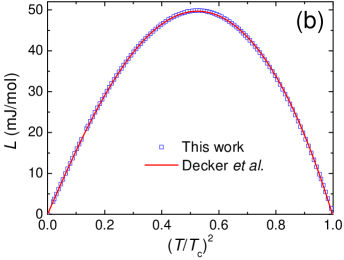
Using the experimentally determined , one can calculate and by integrating and respectively, from to . By imposing the conservation law at on the free energy difference , the condensation energy , is obtained. To obtain the most precise measurement of the sample volume, was taken to be equal to the literature value [10]. The volume is equal to , giving . The temperature dependence of the deviation of from the two fluid model, is plotted in Fig. 3a. Pb shows a positive deviation curve related to the strong electron-phonon coupling, in contrast with the negative values of the weak-coupling superconductors. The position of the maximum deviation is at , close to the experimentally determined functional form provided by Decker et al. [8], the experimental value by Chanin et al. [11], and the strong-coupling theory calculation of Swihart et al. [12]. The maximum deviation for our data, , is slightly lower than the the values of Decker, , and Swihart, , but higher than the found by Chanin. The latent heat is shown in Fig. 3b. Our data match the curve derived using the power series expansion of by Decker et al. [8]. The maximum falls at for both curves.
4 Summary and conclusions
We recently proposed an experimental procedure to obtain both good resolution and absolute accuracy in AC calorimetry [6]. The results reported in this paper on a Pb sample demonstrate the feasibility and effectiveness of this method. From the presented low temperature superconducting and normal state heat capacity curves, thermodynamic properties such as Sommerfeld term , reduced jump anomaly and normalized slope , are found in good agreement with literature values. The accuracy achieved is further confirmed by the obtained temperature dependence of and latent heat. \ackSupport from the the Swedish Research Council and the Knut and Alice Wallenberg Foundation is acknowledged. We would like to thank V. M. Krasnov for useful discussions and for providing the Pb sample.
References
References
- [1] Fisher R A, Gordon J E and Phillips N E 2007 in Handbook of High-Temperature Superconductivity, ed J R Schrieffer and J S Brooks (Springer, Berlin)
- [2] Paglione J and Greene R L 2008 Nature Phys. 6 645
- [3] Sullivan P F and Seidel G 1968 Phys. Rev 173 679
- [4] Gmelin e 1997 Thermochim. Acta 29 1
- [5] Rydh A 2006 in Encyclopedia of Materials: Science and Technology online update, ed K H J Buschow, M C Flemings, R W Cahn, P Veyssire, E J Kramer and S Mahajan (Oxford: Elsevier Ltd)
- [6] Tagliati S and Rydh A, Thermochim. Acta, in press. http://dx.doi.org/10.1016/j.tca.2011.04.006
- [7] Schiffman C A, Cochran J F and Garber M 1963 J. Phys. Chem. Solids 24 1369
- [8] Decker D L, Mapother D E and Shaw R W 1958 Phys. Rev. 112 1888
- [9] Neighbor J E, Cochran J F and Schiffman C A 1966 Phys. Rev. 155 384
- [10] Carbotte J P 1990 Rev. Mod. Phys. 62 1027
- [11] Chanin G and Torre J P 1972 Phys. Rev. B 5 4357
- [12] Swihart J C, Scalopino D J and Wada Y 1965 Phys. Rev. Lett. 14 106