Near-Infrared H2 and Continuum Survey of Extended Green Objects
Abstract
The GLIMPSE survey has revealed a number of “Extended Green Objects” (EGOs) which display extended emission at 4.5 . These EGOs are potential candidates for high mass protostellar outflows. We have used high resolution () H2 1-0 S(1) line, , and -band images from the United Kingdom Infrared Telescope to study 34 EGOs to investigate their nature. We found that 12 EGOs exhibit H2 outflows (two with chains of H2 knotty structures; five with extended H2 bipolar structures; three with extended H2 lobes; two with pairs of H2 knots). In the 12 EGOs with H2 outflows, three of them exhibit similar morphologies between the 4.5 and H2 emission. However, the remaining 9 EGOs show that the H2 features are more extended than the continuum features, and the H2 emission is seldom associated with continuum emission. Furthermore, the morphologies of the near-infrared continuum and 4.5 emission are similar to each other for those EGOs with -band emission, implying that at least a part of the IRAC-band continuum emission of EGOs comes from scattered light from the embedded YSOs.
1 INTRODUCTION
Massive stars play an important role in the evolution of galaxies. Once they are born, their outflows, intense UV radiation, and stellar winds influence the nearby interstellar medium, and their feedback could induce the next generation of star formation (Zinnecker & Yorke, 2007; Lee et al., 2005; Lee & Chen, 2007; Karr et al., 2009). However, the formation mechanism of massive stars is still unclear. One of reasons for this is that massive protostars are very embedded, and hence can only be seen in infrared and radio. Since the space telescope was launched, it has provided a good chance to study this early phase of star formation. provides better resolution than previous infrared space telescopes ( at IRAC bands), and is able to survey large regions. In the Galactic Legacy Infrared Mid-Plane Survey Extraordinaire (GLIMPSE) I survey at IRAC wavelengths (; , Benjamin et al., 2003), Cyganowski et al. (2008) identified more than 300 massive outflow candidates in the Galactic Plane. These candidates show excess emission at 4.5 , and have been dubbed “Extended Green Objects (EGOs)” due to the common practice of assigning blue, green and red to 3.6, 4.5, and 8 bands in images. The most common explanation is that they are outflows from massive young stars, due to their association with IRDCs, thought to be the birthplace of massive stars, and with Class II 6.7 GHz masers which are radiatively pumped by massive YSOs (Minier et al., 2003). The 4.5 emission may come from H2 ( = 0–0, S(9, 10, 11)) and/or CO ( = 1–0) band heads (Reach et al., 2006) which can be excited by shocks from outflows (Cyganowski et al., 2008).
Since their identification, there have been several attempts to investigate the nature of these EGOs. Approximately two-third of EGOs are associated with Class I 44 GHz methanol masers (Chen et al., 2009) which are likely to be an outflow tracer. Later, high resolution VLA observations showed that Class II methanol masers are tightly concentrated around 24 sources, and Class I masers tracing molecular outflows are widely distributed around the diffuse 4.5 emission (Cyganowski et al., 2009). Chen et al. (2010) and Cyganowski et al. (2009) used outflow tracers (HCO+) to survey EGOs, and their line profiles also indicate the presence of outflows. EGOs (or green fuzzies, Chambers et al., 2009) have been seen in known massive star forming regions (e.g., Davis et al., 2007; Smith et al., 2006; Shepherd et al., 2007; Cyganowski et al., 2007; Varricatt, 2011), IRDC cores (Chambers et al., 2009), and jets associated with low-mass protostars (e.g., Zhang & Wang, 2009; Takami et al., 2010).
Molecular line interferometric observations can also help to identify outflows from massive YSOs, and provide higher resolution and kinematic information for outflows (see review by Beuther & Shepherd, 2005). EGO G11.920.61 and G19.010.03 were observed using SMA and CARMA (Cyganowski et al., 2011). Both of them have bipolar molecular outflows, coincident with the 4.5 lobes.
The above mentioned studies give evidence that some EGOs are related to outflows; however it is unclear if the 4.5 emission in EGOs comes from line emission or not. The best way to answer this question is to take spectra of EGOs in the IRAC 4.5 band. The Infrared Spectrograph (IRS) on-board can observe only wavelengths longer than 5.3 , so IRS itself can not directly determine the source of diffuse 4.5 emission. To determine the origin of what they denote as “green fuzzies”, De Buizer & Vacca (2010) took spectra of two EGOs (EGO G19.880.53 and EGO G49.270.34) in - (2.95 – 4.12 ) and - (4.47 – 5.75 ) bands. One of them (EGO G19.88-0.53) does exhibit pure molecular hydrogen line emission at 4.695 ( ), which dominates in the wavelength range 4–5 (no CO band heads are detected). This result supports the idea that the green fuzzy emission is excited by outflow shocks. However, the other source (EGO G49.27-0.34) only shows continuum emission in the above spectral ranges without line emission. They suggested that the green fuzzy emission is the result of extinction and a magnification in the color stretch in the 4.5 band.
In this paper, we use H2, -, and -band observations from the United Kingdom Infrared Telescope (UKIRT) to study the near-infrared properties of EGOs. Near-infrared H2 1-0 S(1) observations have been used to study shock-excited outflows from YSOs (Davis et al., 2009; Stecklum et al., 2009), and provide a good resolution (1) which allows us to study the morphologies of H2 outflows in detail. Compared with continuum images of Spitzer, our continuum-subtracted H2 images, which focus on shock-excited H2 line emission, are helpful for determining if the EGOs are associated with H2 outflows or not.
This paper is organized as follows. We describe the observations and results in Section 2 and 3, respectively. We discuss the near-infrared properties of EGOs in Section 4, and summarize our conclusions in Section 5.
2 TARGET SELECTION, OBSERVATIONS, AND DATA REDUCTION
Narrow-band images of H2 =1-0 S(1) emission (2.122 ) were obtained through the UKIRT Widefield Infrared Survey for H2 (UWISH2, Froebrich et al., 2011). UWISH2 began in July 2009 and was completed in August 2011; it surveyed the inner Galactic Plane () with the Wide Field Camera (WFCAM) at UKIRT. The observations were taken with a narrow band filter () at 2.122 with 720 seconds integration time per pixel. The median seeing in H2 images is 0.7; only a few images were taken with seeing . The 5 detection limit of point sources is 18 mag in , and the surface brightness limit is W m-2 arcsec-2 at the typical seeing (Froebrich et al., 2011).
The - and -band images were obtained through the WSA archive for the UKIRT Infrared Deep Sky Survey Galactic Plane Survey (UKIDSS GPS, Lucas et al., 2008). GPS is one of the five surveys within UKIDSS, and will survey more than 1800 square degrees of the northern equatorial Galactic plane in , and -bands with WFCAM. The 5 detection limit of point sources are =19 and =18.5 mag, and a seeing 1 in band is requested by the survey. -band (2.2 ) images were used to construct our continuum-subtracted H2 images of EGOs, and we compared their morphologies with the H2 and continuum (-band and 4.5 ) emission.
The UWISH2 data for 12 EGOs were obtained in the earliest phase of the survey as high priority targets. These targets were selected as follows. We investigated GPS -band images of EGOs in Table 1 of Cyganowski et al. (2008), before the H2 observations. If there was -band continuum emission within a 20 radius of the EGO’s positions, we included them as high priority targets for UWISH2 observations in 2009. The criterion is not only restricted to the EGO’s positions, but also extended to a 20 radius, as the morphologies of H2 outflows may be more extended than those of -band continuum. Besides these preselected 12 EGOs, another 22 EGOs were covered by the UWISH2 survey. In this paper, we studied a total of 34 EGOs which were observed by UWISH2 in 2009. Table 1 shows the list of these targets. The GPS covers all the targets in -band and -band except for EGO G35.20-0.74 (-band only).
Data reduction was done by the Cambridge Astronomical Survey Unit (CASU). At CASU, the WFCAM pipeline is responsible for flat fielding and sky correction of the image data, and stacking frames as described by Dye et al. (2006). Reduced -band and H2 images were accessed via the Wide Field Astronomy Unit111http://www.roe.ac.uk/ifa/wfau/.
The continuum-subtracted H2 images were obtained as follows. Using IDL, we shifted and rotated each -band image to match the coordinates of the corresponding H2 image. Then we compared the full width at half maximum (FWHM) of the -band and H2 images for each EGO, and smoothed the smaller FWHM to the larger one. Before subtraction, we scaled the -band fluxes to match their stellar fluxes to those in the H2 image. Then, a continuum-subtracted H2 image of each EGO was generated by subtracting the -band from the H2 image.
In addition to the H2 and -band images described above, IRAC and MIPS 24 images from the GLIMPSE (Churchwell et al., 2009) and MIPSGAL (Carey et al., 2009) legacy surveys, respectively, were obtained from the archive data for comparison. The data had been reduced with post Basic Calibrated Data (post-BCD) piplines developed by the Infrared Processing and Analysis Center (IPAC). The IRAC images are used to compare the spatial distribution of the EGOs with continuum-subtracted H2 and -band images. The MIPS 24 images will be used to identify YSOs from thermal dust emission.
3 RESULTS
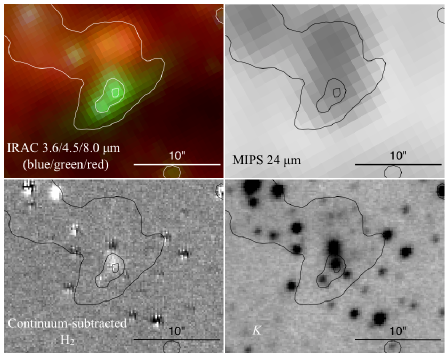
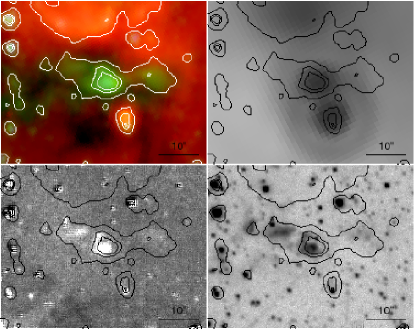
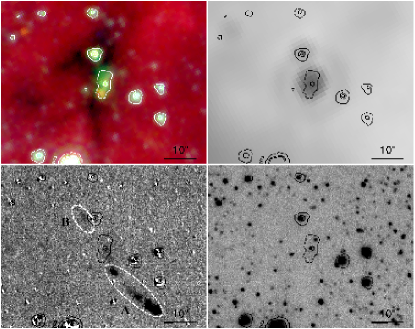
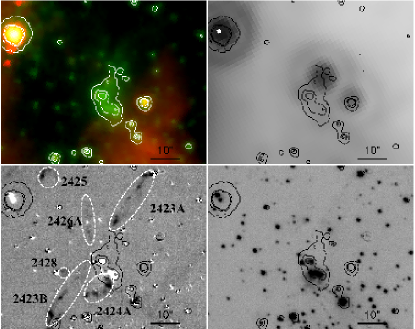
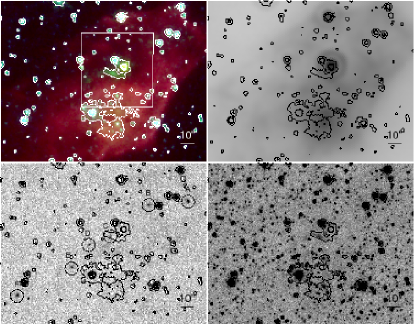
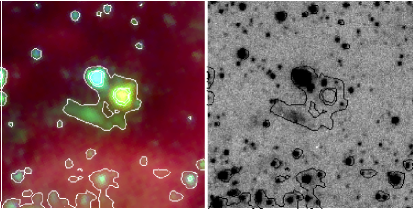
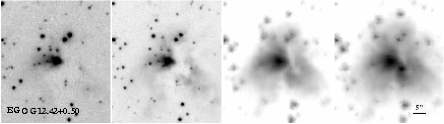
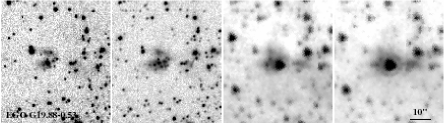
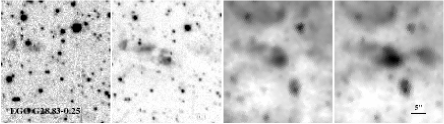
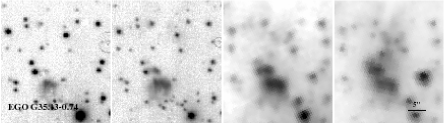
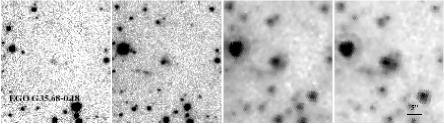
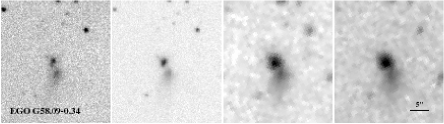
Of our 34 object sample, 23 sources show clear detections of positive (i.e., H2 emission) or/and negative (presumably due to continuum, as described below in detail) valued features, in the continuum-subtracted H2 images. Figures 1 - 23 show their images in the IRAC bands (3.6, 4.5, and 8.0 ), MIPS 24 , continuum-subtracted H2, and -band.
Table 1 summarizes the detections of H2, , and -band emission. Based on the continuum-subtraced H2 images, 34 EGOs are categorized as follows: those associated with H2 outflows (Y, 12 objects); those associated with possible H2 outflows, (Y?, 4 objects); and finally, those with no H2 detection (N, 18 objects). In addition, we include distances of EGOs (Chen et al., 2010; Cyganowski et al., 2009) in Table 1. Molecular Hydrogen Emission-Line Objects (MHOs222http://www.jach.hawaii.edu/UKIRT/MHCat/, Davis et al., 2010) numbers are assigned for newly identified H2 outflows in Table 2.
In Sections 3.1 and 3.2, we describe the details of the results for the H2 and continuum emission ( and -band), respectively. The details for the 23 selected individual objects are presented in the Appendix.
3.1 H2 Emission
In the continuum-subtracted H2 images, 16 objects show positive valued features due to H2 emission (seen in black in Figures 1 - 23). Seven EGOs are associated with an extended bipolar structure or a set of aligned knots in these images (EGO G19.88-0.53, G35.04-0.47, G35.13-0.74, G35.15+0.80, G35.20-0.74, G35.79-0.17, and G35.83-0.20). Two EGOs exhibit two H2 knots (EGO 19.01-0.03 and G54.45+1.01). Three EGOs only show one lobe in H2 emission (EGO G11.92-0.61, G16.61-0.24, and G35.68-0.18). Four EGOs show possible H2 outflows (EGO G12.02-0.21, G12.42+0.50, G12.91-0.03, and G16.59-0.05), exhibiting either extended H2 emission or an isolated H2 knot. The extended emission in the continuum-subtracted H2 image of EGO G12.42+0.50 could be due to residuals from the subtraction of bright continuum emission of the YSOs.
In most of the above objects, the H2 emission appears to be associated with a monopolar or bipolar H2 outflow driven by a single protostar. The protostellar outflows have a bipolar geometry in most cases, and the absence of the counterpart in some of the outflows is attributed to obscuration of the counterflow by extinction (see Arce et al., 2007; Bally et al., 2007, for review)
However, EGO G19.88-0.53 and G35.13-0.74 seem to be associated with more than one H2 outflow. Generally, the H2 outflows of the EGOs usually show small opening angles (highly collimated outflows). In contrast, the H2 outflow of EGO G35.20-0.74 shows an hourglass shape with a large opening angle, .
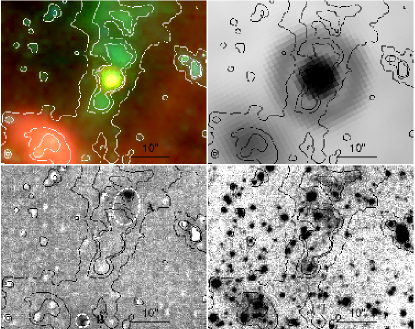
In most of the above objects, the H2 emission is more extended than the 4.5 emission, and faint or absent at the regions where the 4.5 emission is bright. The 4.5 emission shows a counterpart to the H2 features in the following three EGOs. In G19.88-0.53, diffuse 4.5 emission is observed at the base of the western lobe of the H2 outflow. De Buizer & Vacca (2010) conducted ground-based spectroscopy of this emission component at 2.9-4.1 and 4.5-5.8 , and their spectra indicate that the emission in the IRAC 4.5 should be dominated by H2 emission. In G35.68-0.18, the H2 feature “B” indicated in Figure 19 shows a faint counterpart in the 4.5 emission. In G35.83-0.20, three bright H2 knots in Figure 21 are also seen in the 4.5 image. It is notable, however, the GLIMPSE image also contains a dozen brighter features associated with the 4.5 emission.
Figure 24 shows histograms of the distances for EGOs with H2 (dashed line histogram) and without (dotted line histogram) detections. We only include those EGOs with distances in Table 1, but exclude possible H2 outflows in the histogram. In general, the distances of the EGOs without H2 outflow detections seem to be larger than those with H2 outflow detections. Beyond four kpc, the numbers of H2 outflow detections drop, but the numbers of non-detections increase. Therefore, our H2 outflow detection has a bias toward distance, and we probably miss H2 outflow detections for some distant EGOs.
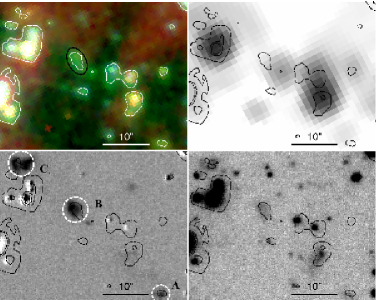
In the continuum-subtracted H2 images (Figures 1 - 23), the positions of extended -band emission (see Section 3.2 and Appendix for details) usually show negative valued features (seen in white in Figures 1 - 23) that are likely to represent continuum emission with a large infrared excess and high extinction, and may be light scattered from the YSOs. This type of emission can also be seen around other H2 outflow bases (Froebrich & Ioannidis, 2011; Varricatt et al., 2010). There are 12 EGOs associated with negative valued features around the positions of the EGOs in the continuum-subtracted H2 images. Six of them are associated with H2 outflows (EGO G11.92-0.61, G16.61-0.24, G19.88-0.53, G35.13-0.74, G35.20-0.74, and G54.45+1.01), and the other six are not (EGO G10.34-0.14, G12.20-0.03, G19.61-0.12, G20.24+0.07, G28.83-0.25, and G58.09-0.34).
3.2 Continuum Emission
Figures 1 - 23 show that at least 9 of the 23 EGOs show similar morphologies in the and 4.5 emission (EGO G12.42+0.50, G19.01-0.03, G28.83-0.25, G35.13-0.74, G35.15+0.80, G35.20-0.74, G35.68-0.18, G35.83-0.20, and G54.45+1.01), although the signal to noise ratios of the -band emission are lower than those of the 4.5 emission. In the remaining 13 EGOs, 10 EGOs exhibit extended -band emission at the position of the EGOs (EGO G10.34-0.14, G11.92-0.61, G12.20-0.03, G12.91-0.03, G16.61-0.24, G19.61-0.12, G19.88-0.53, G20.24+0.07, G35.79-0.17, and G58.09-0.34), and three EGOs show a -band point source around the 4.5 peak of each EGO (EGO G12.02-0.21, G16.59-0.05, and G35.04-0.47). One or more 24 sources are usually located near the 4.5 peak of the majority of the EGOs.
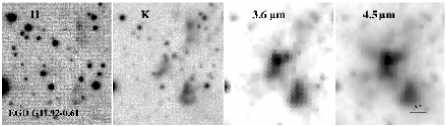
In the 23 EGO sample, 7 are detected in -band. Figure 25 shows these objects in -, -band, 3.6, and 4.5 . In these figures, the flux distribution gradually changes with wavelength. In EGO G11.92-0.61, G28.83-0.25 and G35.68-0.18, the extended emission is marginal in the -band, and more apparent at longer wavelengths. In EGO G12.42+0.50 the -band emission is observed only at the peak of the EGO at 3.6 and 4.5 . The remaining extended components, in particular that to the southwest, are apparent only at 3.6 and 4.5 . In EGO 19.88-0.53, the bright point source is seen at the center only at 3.6 and 4.5 . The simplest explanation of the above characteristics is the effect of extinction at different wavelengths.
4 DISCUSSION
4.1 Morphology of H2 Outflow
High-mass protostellar outflows show a variety of morphologies, and their driving mechanism is less clear than for low-mass protostellar outflows. Well known energetic outflows like the Orion BN/KL and DR 21 outflows show a wide opening angle and complicated shock structures (see e.g., Kaifu et al., 2000; Davis & Smith, 1996). In contrast, some high-mass protostar drive a relatively collimated outflow analogous to that associated with low-mass protostars (Varricatt et al., 2010). These tend to be associated with a protostar with spectral types of late O or B, not with the earlier spectral types (see Beuther & Shepherd, 2005; Arce et al., 2007, for review).
Beuther & Shepherd (2005) proposed an evolution scenario of outflows from massive stars. In their scenario, an outflow from a massive star is collimated in their early evolutionary phases. As it grows by accretion, it reaches the main sequence, associated with an ultra compact H II region. The opening angle of the outflow could then be increased by the ionized wind from the massive star.
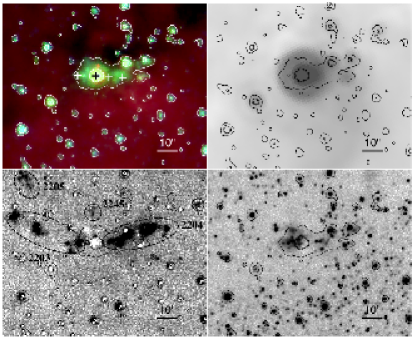
As mentioned in Section 3.1, the H2 emission in most of the EGOs is associated with a collimated outflow. This suggests that they are relatively young, or their masses are not very high, according to the scenario proposed by Beuther & Shepherd (2005). In contrast, EGO G35.20-0.74 exhibits a large opening angle H2 outflow. The hourglass shape outflow is unlikely to be a composite of two collimated outflows at different directions, because the shapes, lengths, and intensities of MHO 2431C and D are similar (Figure 18). In addition, CO interferometric observations also support that it is a single outflow with large opening angle (Birks et al., 2006). The H2 outflow is likely to be driven by a YSO which is associated with an ultra compact H II region (Dent et al., 1984) at the outflow base, and it is the only H2 outflow with a known H II region in our sample. Our results support the evolution scenario of Beuther & Shepherd (2005).
In our sample, two EGOs are likely to be associated with H2 outflows from multiple protostars (EGO G19.88-0.53 and G35.13-0.74). Three radio sources are located near the outflow base of EGO G19.88-0.53 (Zapata et al., 2006), and EGO G35.13-0.74 is associated with a young star cluster Mercer 14 (Froebrich & Ioannidis, 2011).
4.2 Origin of the Extended IRAC Emission Associated with EGOs
In this section, we discuss the emission mechanisms of those EGOs with near-infrared counterparts, based on the 23 EGOs mentioned in §3. Originally, Cyganowski et al. (2008) suggested that the extended 4.5 emission of EGOs traces shocked molecular gas in outflows. However, some studies suggest that the 4.5 emission come from scattered light. For example, the appearance of NGC 6334 V is similar to that of EGOs in the three-color image. In the 2 polarimetric image, NGC 6334 V shows two highly polarized reflection nebulae (scattered light) coinciding with the 4.5 emission and the bipolar outflow (Simpson et al., 2009). Another source, EGO G35.20-0.74 known as G35.2N, also shows a highly polarized extended reflection nebulae in -band (Walther et al., 1990). These two cases suggest that -band emission represents scattered emission from embedded YSOs, which is consistent with results from Hodapp (1994) and Connelley et al. (2007). IRAS 17527-2439 has an S-shaped H2 outflow which may be caused by the precession of a jet (Varricatt, 2011), and its appearance in the image is similar to that of EGOs. Interestingly, the morphologies of the continuum ( and bands) and H2 emission of IRAS 17527-2439 are different. The continuum emission in and bands in the direction of the outflow is rotated counterclockwise with respect to the H2 outflow, suggesting that the continuum emission emerges from the outflow cavity of the YSO (Varricatt, 2011). Recently, Simpson et al. (2012) took spectra of EGOs at 5 – 10 wavelength, and found that the 4.5 emission is not due to H2 lines which would be too faint to contribute the IRAC 4.5 emission.
In our sample, only three of the 12 EGOs with H2 outflows show a distribution of the H2 emission similar to that of the 4.5 emission (EGO G35.68-0.18, G35.83-0.20, and west lobe of EGO G19.88-0.53). The 4.5 emission of these three EGOs likely comes from H2 emission. The - and -band spectrum of EGO G19.88-0.53 show H2 emission (De Buizer & Vacca, 2010), supporting this idea.
In contrast, for the remaining 9 EGOs with H2 outflows in our sample, we found that the morphologies of the 4.5 and H2 emission are different. The peaks of the 4.5 emission are rarely associated with H2 emission, and the 4.5 emission generally appears close to the bases of the outflows (embedded YSOs). The H2 emission is more extended than the 4.5 emission which is usually weak or not detected at the peak of the H2 emission. This suggests that the origins of the H2 and 4.5 emission are different.
For those EGOs with -band emission, the morphologies of the extended -band emission and the 4.5 emission resemble each other, suggesting the same origin. Furthermore, seven of the sources with extended -band emission also show extended emission in the -band, with flux distributions similar to the -band emission. This -band emission is not likely to be due to shocked emission, since (1) the flux distribution is significantly different between H2 and -band emission; and (2) shocked emission in the -band should be so faint that it is not likely to be observed (e.g., Gredel, 1994; Everett et al., 1995).
These observed characteristics can be consistently explained if the extended emission at , , 3.6, and 4.5 is due to scattered continuum (Hodapp, 1994; Connelley et al., 2007; Simpson et al., 2009; Walther et al., 1990). Indeed, all of these sources are associated with 24 source(s), i.e., a protostar or multiple protostars, which are the sources of the scattered light. In Figure 25, the gradual change in flux distribution with wavelength is consistent with extinction at different wavelengths. In EGO G35.20-0.74, the emission in -band and 4.5 shows a bipolar distribution about the position of the protostar seen at 24 . This implies that the scattering occurs in an outflow cavity (Walther et al., 1990), as in low-mass protostars (e.g., Tobin et al., 2008; Seale & Looney, 2008).
In our 23 EGO sample, only three are consistent with the 4.5 emission coming from the H2 emission, and the rest are likely associated with scattered light from the embedded YSOs or mixture of both. Throughout, we suggest that the 4.5 emission could result from scattered light or/and H2 emission. However, the 4.5 emission itself can not tell which emission mechanism dominates, and we need other wavelength observations (e.g., narrow H2- and -band) to distinguish the contributions of these two emission mechanisms.
5 CONCLUSIONS
We analyzed the data from H2 narrow band, -, and -band observations from UKIRT for 34 EGOs (12 EGOs are preselected and 22 are covered by the UWISH2 survey). Our narrow band H2 observations provide high resolution images () of EGOs, dedicated to shock-excited H2 emission, =1-0 S(1). The H2 images allow us to determine if these EGOs are associated with H2 outflows. We found that 12 EGOs show H2 outflows and four EGOs are H2 outflow candidates. Within this group of 12 EGOs with H2 outflows two objects show a chain of H2 knotty structures, 5 display extended H2 bipolar structures, three have extended H2 lobes, and two have a pair of H2 knots. Most of them appear to be associated with a collimated outflow driven by a single protostar. In contrast, EGO G35.20-0.74 shows an hourglass shape bipolar outflow, and two EGOs (EGO G19.88-0.53 and G35.13-0.74) exhibit multiple outflows.
Of the 12 EGOs with H2 outflows, three EGOs show similar distributions between the 4.5 and H2 emission, implying similar origins. For the remaining of the 9 EGOs with H2 outflows, however, we found that the peaks of the 4.5 emission are rarely associated with the H2 emission. The H2 features are more extended than the continuum features.
In our sample, we found similar morphologies between the -band and 4.5 emission. Seven EGOs also exhibit extended emission in -band. The morphologies of the extended emission gradually changes with wavelength at -band, -band, 3.6, and 4.5 . This can be explained if the emission is associated with scattered continuum, e.g., in the outflow cavity. The different morphologies at different wavelengths may be attributed to extinction.
Appendix A Selected Individual Sources
EGO G10.340.14 (Figure 1). The 24 image is marginally extended in the EGO region, presumably due to the presence of multiple sources. No H2 feature is detected in the continuum-subtracted H2 image. Two negative valued features are seen in the continuum-subtracted H2 image. One is located at the 4.5 peak flux position of the EGO, the other northeast of the EGO. In the -band image, both extended and point sources are seen at the position of the EGO, and coincide with the 24 source.
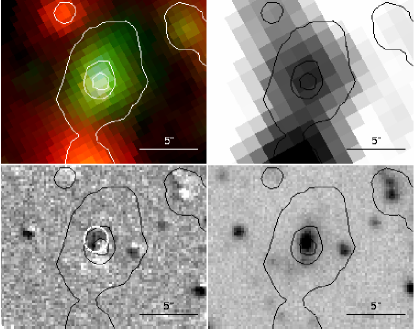
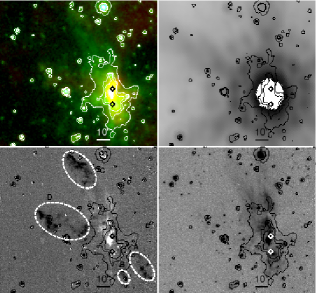
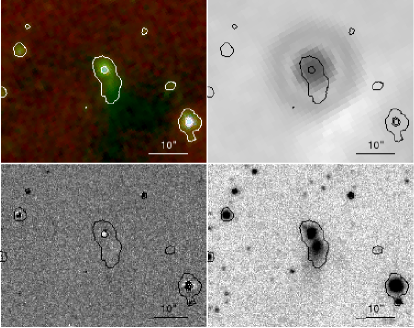
EGO G11.920.61 (Figure 2). A molecular outflow along the NE-SW direction was discovered by Cyganowski et al. (2011). The EGO exhibits two peaks in the NE-SW direction with a separation of in the 4.5 contour map. A bright 24 source is associated with the NE 4.5 peak of the EGO. H2 emission is identified near the SW peak of the EGO, and extends to the SW direction. This flow component is presumably associated with the blue lobe of the molecular outflow discovered by Cyganowski et al. (2011). The distribution of H2 emission differs from that of the -band and 4.5 continuum, while the distributions of the -band and 4.5 continuum match more closely. In the -band image, there are two extended sources at the two peaks of the 4.5 emission.
EGO G12.020.21 (Figure 3). EGO G12.02-0.21 is associated with a 24 source located at the 4.5 peak. There is a faint H2 knot and another possible H2 knot located 3 and 6 north of the 24 source, respectively. The -band image shows a continuum source at the 4.5 peak of the EGO.
EGO G12.200.03 (Figure 4). There are two barely resolved 24 sources with a 5 separation associated with 4.5 peaks in the NW-SE direction. The SE 4.5 peak coincides with an ultra-compact H II region, [WBH2005] G012.199-0.034 (Urquhart et al., 2009). In the continuum-subtracted H2 image, no H2 feature is detected. We identified two continuum sources in -band image at the two peaks of the 4.5 emission, seen as negative valued features in the continuum-subtracted H2 image.
EGO G12.420.50 (Figure 5). EGO G12.42+0.50 is associated with a very bright 24 source which saturates the detector. The 24 source coincides with an H II region, [UHP2009] VLA G012.4180+00.5038 (Urquhart et al., 2009), and is located at the peak of 4.5 emission. There is extended emission in the continuum-subtracted H2 image. This may be due to residuals from the continuum subtraction, rather than true H2 emission. In the -band image, there is an extended -band source at the position of the 24 source. The location of the brightest -band flux coincide in the 4.5 and -band images.
EGO G12.910.03 (Figure 6). EGO G12.91-0.03 is associated with a 24 source at the peak of the 4.5 emission. There is a possible knot in the H2 emission 1 to the north of the peak in the 4.5 emission. The -band image shows an extended continuum source very close to the 4.5 peak and the 24 source.
EGO G16.590.05 (Figure 7). EGO G16.59-0.05 is associated with IRAS 18182-1433, a star-forming region with radio free-free emission (Zapata et al., 2006). Zapata et al. (2006) suggested that this emission is either due to an optically thin H II region or a thermal jet (or stellar wind). EGO G16.59-0.05 is associated with a 24 source coinciding with the peak of the 4.5 emission. The H2 knot in the continuum-subtracted H2 image, the -band source, and the 4.5 source are close to each other, but not exactly coincident.
EGO G16.610.24 (Figure 8). EGO G16.61-0.24 is associated with a 24 source located near the peak of the 4.5 emission. In the continuum-subtracted H2 image, there is a faint H2 lobe to the east; the tip of the H2 outflow may be associated with faint 4.5 emission but the latter detection is not convincing. The spatial distributions of the H2 outflow and bright 4.5 emission in the east side are different, with position angles of 80 and 70, respectively. The continuum-subtracted H2 image shows negative valued features at the peak of the 4.5 emission. There is a -band extended source at the position of the 24 source.
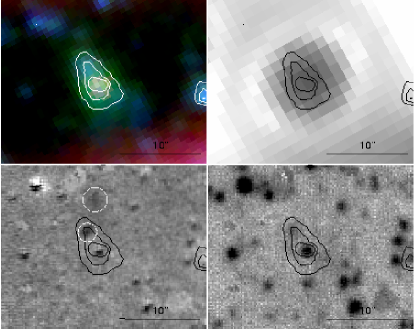
EGO G19.010.03 (Figure 9). EGO G19.01-0.03 is associated with a 24 source at the 4.5 peak. The EGO is elongated in the 4.5 , and there is a group of 44 GHz methanol masers distributed along the EGO (Cyganowski et al., 2009). A molecular outflow discovered by Cyganowski et al. (2011) has a morphology similar to that of the 4.5 emission. We detected two H2 knots near the two lobes of the molecular outflow, and the northern H2 knot coincides with the position of the 44 GHz methanol masers. The symmetric distribution of the two H2 knots with respect to the 24 source suggests a bipolar outflow. The -band extended emission is distributed to the both sides of the outflow. The morphology of the 4.5 emission is similar to that of the -band continuum, but is different from that of the H2 emission.
EGO G19.610.12 (Figure 10). In the 4.5 contour map, there are two peaks, each associated with a 24 source. The southern peak is associated with the EGO identified by Cyganowski et al. (2008). In the continuum-subtracted H2 image, EGO G19.61-0.12 is not associated with any H2 feature. There are two -band sources exhibiting negative valued features in the continuum-subtracted H2 image. One is associated with the EGO (southern 4.5 peak), and the other is located to the S-E direction with a separation.
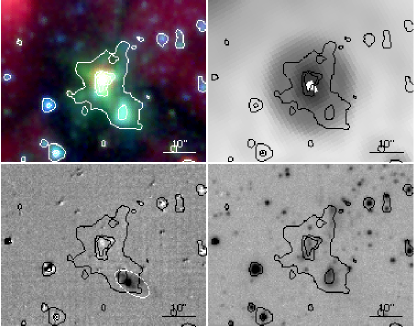
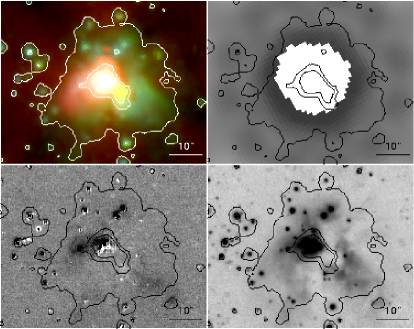
EGO G19.880.53 (Figure 11). EGO G19.88-0.53 is related to the IRAS 18264-1152 star-forming region. The crosses in the GLIMPSE image show positions where De Buizer & Vacca (2010) took spectra in the 3-6 range. These authors show that the 4.5 emission at the black cross (i.e., the position of a massive YSO) is due to continuum, while it is due to H2 emission at the white crosses. A 24 source is at the peak of the 4.5 emission. In our image, EGO G19.88-0.53 shows a clear bipolar H2 outflow with an angular scale of in the E-W direction. H2 knots are also located further out to the northeast and north of the EGO, probably due to multiple outflow sources. These are marked as MHO 2203, 2204, 2205, and 2245 in the figure. All except MHO 2245 have been identified in previous narrow-band H2 observations by Varricatt et al. (2010). The position of the H2 emission close to the driving source matches the diffuse components at 4.5 . The 4.5 and -band emission are not as extended as the H2 emission. The -band image shows a relatively bright extended component at the base of the eastern lobe. There are also some faint extended component in the -band image in the west side of the protostar(s).
EGO G20.240.07 (Figure 12). There are two sources seen in the GLIMPSE image; the central source is associated with the EGO (Cyganowski et al., 2008), while the other source is located at the north east. Both sources show strong 24 emission. No H2 emission is seen in our continuum-subtracted H2 image, however negative valued features due to continuum emission are associated with both 4.5 sources. In the -band image, there is an extended source around the 24 source associated with the EGO.
EGO G28.830.25 (Figure 13). EGO G28.83-0.25 is associated with a 24 source at the peak of the 4.5 emission. No H2 emission is seen in the continuum-subtracted H2 image, however negative valued features due to continuum emission are seen, with a morphology similar to the 4.5 emission. Diffuse -band emission is observed at the peak of the EGO and a faint feature east.
EGO G35.040.47 (Figure 14). EGO G35.04-0.47 has a 24 source at the peak of the 4.5 emission. Its GLIMPSE image shows that it is extended along an N-S axis. However, our continuum-subtracted H2 image shows an H2 outflow along NE-SW axis which is not detected in the 4.5 image. The SW lobe of the H2 outflow is much brighter than the NE one which can be explain if the NE lobe is obscured by the IRDC. The morphology of the H2 emission is more extended than that of the 4.5 emission. A faint -band source is observed at the 4.5 peak (and the 24 source).
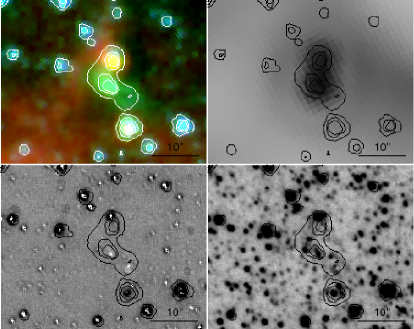
EGO G35.130.74 (Figure 15). EGO G35.13-0.74 is likely associated with the embedded cluster [MCM2005b] 14 (Mercer 14, Mercer et al., 2005). There is a 24 source close to the EGO, but it is not located at the peak of the 4.5 emission. The continuum-subtracted H2 image shows a well collimated H2 outflow around the EGO in the NW-SE direction, and also a number of H2 knots surrounding it. The 4.5 image shows a few possible faint counterparts for these H2 knots. In contrast, the 4.5 and -band images only show extended emission, with similar morphologies. For further information regarding H2 knots (MHO 2423-2428) and their possible driving sources, see Froebrich & Ioannidis (2011) in detail.
EGO G35.150.80 (Figure 16). EGO G35.15+0.80 is associated with a 24 source at the 4.5 peak. The EGO is at the center of the image and is extended in the NE-SW direction. In the H2 image, EGO G35.15+0.80 shows a set of aligned H2 knots in the NW-SE direction, different from the orientation of the 4.5 emission. The 4.5 image shows a few possible faint counterparts to these H2 knots. The -band extended emission is located 10 SE of the 24 source. The morphology of 4.5 emission resembles that of -band continuum emission, except there is no -band point source at the position of the 24 source (Figure 17).
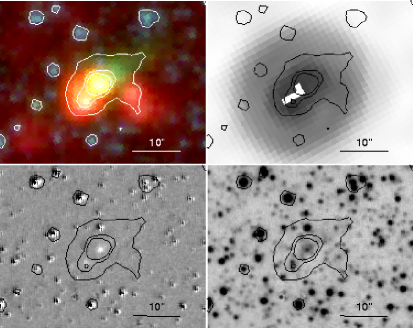
EGO G35.200.74 (Figure 18). EGO G35.20-0.74 is also known as G35.2N. Dent et al. (1984) reported that there are two compact H II regions, located near the saturated 24 source. In the figure, the lowest contour around the EGO roughly represents its shape. Our continuum-subtracted H2 image shows an hourglass outflow with a wide opening angle () in the NE-SW direction. In contrast to the extended H2 emission, the 4.5 and -band continuum emission are brighter at the base of the outflow and are similar in morphology. The tips of the H2 outflow are associated with 4.5 emission, but the 4.5 emission at the tips is much fainter than that near the base. The peak of the -band extended emission coincides with the 24 source.
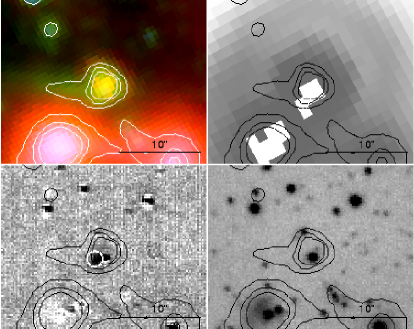
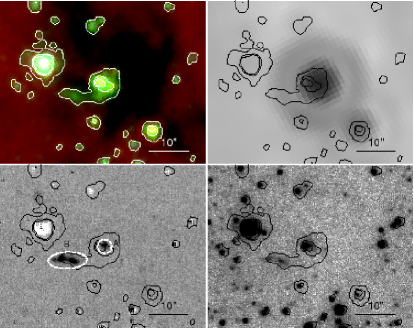
EGO G35.680.18 (Figure 19). A 24 source is located near the 4.5 peak of EGO G35.68-0.18. The continuum-subtracted H2 image shows two emission components: one close to the 4.5 peak (“A” in the figure), the other extending toward the east (“B”). The position of “A” is offset from the 4.5 peak by 2. The position of “B” approximately matches a diffuse component in the 4.5 image. The -band image shows emission similar to the H2, but the peak position of the component close to “A” matches the 4.5 peak. This component is much brighter than “B” at 4.5 and -band, while “A” and “B” are of similar brightness in H2 emission.
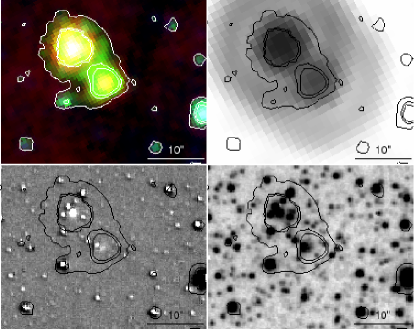
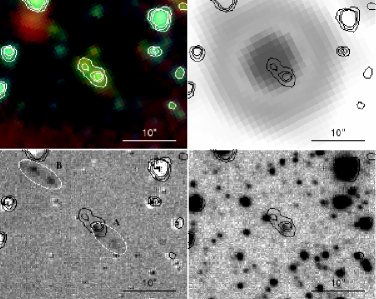
EGO G35.790.17 (Figure 20). In the 4.5 contour map of EGO G35.79-0.17, there are two peaks with a separation of 3. The NE peak is associated with a 24 source. The continuum-subtracted H2 image exhibits an H2 outflow in the NE-SW direction with the NE lobe brighter than the SW one. In contrast to the more extended H2 emission, the GLIMPSE image only shows bright emission close to the 24 source. The -band continuum image shows an extended source at the position of the SW 4.5 peak which does not coincide with the position of the 24 source.
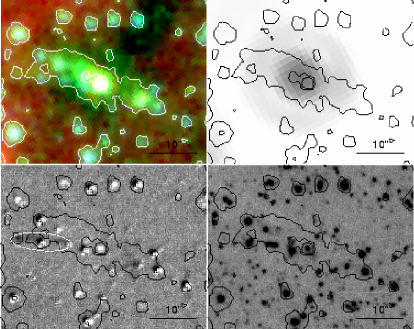
EGO G35.830.20 (Figure 21). There are several faint 24 sources around EGO G35.83-0.20, but it is not clear which one is physically related to the EGO. The continuum-subtracted H2 image shows a chain of a few H2 knots (MHO 2434A-C) in the NE-SW direction. One of the H2 knot (MHO 2434B) coincides with the EGO. These H2 knots are also seen in the image, however, the image contains a significantly larger number of emission features not seen in the continuum-subtracted H2 image. This makes the presence of the outflow ambiguous in the image. In the -band image, there is diffuse emission associated with the EGO.
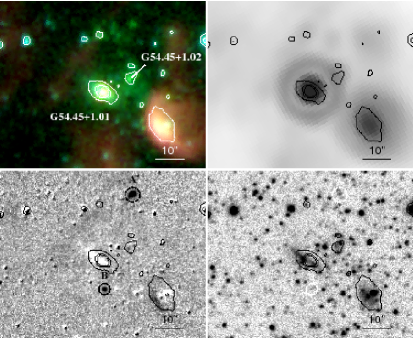
EGO G54.451.01 and G54.45+1.02 (Figure 22). A 24 source is associated with G54.45+1.01. There are two H2 knots near the EGO to the north west and south east located and away from the 24 source, respectively. The alignment of these knots, and the lack of other nearby 24 sources, implies that they are associated with EGO G54.45+1.01. A -band continuum extended source is related to the EGO. The orientation of the -band extended source resembles that of the 4.5 emission. For G54.45+1.02, an extended -band source is associated with the 4.5 emission; however no 24 source is seen.
EGO G58.090.34 (Figure 23). EGO G58.09-0.34 is associated with a 24 source which coincides with the peak of the 4.5 emission. The continuum-subtracted H2 image does not show any H2 features, but does show continuum emission with negative valued feature at the 4.5 peak. In the -band image, there are two extended sources with a separation of 3 to the north and south. The northern source is located on the 4.5 peak. In the continuum-subtracted H2 image, the northern source shows negative valued feature, but the southern one does not.
References
- Arce et al. (2007) Arce, H. G., Shepherd, D., Gueth, F., Lee, C.-F., Bachiller, R., Rosen, A., & Beuther, H. 2007, Protostars and Planets V, 245
- Bally et al. (2007) Bally, J., Reipurth, B., & Davis, C. J. 2007, Protostars and Planets V, 215
- Benjamin et al. (2003) Benjamin, R. A., Churchwell, E., Babler, B. L., et al. 2003, PASP, 115, 953
- Beuther & Shepherd (2005) Beuther, H., & Shepherd, D. 2005, Cores to Clusters: Star Formation with Next Generation Telescopes, 105
- Birks et al. (2006) Birks, J. R., Fuller, G. A., & Gibb, A. G. 2006, A&A, 458, 181
- Carey et al. (2009) Carey, S. J., et al. 2009, PASP, 121, 76
- Chambers et al. (2009) Chambers, E. T., Jackson, J. M., Rathborne, J. M., & Simon, R. 2009, ApJS, 181, 360
- Chen et al. (2010) Chen, X., Shen, Z.-Q., Li, J.-J., Xu, Y., & He, J.-H. 2010, ApJ, 710, 150
- Chen et al. (2009) Chen, X., Ellingsen, S. P., & Shen, Z.-Q. 2009, MNRAS, 396, 1603
- Churchwell et al. (2009) Churchwell, E., et al. 2009, PASP, 121, 213
- Churchwell et al. (2006) Churchwell, E., Povich, M. S., Allen, D., et al. 2006, ApJ, 649, 759
- Connelley et al. (2007) Connelley, M. S., Reipurth, B., & Tokunaga, A. T. 2007, AJ, 133, 1528
- Cyganowski et al. (2011) Cyganowski, C. J., Brogan, C. L., Hunter, T. R., Churchwell, E., & Zhang, Q. 2011, ApJ, 729, 124
- Cyganowski et al. (2009) Cyganowski, C. J., Brogan, C. L., Hunter, T. R., & Churchwell, E. 2009, ApJ, 702, 1615
- Cyganowski et al. (2008) Cyganowski, C. J., et al. 2008, AJ, 136, 2391
- Cyganowski et al. (2007) Cyganowski, C. J., Brogan, C. L., & Hunter, T. R. 2007, AJ, 134, 346
- Davis et al. (2010) Davis, C. J., Gell, R., Khanzadyan, T., Smith, M. D., & Jenness, T. 2010, A&A, 511, A24
- Davis et al. (2009) Davis, C. J., et al. 2009, A&A, 496, 153
- Davis et al. (2007) Davis, C. J., Kumar, M. S. N., Sandell, G., Froebrich, D., Smith, M. D., & Currie, M. J. 2007, MNRAS, 374, 29
- Davis & Smith (1996) Davis, C. J., & Smith, M. D. 1996, A&A, 310, 961
- De Buizer & Vacca (2010) De Buizer, J. M., & Vacca, W. D. 2010, AJ, 140, 196
- Dent et al. (1984) Dent, W. R. F., Little, L. T., & White, G. J. 1984, MNRAS, 210, 173
- de Zeeuw et al. (1999) de Zeeuw, P. T., Hoogerwerf, R., de Bruijne, J. H. J., Brown, A. G. A., & Blaauw, A. 1999, AJ, 117, 354
- Dye et al. (2006) Dye, S., et al. 2006, MNRAS, 372, 1227
- Everett et al. (1995) Everett, M. E., Depoy, D. L., & Pogge, R. W. 1995, AJ, 110, 1295
- Froebrich et al. (2011) Froebrich, D., et al. 2011, MNRAS, 413, 480
- Froebrich & Ioannidis (2011) Froebrich, D., & Ioannidis, G. 2011, MNRAS, 418, 1375
- Gibb et al. (2004) Gibb, E. L., Whittet, D. C. B., Boogert, A. C. A., & Tielens, A. G. G. M. 2004, ApJS, 151, 35
- Gredel (1994) Gredel, R. 1994, A&A, 292, 580
- Hodapp (1994) Hodapp, K.-W. 1994, ApJS, 94, 615
- Kaifu et al. (2000) Kaifu, N., Usuda, T., Hayashi, S. S., et al. 2000, PASJ, 52, 1
- Karr et al. (2009) Karr, J. L., Manoj, P., & Ohashi, N. 2009, ApJ, 697, 133
- Lawrence et al. (2007) Lawrence, A., et al. 2007, MNRAS, 379, 1599
- Lee & Chen (2007) Lee, H.-T., & Chen, W. P. 2007, ApJ, 657, 884
- Lee et al. (2005) Lee, H.-T., Chen, W. P., Zhang, Z.-W., & Hu, J.-Y. 2005, ApJ, 624, 808
- Lucas et al. (2008) Lucas, P. W., et al. 2008, MNRAS, 391, 136
- Mercer et al. (2005) Mercer, E. P., et al. 2005, ApJ, 635, 560
- Minier et al. (2003) Minier, V., Ellingsen, S. P., Norris, R. P., & Booth, R. S. 2003, A&A, 403, 1095
- Reach et al. (2006) Reach, W. T., et al. 2006, AJ, 131, 1479
- Robitaille et al. (2007) Robitaille, T. P., Whitney, B. A., Indebetouw, R., & Wood, K. 2007, ApJS, 169, 328
- Robitaille et al. (2006) Robitaille, T. P., Whitney, B. A., Indebetouw, R., Wood, K., & Denzmore, P. 2006, ApJS, 167, 256
- Rosolowsky et al. (2010) Rosolowsky, E., et al. 2010, ApJS, 188, 123
- Seale & Looney (2008) Seale, J. P., & Looney, L. W. 2008, ApJ, 675, 427
- Shepherd et al. (2007) Shepherd, D. S., et al. 2007, ApJ, 669, 464
- Simpson et al. (2009) Simpson, J. P., Burton, M. G., Colgan, S. W. J., Cotera, A. S., Erickson, E. F., Hines, D. C., & Whitney, B. A. 2009, ApJ, 700, 1488
- Simpson et al. (2012) Simpson, J. P., Cotera, A. S., Burton, M. G., et al. 2012, MNRAS, 419, 211
- Smith et al. (2006) Smith, H. A., Hora, J. L., Marengo, M., & Pipher, J. L. 2006, ApJ, 645, 1264
- Stecklum et al. (2009) Stecklum, B., Caratti O Garatti, A., Davis, C., Linz, H., Stanke, T., & Zinnecker, H. 2009, Protostellar Jets in Context, 619
- Takami et al. (2010) Takami, M., Karr, J. L., Koh, H., Chen, H.-H., & Lee, H.-T. 2010, ApJ, 720, 155
- Tobin et al. (2008) Tobin, J. J., Hartmann, L., Calvet, N., & D’Alessio, P. 2008, ApJ, 679, 1364
- Urquhart et al. (2009) Urquhart, J. S., et al. 2009, A&A, 501, 539
- Varricatt (2011) Varricatt, W. P. 2011, A&A, 527, A97
- Varricatt et al. (2010) Varricatt, W. P., Davis, C. J., Ramsay, S., & Todd, S. P. 2010, MNRAS, 404, 661
- Voronkov et al. (2010) Voronkov, M. A., Caswell, J. L., Ellingsen, S. P., & Sobolev, A. M. 2010, MNRAS, 405, 2471
- Voronkov et al. (2006) Voronkov, M. A., Brooks, K. J., Sobolev, A. M., et al. 2006, MNRAS, 373, 411
- Walther et al. (1990) Walther, D. M., Aspin, C., & McLean, I. S. 1990, ApJ, 356, 544
- Watson et al. (2008) Watson, C., Povich, M. S., Churchwell, E. B., et al. 2008, ApJ, 681, 1341
- Zapata et al. (2006) Zapata, L. A., Rodríguez, L. F., Ho, P. T. P., Beuther, H., & Zhang, Q. 2006, AJ, 131, 939
- Zhang & Wang (2009) Zhang, M., & Wang, H. 2009, AJ, 138, 1830
- Zinnecker & Yorke (2007) Zinnecker, H., & Yorke, H. W. 2007, ARA&A, 45, 481

| Detection | |||||
|---|---|---|---|---|---|
| EGO | D. | H2 | -band | -band | Note |
| (kpc) | (Y/N) | (Y/N) | (Y/N) | ||
| G10.29-0.13 | 2.2 | N | Y | N | |
| G10.34-0.14 | 2.0 | N | Y | N | continuum emission near the EGO |
| G11.92-0.61 | 3.9 | Y | Y | Y | an H2 outflow lobe |
| G12.02-0.21 | 17.0 | Y? | N | N | an H2 knot located at the north of the EGO |
| G12.20-0.03 | 4.6 | N | Y | N | continuum emission near the EGO |
| G12.42+0.50 | 2.4 | Y? | Y | Y | extended H2 emission, HII [UHP2009] G012.4180+00.5038 |
| G12.68-0.18 | – | N | N | N | |
| G12.91-0.03a | 4.7 | Y? | Y | N | a faint H2 knot |
| G14.63-0.58a | 2.2 | N | N | N | |
| G16.58-0.08 | 3.6 | N | N | N | |
| G16.59-0.05 | 4.4 | Y? | N | N | an H2 knot |
| G16.61-0.24a | – | Y | Y | N | a faint H2 outflow lobe |
| G18.67+0.03 | 5.0 | N | Y | N | |
| G18.89-0.47a | 4.5 | N | N | N | |
| G19.01-0.03a | 4.3 | Y | Y | N | an H2 outflow with two H2 knots |
| G19.61-0.12 | 4.1 | N | Y | N | continuum emission near the EGO |
| G19.61-0.14 | – | N | Y | N | |
| G19.88-0.53a | 3.4 | Y | Y | Y | a bipolar H2 outflow, IRAS 18264-1152 |
| G20.24+0.07 | 4.6 | N | Y | N | continuum emission near the EGO |
| G28.83-0.25 | 5.1 | N | Y | Y | continuum emission near the EGO |
| G28.85-0.23 | – | N | N | N | |
| G35.04-0.47 | 3.4 | Y | N | N | a bipolar H2 outflow |
| G35.13-0.74a | 2.4 | Y | Y | Y | a bipolar H2 outflow |
| G35.15+0.80a | 4.7 | Y | Y | N | a set of aligned H2knots |
| G35.20-0.74a | 2.4 | Y | Y | – | G35.2-0.74N, an hourglass shape bipolar H2 outflow |
| G35.68-0.18a | 2.1 | Y | Y | Y | an H2 outflow lobe |
| G35.79-0.17 | – | Y | Y | N | a bipolar H2 outflow |
| G35.83-0.20 | 2.1 | Y | Y | N | a set of aligned H2 knots |
| G36.01-0.20 | 5.9 | N | N | N | |
| G54.11-0.04 | 4.9 | N | N | N | |
| G54.11-0.05 | – | N | N | N | |
| G54.45+1.01 | 3.7 | Y | Y | N | an H2 outflow with two H2 knots |
| G54.45+1.02a | – | N | Y | N | |
| G58.09-0.34a | – | N | Y | Y | continuum emission near the EGO |
| MHO number | RA (J2000) | DEC (J2000) | Note |
|---|---|---|---|
| 2303 | 18 13 57.5 | -18 54 29 | an H2 outflow lobe from EGO G11.92-0.61 |
| 2243 | 18 21 53.6 | -14 35 50 | an H2 outflow lobe from EGO G16.61-0.24 |
| 2244 | 18 25 44.8 | -12 22 46 | a pair of H2 knots near EGO G19.01-0.03 |
| 2245 | 18 29 14.8 | -11 50 08 | a faint H2 knot near EGO G19.88-0.53 |
| 2429 | 18 56 58.1 | +01 39 37 | a bipolar outflow from EGO G35.04-0.47 |
| 2430 | 18 52 36.6 | +02 20 26 | a chain of H2 knots from EGO G35.15+0.80 |
| 2431 | 18 58 12.9 | +01 40 33 | an hourglass H2 outflow from EGO G35.20-0.74 |
| 2432 | 18 57 05.0 | +02 22 00 | an H2 outflow lobe from EGO G35.68-0.18 |
| 2433 | 18 57 16.7 | +02 27 56 | a bipolar outflow from EGO G35.79-0.17 |
| 2434 | 18 57 26.9 | +02 29 00 | a chain of H2 knots from EGO G35.83-0.20 |
| 2622 | 19 28 26.4 | +19 32 15 | two H2 knots near EGO G54.45+1.01 |