High Resolution Images of Orbital Motion in the Orion Trapezium Cluster with the LBT AO System1111The LBT is an international collaboration among institutions in the United States, Italy and Germany. LBT Corporation partners are: The University of Arizona on behalf of the Arizona university system; Istituto Nazionale di Astrofisica, Italy; LBT Beteiligungsgesellschaft, Germany, representing the Max-Planck Society, the Astrophysical Institute Potsdam, and Heidelberg University; The Ohio State University, and The Research Corporation, on behalf of The University of Notre Dame, University of Minnesota and University of Virginia.
Abstract
The new 8.4m LBT adaptive secondary AO system, with its novel pyramid wavefront sensor, was used to produce very high Strehl ( at 2.16) near infrared narrowband (: 2.16 and [FeII]: 1.64) images of 47 young ( Myr) Orion Trapezium Ori cluster members. The inner of the cluster was imaged at spatial resolutions of (at 1.64). A combination of high spatial resolution and high S/N yielded relative binary positions to mas accuracies. Including previous speckle data, we analyze a 15 year baseline of high-resolution observations of this cluster. We are now sensitive to relative proper motions of just mas/yr (0.6 km/s at 450 pc) this is a improvement in orbital velocity accuracy compared to previous efforts. We now detect clear orbital motions in the Ori system of km/s and km/s in the Ori system (with correlations of PA vs. time at confidence). All five members of the Ori system appear likely as a gravitationally bound “mini-cluster”. The very lowest mass member of the Ori system (; mass ) has, for the first time, a clearly detected motion (at km/s; correlation=99.7%) w.r.t . However, is most likely in an long-term unstable (non-hierarchical) orbit and may “soon” be ejected from this “mini-cluster”. This “ejection” process could play a major role in the formation of low mass stars and brown dwarfs.
graphicsx
1 INTRODUCTION
The detailed formation of stars is still a poorly understood process. In particular, the formation mechanism of the lowest mass stars and brown dwarfs is uncertain. Detailed 3D (and N-body) simulations of star formation by Bate et al. (2002, 2003, 2009, 2011) and Parker et al. (2011) all suggest that stellar embryos frequently form into “mini-clusters” which dynamically decay, “ejecting” the lowest mass members. Such theories can explain why there are far more field brown dwarfs (BD) compared to BD companions of solar type stars (McCarthy & Zuckerman, 2004) or early M stars (Hinz et al., 2002). Moreover, these theories which invoke some sort of dynamical decay (Durisen, Sterzik, & Pickett, 2001) or ejection (Reipurth & Clarke, 2001) suggest that there should be no wide ( AU) very low mass (VLM; ) binary systems observed in the field (age Gyr). Indeed, the AO surveys of Close et al. (2003a) and the HST surveys of Reid et al. (2001a); Burgasser et al. (2003); Bouy et al. (2003); Gizis et al. (2003) have not discovered more then a few wide ( AU) VLM systems of the systems in the field population (for a review see Burgasser et al. (2007)). Additionally, the dynamical biasing towards the ejection of the lowest mass members naturally suggests that the frequency of field VLM binaries should be much lower ( for ) than for more massive binaries ( for ). Indeed, observations suggest that the binarity of VLM systems with is (Close et al., 2003a; Burgasser et al., 2003, 2007) which, although higher than predicted is still lower than that of the of G star binaries Duquennoy & Mayor (1991). However has is noted in Close et al. (2007) there is evidence that in young clusters wide VLM binaries are much more common than in the old field population. They attribute this to observing these wide VLM systems before they are destroyed by encounters in their natal clusters. Hence, we need to look at nearby young clusters to see these low-mass objects before ejection has occurred.
Despite the success of these decay or ejection scenarios in predicting the observed properties of low mass VLM stars and binaries , it is still not clear that “mini-clusters” even exist in the early stages of star formation. To better understand whether such “mini-clusters” do exist we have examined the closest major OB star formation cluster for signs of such “mini-clusters”. Here we focus on the Ori stars in the famous Orion Trapezium cluster. Trying to determine if some of the tight star groups in the Trapezium cluster are gravitationally bound is a first step to determining if bound “mini-clusters” exist. Also it is important to understand the true number of real, physical, binaries in this cluster, as there is evidence that the overall number of binaries is lower (at least for the lower mass members) in the dense trapezium cluster compared to the lower density young associations like Taurus-Auriga (McCaughrean, 2000; Kohler et al., 2006). In particular, we will examine the case of the Ori A and B groups in detail.
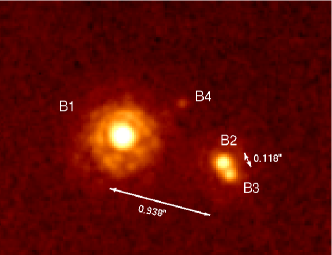
The Trapezium OB stars ( Ori A, B, C, D, and E) consists of the most massive OB stars located at the center of the Orion Nebula star formation cluster (for a review see Genzel & Stutzki (1989)). Due to the nearby and luminous nature of these stars they have been the target of several high-resolution imaging studies. Utilizing only tip-tilt compensation McCaughrean & Stauffer (1994) mapped the region at from the 3.5-m Calar Alto telescope. They noted that Ori B was really composed of 2 components ( & ) about apart. Higher resolutions were obtained from the same telescope by Petr et al. (1998) with speckle holographic observations. At these higher resolutions Petr et al. (1998) discovered that Ori was really itself a system ( & ) and that Ori A was really a binary ( & ). A large AO survey of the inner 6 square arcminutes was carried out by Simon, Close, & Beck (1999), who discovered a very faint (100 times fainter than ) object () located just between and . Moreover, a spectroscopic survey (Abt, Wang, & Cardona, 1991) showed that was really an eclipsing spectroscopic binary ( & ; sep. 0.13 AU; period 6.47 days). As well, Ori was also found to be a spectroscopic binary ( & ; sep. 1 AU; Bossi et al. (1989) ). Weigelt et al. (1999) carried out bispectrum speckle interferometric observations at the larger Russian SAO 6-m telescope (2 runs in 1997 and 1998). These observations showed Ori C was a very tight 0.033 binary. These observations also provided the first set of accurate relative positions for these stars. Schertl et al. (2003) has continued to monitor this cluster of stars and detected an orbital motion (of for Ori around and a of for Ori around over a 5.5 yr baseline).
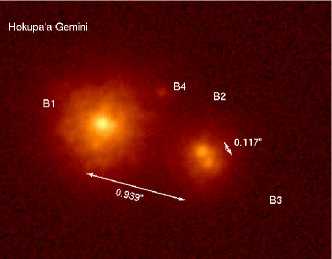
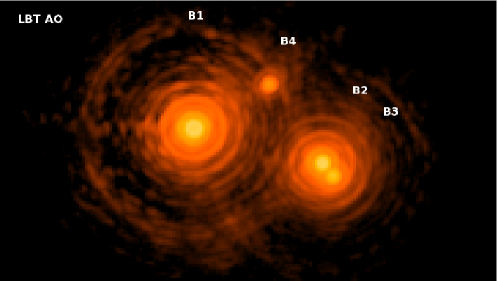
Close et al. (2003c) utilized the Gemini telescope (with the Hokupa’a AO system) and then observed Ori B during commissioning of the first adaptive secondary deformable mirror at the 6.5-m MMT telescope. This extended the baseline by 2 years. Now during the science verification of the world’s first “next generation” adaptive secondary mirror with the LBT AO System the full Trapezium cluster was observed again with excellent performance (K Strehl ). Now we have over 14 years of observations of this field with at resolutions.
In this paper we outline how these LBT observations were carried out with the relatively new PISCES camera and LBT AO system (FLAO). We detail how these data were calibrated and reduced and how the stellar positions were measured. We fit the observed positions to calculate velocities (or upper limits) for the Ori B & A stars. While Schertl et al. (2003) and Close et al. (2003c) had hints that the Ori B group may be a bound “mini-cluster” —we show it is clearly so, with the first detection of orbital motion of the lowest mass member.
2 INSTRUMENTAL SET-UP
We utilized the LBT adaptive secondary AO system to obtain the most recent highest-resolution (unsaturated) images of the young stars in the Trapezium cluster (the Ori group). This is not a simple task, since as telescopes have increased in size and (with AO) Strehl, so now the bright stars tend to saturate –in even the shortest exposures. Hence, special precautions are needed to avoid saturation of the bright Trapezium stars themselves. It is now almost impossible to make unsaturated, but diffraction-limited, images of the bright Trapezium stars with modern 8m class AO systems at high Strehl. Witness the fact that this is the first such dataset published in 9 years. Hence this dataset is unusually important. The next subsections outline how this was accomplished.
2.1 The LBT AO System
The 8.4m LBT telescope has a unique “first light adaptive optics” (FLAO) system. To reduce the aberrations caused by atmospheric turbulence all AO systems have a deformable mirror which is updated in shape at Hz. Except for the MMTAO system (Wildi et al., 2003a; Hinz et al., 2010), all adaptive optics systems have located this deformable mirror (DM) at a re-imaged pupil (effectively a compressed image of the primary mirror). To reimage the pupil onto a DM typically requires 6-8 warm additional optical surfaces, which significantly increases the thermal background and decreases the optical throughput of the system (Lloyd-Hart, 2000). However, the LBT utilizes a next generation adaptive secondary DM. This DM is both the secondary mirror of the telescope and the DM of the AO system (like with MMTAO). In this manner there are no additional optics required in front of the science camera. Hence the emissivity is lower. The LBT’s DM is a much more advanced “second generation” adaptive secondary mirror (ASM), which enables the highest on-sky Strehl ( at H band) of any 8-10m telescope today (Esposito et al., 2011).
The LBT ASM consists of 672 voice coil actuators that push (or pull) on 672 small magnets glued to the backsurface of a thin (1.6 mm), 0.911 m aspheric ellipsoidal Zerodur glass “shell” (for a detailed review of the secondary mirror see Esposito et al. (2010a, 2011)). We have complete positional control of the surface of this reflective shell by use of a 70kHz capacitive sensor feedback loop. This positional feedback loop allows one to position an actuator of the shell to within nm rms (total wavefront surface errors amount to only nm rms over the whole secondary). The AO system samples (and drives the ASM) at 990 Hz using 400 active controlled modes (with 672 actuators) on bright stars (R¡8 mag).
The wavefront slopes are measured with the very accurate (and well calibrated, with low aliasing error) Pyramid Wavefront sensor (PWFS). This is the first large telescope to use a PWFS. The performance of the FLAO PWFS is excellent. The uniquely low residual wavefront errors obtained by the PWFS + ASM combination is due, in part, to the very accurate (high S/N) interaction matrix that can be obtained in closed-loop daytime calibrations with a retro-reflecting optic that takes advantage of the Gregorian (concave) nature of the secondary. To guarantee strict “on-sky” compliance with the “daytime calibrated” interaction matrix pupil/ASM/PWFS geometry the PWFS utilizes a novel “closed-loop pupil alignment system” that maintains the pupil alignment to during all closed-loop operations on bright stars (like our Trapezium guide stars). For a detailed review of the LBT FLAO AO system see Esposito et al. (2011) and references within.
2.2 The LBT AO Observations
During LBT science verification (the last AO commissioning run of the first LBT ASM) we observed the Ori B and C fields on the night of Oct 16, 2011 (UT). The AO system corrected the lowest 400 system modes and was updated at 990 Hz. Without AO correction our images had FWHM= at [FeII], after AO correction our final 10 min image achieved FWHM= (close to the diffraction limit of at [FeII] (1.644 )).
2.3 The PISCES NIR Camera
These observations utilized the first light AO science camera, PISCES, which has been modified for the LBT AO system. PISCES has a 1024x1024 1-2.5 HAWAII array. Here we used the narrowband (2.16 ) and [FeII] (1.644 ) filters to minimize saturation on the array. We also utilized a warm 25 mm dia. neutral density filter (ND2: with 1% transmission) which was custom mounted by flexible adhesive strips on the PISCES dewar within a few mm of the f/15 focal plane of the ASM. Since the high quality flat ND2 was nearly in the warm first focal plane (in front of the PISCES dewar window) it cannot significantly alter, or distort, the platescale or optical quality of PISCES.
The PISCES focal plane platescales were calibrated by the astrometry of seven single (relatively faint) stars 222Typically the stars in the Trapezium used for this platescale test move at only /yr so the platescale error over a distance is error — which is much smaller than the rms fitting platescale errors of . from from Ori C (see sections 3 and 4 for more details about how the images were first distortion corrected and combined etc.). We note here that we only used the data where Ori C was the guide star for the platescale calibration. The 3 dither frames that used this guide star were all taken within 20 min of each other, and so the PA angle is assumed to be fixed for all exposures.
The positions (found by IRAF allstar PSF fitting) of these seven stars from our LBT AO images were compared to unsaturated HST ACS WCS astrometry from the publicly available archived data of Ricci et al. (2007). Platescales and rms errors were then determined for the and [FeII] filters with the IRAF geomap task. The geomap task found /pix platescale (providing a FOV). At [FeII] the platescale was slightly finer at /pix. For PISCES it is well known that, due to a slight focus change, the bluer wavelengths have a slightly finer platescale.
The steps used to align the Y axis of the PISCES images (which were all taken with the rotator following) it was first necessary to flip the image about the X axis. Then each image was rotated (with the IRAF rotate task) by the fixed PA+90 of the rotator (POSANGLE FITS keyword value +90 degrees). All 3 rotated images were then combined. At this point it was found by geomap in the image that the direction of North was slightly () East of PISCES’s Y axis compared to the HST image. Hence a final rotation of was applied to the final image. At [FeII] this additional rotation was a very similar value. The rms uncertainty adopted for the LBT rotator angle is estimated as which dominates the small error between the two geomap solutions. We conclude that most of the is due to systematic errors in the distortion corrections.
The camera was mounted under a high optical quality dichroic which sent the visible light (0.5-1 ) to the 30x30 subaperture Pyramid wavefront sensor (PWFS; Esposito et al. (2010b)). The PWFS communicates with the the ASM mirror (which has 672 actuators, but where not operational on this run, with no real loss in performance). The infrared light () was transmitted through the dichroic to PISCES.
3 OBSERVATIONS & REDUCTIONS
For the Ori C field we locked the AO system (at 990Hz, 400 modes) on the bright O5pv star Ori C (V=5.13 mag) and dithered over 3 positions on the PISCES array with a short set of 10x0.8 second unsaturated exposures (save C1 which at H=4.48 saturated even in [FeII] with the ND2). Immediately following the unsaturated exposures a set of 10x20 second exposures were obtained at each dither position. This whole procedure was repeated with in with slightly different dithers. Hence for a few sources on the edges of the frames there is only photometry in one filter. However, when reduced both filter images covered an area of centered on Ori C. We note that Ori C is really a binary composed of C1 and C2, (see Kraus et al. (2007) for more details). Due to the very red nature of the Trapezium sources we only needed half the number of images at compared to [FeII]. Hence we obtained 3x5x0.8 second unsaturated exposures and 3x5x20 second deeper exposures at .
Then the AO system was locked on the nearby star Ori B1 (V=7.96 mag) and was dithered over a similar sized area to produce a set of 3x10x0.8 s unsaturated images [FeII] images followed by 3x10x20 s deeper images at [FeII]. Again half that data was obtained at (3x5x0.8 s and 3x5x20 s). The final image in the Ori B field spanned centered on Ori B1.
Before the images were combined each image was first corrected with PISCES appropriate values for the corquad “overshoot” program 333http://aries.as.arizona.edu/observer/dot.corquad.pisces. Then they were distortion “pincushion” corrected with the cubic distortion solution for PISCES from a pinhole array mask444http://wiki.lbto.arizona.edu/twiki/pub/AdaptiveOptics/PiscesDistorsion/pisces.cubic and the IRAF drizzle task. At this point the individual frames could be reduced in a normal manner. We used our custom AO image reduction script of Close et al. (2003a) to flat field, sky subtract, cross-correlate, and median combine each image. The final deep images of the C and B fields had a total exposure time of 10 min in the overlap region in the [FeII] images and 5 min in the images. The unsaturated images had total exposure times of 24 s and 12 s in [FeII] and respectively. Each of these reduced images were then flipped in X, rotated by POSANGLE+90 degrees, and corrected by -0.9 degrees –as described above to match the HST ACS astrometry with geomap to that of Ricci et al. (2007). Hence North is up and East is to the left in each of the final images.
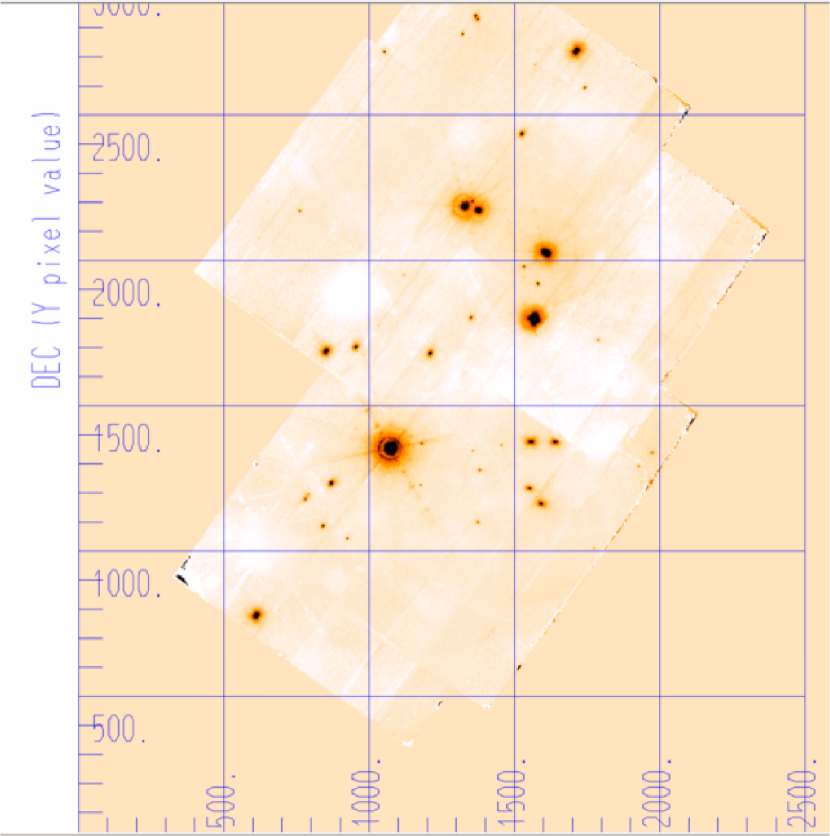
While all astrometry and photometry was performed on these individual fields (on unsaturated images), the last step was combining these two C and B fields into a single large image of the entire Trapezium. The final images (see Figs. 1 and 2) have a size of . This image is the largest AO image obtained by the LBT to date.
4 ASTROMETRY & PHOTOMETRY
All eight reduced images (the C and B fields at both [FeII] and at both long and short exposures) were analyzed with the DAOPHOT PSF fitting task allstar (Stetson, 1987). The photometry and astrometry are summarized in Table 1. The columns of Table 1 are self explanatory. We note that the zeropoints for the [FeII] and photometry were arbitrary as these are narrow band filters. However, it is clear that the magnitudes at [FeII] seem to closely track the true magnitudes, since these sources are mainly continuum at . However, these sources are all accreting and have excess emission at . Hence, the [FeII]- color given in the last column of Table 1 is largest for objects that have very active accretion and/or a high level of circumstellar absorption.
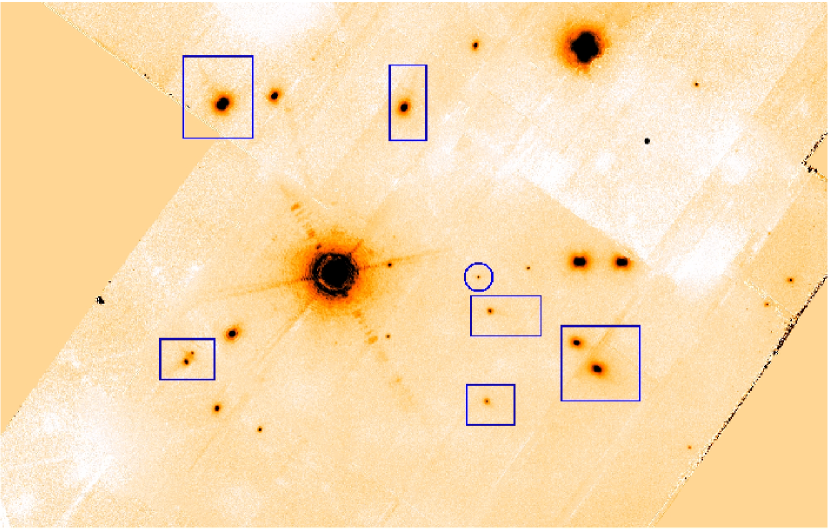
Note in the the deep image, well known “tails” of emission point away from Ori C, and are highlighted by blue rectangles in Fig. 3 and in the comments column of Table 1. Also each tight binary is called out in the table as well as each member of the bright Trapezium stars themselves. All the tight () binaries have additional details in Table 3.
We minimized the small anisoplanatic PSF radial fitting errors in table 1 by using a spatially variable PSF in the DAOPHOT psf task. The most heavily weighted PSF star used was unsaturated Ori itself. Since all the members of the Ori group are located within of Ori the PSF fit is particularly excellent there (there is no detectable change in PSF morphology due to anisoplanatic effects inside the Ori B group (Diolaiti et al., 2000)). Moreover, the residuals over the whole field were less than a few % after PSF subtraction. This is not really surprising given the quality of the night combined with the fact that no star was further than from the guide star. However, to minimize this affect, we only used the longer wavelength astrometry in Table 1 where anisoplanatic PSF effects were much less significant.
The relative positional accuracy is an excellent mas for the bright binaries that are tighter than , but the absolute RA and DEC positions given in Table 1 are typically only good to due to the uncertainty in the platescale for this new instrument.
We can also compare our LBT data to older (somewhat less accurate) images of the Trapezium B stars from Close et al. (2003c) who used AO images from Gemini and the 6.5m MMT and speckle images from the literature (Schertl et al., 2003). Even though these individual observations are of lower quality and Strehl than the LBT ones (compare Figs. 4 and 5 to that of the LBT in Fig. 6), the 15 years between these observations and those of the LBT can highlight even very small orbital motions of bound systems in the Trapezium. It also shows the very significant improvement in high Strehl AO now possible with Pyramid wavefront sensors and next generation adaptive secondary mirrors (ASMs).
A test to see how accurate our astrometry is over the last 15 years is to look at the separation and PA of B1 vs. B2. The scatter of the Ori separation (which should be very close to a constant since the system has an orbital period of yr) will highlight systematic errors. The lack of any motion between and is also confirmed by Schertl et al. (2003) and Close et al. (2003c). Our detailed LBT and past data on the B and A groups from the literature is summarized in Table 2. Linear (weighted) fits to the data in Table 2 (Figures 7 to 14) yield the velocities shown in Table 2. The overall error in the relative proper motions observed is now mas/yr in proper motion ( km/s).
5 ANALYSIS & DISCUSSION
With these accuracies it is now possible to determine whether these stars in the Ori group are bound together, or merely chance projections in this very crowded region. We adopt the masses of each star from the Siess Forestini & Dougados (1997); Bernasconi & Maeder (1996) tracks fit by Weigelt et al. (1999) where we find masses of: ; ; ; ; ; ; ; and . Based on these masses (which are similar to those adopted by Schertl et al. (2003)) we can comment on whether the observed motions are less than the escape velocities expected for simple face-on circular orbits.
Our combination of high spatial resolution and high signal to noise shows that there is no detectable motion in the system over the last 15 years (as we would expect if the true separation is AU)). But we have observed clear orbital motion (at km/s) in the very tight Ori system in PA (see Figure 10). Also we see clear orbital motion (consistent with curvature) of km/s in the Ori system (see Figs. 11 and 12). We know this is likely orbital motion since both binaries have moved in an nearly circular arc of over the last 15 years with almost no change in the separation between components, hence it appears (at least with the limited amount of observed orbital phase) that both of these binaries are consistent with roughly circular, close to face-on, orbits.
5.1 Is the Ori System Physical?
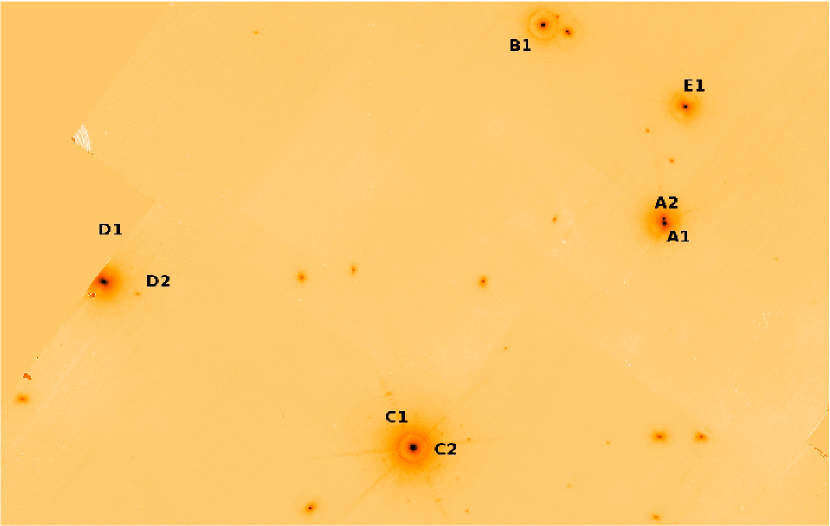
The relative velocity in the Ori system (in the plane of the sky) is now more accurate by compared to that of Close et al. (2003c). Our new velocity of km/s is consistent, but with much lower errors, with the km/s of Close et al. (2003c) (this velocity is in the azimuthal direction; see Figure 10). This is a reasonable since an orbital velocity of km/s is expected from a face-on circular orbit from a binary system like Ori with a 51 AU projected separation (implying an orbital period of order yr). It is worth noting that this velocity is also greater than the km/s Hillenbrand & Hartmann (1998) dispersion velocity of the cluster. Hence it is most likely that these two and stars (separated by just 0.115) are indeed in orbit around each other. Moreover, there are only 10 stars known to have in the inner (see Figure 2), we can estimate that the chances of finding two bright () stars within is a small probability.
Our observed velocity of /yr is consistent (in both direction and magnitude) with the /yr observed by Schertl et al. (2003) and the /yr of Close et al. (2003c). This suggests that the AO and speckle datasets are both detecting real motion, but the addition of the LBT dataset has reduced the errors by . Moreover, since this motion is primarily azimuthal strongly suggests an orbital arc of orbiting .
5.2 Is the Ori System Physical?
We observe km/s of relative motion in the Ori system (mainly in the azimuthal direction; see Figure 12). This is higher than the average dispersion velocity of km/s yet well below an estimated escape velocity of the system (projected separation of 94 AU). Hence it is highly likely that these two and stars (separated by just 0.193) are indeed in orbit around each other. In addition, there are only 8 stars known to have in the inner (see Figure 2), we can estimate that the chances of finding two bright () stars within is a small probability.
Our observed velocity of km/s is much more accurate (and lower) than the km/s found by Close et al. (2003c). Our new value is consistent (in both direction and magnitude) with the km/s observed by Schertl et al. (2003). This again suggests that the AO and speckle datasets are both detecting real motion of orbiting .
5.3 Is the Ori B Group Stable?
The pair is moving at a low km/s in the plane of the sky w.r.t. to the pair where the escape velocity km/s for this system. Hence these pairs are very likely gravitationally bound together. However, radial velocity measurements will be required to be absolutely sure that these 2 pairs are truly bound together.
5.3.1 Is the Orbit of Ori Stable?
The situation is somewhat different for the faintest component of the group, . It has mag which according to Hillenbrand & Carpenter (2000) suggests a mass of only . Since there are only 20 stars known to have in the inner (see Fig. 6), we can estimate that the chances of finding a star within of is a small probability. The two AO measurements of Close et al. (2003c) (and the one speckle detection of Schertl et al. (2003)) did not detect a significant velocity of w.r.t. : km/s.
However, our much better data and timeline has shed some light on the question of B4 orbiting B1. As is clear from Figures 13 & 14, the there appears to be a real velocity of km/s detected. This is greater than the random velocity of the cluster yet below the escape velocity of km/s, this points towards being gravitationally bound member of the Ori B group. This is the first time we can say that the lowest mass member of the B group is likely bound.
On the other hand, its very low mass and its projected location w.r.t. to the other four groups members makes it highly unlikely that is on a long-term stable orbit within the group. As we will discuss in the next section even the much more massive may not be stable in the long-term.
5.3.2 Is the orbit of around and of around stable in the long-term?
, and are two binaries with projected separations of 0.13 AU () and 52 AU (); respectively. The two pairs are separated by a projected distance of 415 AU. The distance and thus the system is stable. Much more interesting is the case of . Their projected distance is not very small compared to their projected distance (D) from the pair:. Thus the stability of the orbit needs a more detailed analysis since it is possible that may be ejected in the future.
Eggelton & Kiseleva (1995) have given an empirical criterion for the long-term stability of the orbits of hierarchical triple systems, based on the results of their extensive model calculations (Kiseleva & Eggelton, 1994; Kiseleva et al., 1994; Eggelton & Kiseleva, 1995). Their analytic stability criterion is good to about , and is meant to indicate stability for another orbits. Given the uncertainties of the masses of the members of the B group, this accuracy is sufficient for our present discussion.
The orbital period of the two binaries w.r.t. each other is yrs, while the orbital period of w.r.t amounts to yrs. For the calculation of both periods, we have assumed the masses as given above, and circular orbits in the plane of the sky. This leads to a period ratio . Eggelton & Kiseleva’s stability criterion requires for the masses in the B group. This means that within the accuracy limits of our investigation, the binary is just at the limit of stability. The stability criterion depends also on the orbits’ eccentricities. In our case, already mild eccentricities of the order of (as can be expected to develop in hierarchical triple systems; see, e.g., Georgakarakos 2002), make the B group unstable. While we cannot decide yet whether the pair orbit each other in a stable way, it is safe to say that that the “triple” , , and is not a simple, stable hierarchical triple system.
The Ori B system seems to be a good example of a highly dynamic star formation ”mini-cluster” which might in the future eject the lowest-mass member(s) through dynamical decay (Durisen, Sterzik, & Pickett, 2001), and breaking up the gravitational binding of the widest of the close binaries (the system). The ”ejection” of the lowest-mass member of a formation ”mini-cluster” could play a major role in the formation of low mass stars and brown dwarfs (Reid et al., 2001a; Bate et al., 2002; Durisen, Sterzik, & Pickett, 2001; Close et al., 2003a). The breaking up of binaries, of course, modifies the binary fraction of main sequence stars considerably as well.
6 FUTURE OBSERVATIONS
Future observations are required to see, if indeed, these stars continue to follow orbital arcs around each other proving that they are interacting with one another. In addition, future observations of the Ori positions would help deduce if it is on a marginally stable orbit given its “non-hierarchical” location in the B group.
Future observations should also try to determine the radial velocities of these stars. Once radial velocities are known one can calculate the full space velocities of these stars. Such observations will require both very high spatial and spectral resolutions. This might be possible with such instruments like the AO fed ARIES echelle instrument at the MMT.
References
- Abt, Wang, & Cardona (1991) Abt H.A., Wang R., Cardona O., 1991, ApJ, 367, 155
- Bate et al. (2002) Bate, M.R., Bonnell, I.A., Bromm, V. 2002, MNRAS, 332, L65
- Bate et al. (2003) Bate, M.R., Bonnell, I.A., Bromm, V. 2003, MNRAS, 277, 362
- Bate et al. (2009) Bate, M.R. 2009, MNRAS, 392, 590
- Bate et al. (2011) Bate, M.R. 2011, MNRAS, in press
- Bernasconi & Maeder (1996) Bernasconi P.A., & Maeder A. 1996, A&A, 307, 829
- Brusa et al. (2003a) Brusa, G., et al. 2003a, Proc. SPIE 4839, 691.
- Brusa et al. (2003b) Brusa, G., et al. 2003b, Proc. SPIE 5169, 26
- Burgasser et al. (2003) Burgasser, A. et al. 2003, ApJ, 586, 512
- Burgasser et al. (2007) Burgasser, A., Reid, L.N., Siegler, N., Close, L., Allen, P., Lowerance, P., Gizis, J. (2007),Protostars and Planets V, B. Reipurth, D. Jewitt, and K. Keil (eds.), University of Arizona Press, Tucson, 951 pp., p.427-441
- Burrows et al. (2000) Burrows, A., Hubbard, W. B., Lunine, J. I., Marley, M. S., Saumon, D. 2000, Protostars and Planets IV (Tucson: University of Arizona Press, eds Mannings, V., Boss, A.P., Russell, S. S.), p. 1339
- Bouy et al. (2003) Bouy, H., Brandner W., Martín, E., Delfosse, X., Allard, F., & Basri, G. 2003, AJ, 126, 1526
- Bossi et al. (1989) Bossi M., Gaspani A., Scardia M., Tadini M., 1989, A&A, 222, 117
- Chabrier et al. (2000) Chabrier, G., Baraffe, I., Allard, F., & Hauschildt, P. 2000, ApJ, 542, 464
- Close et al. (1998) Close, L.M., Roddier, F.J., Roddier, C.A., Graves, J.E., Northcott, M.J., Potter, D. 1998, Proc. SPIE Vol. 3353, p. 406-416. Adaptive Optical System Technologies, D. Bonaccini, R.K. Tyson, Eds
- Close (2000) Close, L. M. 2000, Proc. SPIE Vol. 4007, p758-772. Adaptive Optical Systems Technology, P.L. Wizinowich, Ed.
- Close et al. (2002a) Close, L.M. et. al. 2002a, ApJ, 566, 1095.
- Close et al. (2002b) Close, L.M. et. al. 2002b, ApJ, 567, L53.
- Close et al. (2003a) Close, L.M., Siegler, N., Freed, M., Biller, B. 2003a ApJ, 587, 407
- Close et al. (2003b) Close, L.M. et al. 2003b ApJ, 598, 35.
- Close et al. (2003c) Close, L.M. et al. 2003c ApJ, 599, 537.
- Close et al. (2007) Close, L.M. et al. 2007 ApJ, 665, 736.
- Diolaiti et al. (2000) Diolaiti, E., Bendinelli, O. Bonaccini, D.; Close, L Currie, D. Parmeggiani, G. 2000, A&AS 147, 335
- Durisen, Sterzik, & Pickett (2001) Durisen, R.H., Sterzik, M.F., & Pickett, B.K. 2001, A&A, 371, 952
- Duquennoy & Mayor (1991) Duquennoy, A., Mayor, M. 1991, A&A, 248, 485
- Eggelton & Kiseleva (1995) Eggelton P., Kiseleva L., 1995, ApJ, 455, 640
- Esposito et al. (2011) Esposito, S. et al. proc. 2011, SPIE 8149, 814902-10
- Esposito et al. (2010a) Esposito, S. et al. proc. 2010a SPIE 7736, 773609-12
- Esposito et al. (2010b) Esposito, S. et al. proc. 2010b Applied Optics, 49, issue 31, p. G174
- Fischer & Marcy (1992) Fischer, D. A., Marcy, G. W. 1992, ApJ, 396, 178
- Freed, Close, & Siegler (2003) Freed, M., Close, L.M., & Siegler, N. 2003, ApJ, 584, 453
- Genzel & Stutzki (1989) Genzel R., Stutzki J., 1989, ARA&A 27, 41
- Graves et al. (1998) Graves, J.E., Northcott, M.J., Roddier, F.J., Roddier, C.A., Close, L.M. 1988, Proc. SPIE Vol. 3353, p. 34-43. Adaptive Optical System Technologies, D. Bonaccini, R.K. Tyson, Eds.
- Gizis et al. (2003) Gizis, J.E. et al. 2003, ApJ, 120, 1085
- Hillenbrand & Carpenter (2000) Hillenbrand L.A., & Carpenter J. 2000 ApJ, 540, 236
- Hillenbrand & Hartmann (1998) Hillenbrand L.A., & Hartmann L.W. 1998 ApJ, 492, 540
- Hinz et al. (2002) Hinz J.L., McCarthy D.W., Simons, D.A., Henry T.J., Kirkpatrick J.D., McGuire P.C. 2002, AJ, 123, 2027
- Hinz et al. (2010) Hinz P.M. et al. 2010, ApJ716 417
- Hodapp et al. (1996) Hodapp, K.-W., Hora, J. L., Hall, D. N. B., Cowie, L. L., Metzger, M., Irwin, E., Vural, K., Kozlowski, L. J., Cabelli, S. A., Chen, C. Y., Cooper, D. E., Bostrup, G. L., Bailey, R. B., Kleinhans, W. E. 1996, New Astronomy, 1, 177
- Kiseleva & Eggelton (1994) Kiseleva L.G., Eggelton P.P., Anosova J.P., 1994, MNRAS 267, 161
- Kiseleva et al. (1994) Kiseleva L.G., Eggelton P.P., Orlov V.V., 1994, MNRAS 270, 936
- Kraus et al. (2007) Kraus, S. et al. 2007, A&A 466, 649
- Kohler et al. (2006) Kohler, R. et al. 2006, A&A 458, 461
- Lloyd-Hart (2000) Lloyd-Hart M. 2000, PASP 112, 264
- McCaughrean & Stauffer (1994) McCaughrean M.J, & Stauffer J.R., 1994, AJ, 108, 1382
- McCaughrean (2000) McCaughrean M.J 2000, The Formation of Binary Stars, Proceedings of IAU Symp. 200, held 10-15 April 2000, in Potsdam, Germany, Edited by Hans Zinnecker and Robert D. Mathieu, 2001, p. 169.
- McCarthy & Zuckerman (2004) McCarthy C., Zuckerman, B. (2004), AJ 127, 2871
- McCarthy et al. (1998) McCarthy D.W. et al. 1998, Proc. SPIE 3354 750
- McDonald & Clarke (1995) McDonald, J. M., & Clarke, C. J. 1993, MNRAS, 262, 800
- Parker et al. (2011) Parker, R.J., Goodwin, S., Allison, R.J. 2011, MNRAS418, 2565
- Petr et al. (1998) Petr M.G., Du Foresto V., Beckwith S.V.W., Richichi A., McCaughrean M.J. 1998, ApJ, 500, 825
- Potter et al. (2002a) Potter, D. et al. 2002a ApJ, 567, 113
- Reid et al. (2001a) Reid, I. N., Gizis, J.E., Kirkpatrick, J.D., Koerner, D. W. 2001a, AJ, 121, 489
- Reid et al. (2001b) Reid, I. N., Burgasser, A. J., Cruz, K. L., Kirkpatrick, J. D., Gizis, J. E. 2001b, AJ, 121, 1710
- Reipurth & Clarke (2001) Reipurth, B. & Clarke, C. 2001, AJ, 122, 432
- Ricci et al. (2007) Ricci, Luca; Robberto, M.; Soderblom, D. R.; Kozhurina-Platais, V. 2007, BAAS 211, 8923
- Schertl et al. (2003) Schertl, D., Balega, Y.Y., Preibisch, Th., & Weigelt, G. 2003, A&A, 402, 267
- Siegler et al. (2003) Siegler, N., Close, L.M., Mamajek, E., Freed, M. 2003, ApJ, 598, 1265
- Siess Forestini & Dougados (1997) Siess L., Forestini M., Dougados C., 1997, A&A 324, 556
- Simon, Close, & Beck (1999) Simon, M., Close, L.M., & Beck, T. 1999, AJ, 117, 1375
- Sterzik & Durisen (1998) Sterzik, M. F., & Durisen, R. H. 1998 A&A, 339, 95
- Stetson (1987) Stetson, P. B. 1987, PASP, 99, 191
- Wainscoat & Cowie (1992) Wainscoat R. J., & Cowie, L.L. 1992, AJ, 103, 332.
- Weigelt et al. (1999) Weigelt G., Balega, Y., Preibisch T., Schertl D., Scholler M., Zinnecker H. 1999, A&A, 347, L15
- Wildi et al. (2003a) Wildi F., Brusa G., Riccardi A., Lloyd-Hart M., Martin H.M., L.M. Close 2003, proc. SPIE 4839, 155
- Wildi et al. (2003b) Wildi F. Brusa G., Lloyd-Hart M., Martin H.M., L.M. Close, Riccardi A. 2003b, proc SPIE 5169, 17.
| RAaato calculate full RA simply prefix 5:35 to column 1 () and for full DEC simply prefix -5: to column 2 (”). So for example we find Ori C1 is at RA=5:35:16.4602 and DEC=-5:23:22.8832 (J2000). | DECaato calculate full RA simply prefix 5:35 to column 1 () and for full DEC simply prefix -5: to column 2 (”). So for example we find Ori C1 is at RA=5:35:16.4602 and DEC=-5:23:22.8832 (J2000). | X | Y | Phot | [FeII] | Phot | [FeII]- | Comm. | |
|---|---|---|---|---|---|---|---|---|---|
| J2000 | J2000 | pixelbbthese pixels are in the filter with a platescale of . Increasing Y is due North, and increasing X is in the due West direction | pixelbbthese pixels are in the filter with a platescale of . Increasing Y is due North, and increasing X is in the due West direction | (mag) | Error | (mag) | Error | Color | |
| 15.2934 | 23:23.1241 | 1973.024 | 1338.378 | 15.326 | 0.016 | 0 | 0 | na | no [FeII] image |
| 15.3534 | 23:24.0418 | 1926.703 | 1290.952 | 16.102 | 0.012 | 0 | 0 | na | no [FeII] image |
| 15.5336 | 23:15.6412 | 1787.666 | 1725.089 | 16.035 | 0.015 | 17.715 | 0.024 | 1.68 | |
| 15.5517 | 23:29.5216 | 1773.713 | 1007.755 | 16.859 | 0.015 | 0 | 0 | na | no [FeII] image |
| 15.594 | 22:58.832 | 1741.035 | 2593.750 | 14.702 | 0.017 | 15.664 | 0.025 | 0.962 | |
| 15.6306 | 22:56.385 | 1712.828 | 2720.215 | 10.676 | 0.012 | 11.945 | 0.009 | 1.269 | |
| 15.7255 | 23:22.4347 | 1639.552 | 1374.004 | 11.743 | 0.007 | 12.970 | 0.032 | 1.227 | |
| 15.7673 | 23:9.82764 | 1607.314 | 2025.533 | 9.3918 | 0.016 | 9.447 | 0.020 | 0.0552 | E1 single |
| 15.7879 | 23:26.5168 | 1591.355 | 1163.044 | 12.641 | 0.009 | 13.895 | 0.032 | 1.254 | tail away from C1 |
| 15.8018 | 23:11.8906 | 1580.662 | 1918.921 | 14.409 | 0.041 | 14.971 | 0.033 | 0.562 | |
| 15.8202 | 23:14.2891 | 1566.428 | 1794.966 | 8.862 | 0.040 | 8.784 | 0.036 | -0.078 | A1 see table 2 |
| 15.8217 | 23:14.0972 | 1565.298 | 1804.883 | 10.322 | 0.037 | 10.392 | 0.033 | 0.07 | A2 see table 2 |
| 15.8337 | 23:22.4207 | 1556.059 | 1374.727 | 11.521 | 0.005 | 12.827 | 0.031 | 1.306 | |
| 15.8408 | 23:25.5078 | 1550.599 | 1215.191 | 13.268 | 0.011 | 14.388 | 0.047 | 1.12 | tail away from C1 |
| 15.863 | 23:10.7606 | 1533.468 | 1977.318 | 14.411 | 0.023 | 15.485 | 0.041 | 1.074 | |
| 15.8739 | 23:1.89992 | 1524.986 | 2435.234 | 12.637 | 0.014 | 13.553 | 0.031 | 0.916 | |
| 15.9654 | 23:22.6589 | 1454.430 | 1362.420 | 16.199 | 0.017 | 17.120 | 0.025 | 0.921 | |
| 16.0635 | 23:24.2937 | 1378.699 | 1277.933 | 15.907 | 0.065 | 17.586 | 0.082 | 1.679 | tail away from C1 |
| 16.064 | 23:7.05258 | 1378.302 | 2168.947 | 12.067 | 0.010 | 11.919 | 0.019 | -0.148 | B3 see table 2 |
| 16.069 | 23:6.96452 | 1374.429 | 2173.498 | 10.025 | 0.011 | 10.845 | 0.017 | 0.82 | B2 see table 2 |
| 16.0715 | 23:27.7444 | 1372.539 | 1099.602 | 15.928 | 0.027 | 17.152 | 0.062 | 1.224 | tail away from C1 |
| 16.0717 | 22:54.2677 | 1372.379 | 2829.663 | 14.591 | 0.015 | 18.480 | 0.049 | 3.889 | – binary 1B Table 3 |
| 16.0795 | 22:54.036 | 1366.341 | 2841.632 | 14.215 | 0.017 | 16.958 | 0.021 | 2.743 | –binary 1A see Table 3 |
| 16.0928 | 23:23.0106 | 1356.092 | 1344.243 | 16.379 | 0.021 | 20.27 | 0.15 | 3.891 | very red Brown Dwarf? |
| 16.0942 | 23:6.41047 | 1355.015 | 2202.131 | 13.552 | 0.024 | 13.825 | 0.029 | 0.273 | B4 see table 2 |
| 16.1006 | 23:14.1407 | 1350.043 | 1802.635 | 13.950 | 0.010 | 15.228 | 0.040 | 1.278 | – bin. 2A, Table 3 |
| 16.1014 | 23:14.2772 | 1349.480 | 1795.580 | 17.643 | 0.077 | 19.004 | 0.197 | 1.361 | – bin. 2B, Table 3 |
| 16.1299 | 23:6.71895 | 1327.477 | 2186.189 | 8.787 | 0.001 | 8.842 | 0.002 | 0.055 | B1 SB see table 2 |
| 16.1396 | 22:55.249 | 1319.930 | 2778.926 | 14.945 | 0.016 | 16.152 | 0.023 | 1.207 | |
| 16.2263 | 23:19.0612 | 1253.022 | 1548.345 | 15.072 | 0.014 | 15.861 | 0.089 | 0.789 | |
| 16.283 | 23:16.512 | 1209.290 | 1680.088 | 12.199 | 0.010 | 13.298 | 0.058 | 1.099 | astrometric zeropointccwe used this single star (called LV3 or 163-317) as the astrometric zeropoint as it has a good position the the Hubble ACS data of Ricci et al. and is imaged in all of of our AO data. It has a location of 5:35:16.460 -5:23:22.812 J2000. |
| 16.3206 | 23:22.5317 | 1180.291 | 1368.992 | 15.185 | 0.029 | 16.261 | 0.029 | 1.076 | proj. sep. to C1 |
| 16.3241 | 23:25.2679 | 1177.537 | 1227.588 | 15.709 | 0.024 | 16.219 | 0.058 | 0.51 | |
| 16.3997 | 23:11.2870 | 1119.16 | 1950.11 | 17.12 | 0.2 | 19.196 | 0.070 | 2.076 | Brown Dwarf? |
| 16.4602 | 23:22.8832 | 1072.497 | 1350.827 | 8 | 1.0 | 8 | 1.0 | 0 | C1 binary (saturated) |
| 16.4619 | 23:22.8443 | 1071.207 | 1352.838 | 7 | 1.0 | 7 | 1.0 | 0 | C2 to C1 |
| 16.6148 | 23:16.0836 | 953.204 | 1702.226 | 12.762 | 0.012 | 14.106 | 0.062 | 1.344 | |
| 16.6529 | 23:28.8309 | 923.797 | 1043.453 | 14.928 | 0.011 | 16.050 | 0.058 | 1.122 | |
| 16.7236 | 23:25.1688 | 869.219 | 1232.707 | 11.705 | 0.012 | 11.573 | 0.072 | -0.132 | |
| 16.7469 | 23:16.3777 | 851.247 | 1687.030 | 11.721 | 0.009 | 13.529 | 0.061 | 1.808 | tail away from C1 |
| 16.7621 | 23:28.0209 | 839.571 | 1085.313 | 13.838 | 0.016 | 14.254 | 0.067 | 0.416 | |
| 16.8258 | 23:25.9032 | 790.355 | 1194.754 | 16.951 | 0.045 | 18.094 | 0.075 | 1.143 | – bin. 3B, Table 3 |
| 16.8409 | 23:26.2297 | 778.753 | 1177.879 | 15.656 | 0.109 | 16.831 | 0.091 | 1.175 | – Bowshock Bin 3A |
| 16.8633 | 23:7.03118 | 761.435 | 2170.053 | 15.402 | 0.008 | 16.107 | 0.066 | 0.705 | |
| 17.0595 | 23:33.9787 | 610.024 | 777.417 | 11.020 | 0.030 | 11.264 | 0.035 | 0.244 | |
| 17.1675 | 23:17.0013 | 526.70 | 1654.80 | 0.0 | 0.0 | 15.465 | 0.107 | na | D2 proj. sep. to D1 |
| 17.2558 | 23:16.5298 | 458.479 | 1679.17 | 0.0 | 0.0 | 8.658 | 0.1 | na | D1 no image |
| System | Separation | Sep. Vel. | PA | PA Vel. | Telescope | epoch | ||
|---|---|---|---|---|---|---|---|---|
| name | (mag) | (mag) | () | (Sep. mas/yr) | (∘) | (∘/yr) | (m/d/y) | |
| SAOaaspeckle observations of Weigelt et al. (1999). | 10/14/97 | |||||||
| bbthese low values are possibly due to Ori being in eclipse during the 11/03/98 observations of Weigelt et al. (1999). | SAOaaspeckle observations of Weigelt et al. (1999). | 11/03/98 | ||||||
| GEMINI | 09/19/01 | |||||||
| MMT | 01/20/03 | |||||||
| LBT | 10/16/11 | |||||||
| before LBT= | -0.6 | 0.07 | ||||||
| with LBT= | -0.27 | -0.013 | ||||||
| corr.= | 84%; no vel. | corr.= | 45%; no vel. | |||||
| detected | detected | |||||||
| SAOaaspeckle observations of Weigelt et al. (1999). | 10/14/97 | |||||||
| SAOaaspeckle observations of Weigelt et al. (1999). | 11/03/98 | |||||||
| GEMINI | 09/19/01 | |||||||
| MMT | 01/20/03 | |||||||
| LBT | 10/16/11 | |||||||
| before LBT= | 0.93 | |||||||
| with LBT= | -0.10 | 1.15 | ||||||
| corr.= | 56%; no vel. | 4.90.3 km/s | ||||||
| detected | corr.=99.9% | |||||||
| SAOccspeckle observations of Schertl et al. (2003). | 02/07/01 | |||||||
| GEMINI | 09/19/01 | |||||||
| MMT | 01/20/03 | |||||||
| LBT | 10/16/11 | |||||||
| before LBT= | 0.1 | |||||||
| with LBT= | 0.53 | 0.18 | ||||||
| 1.10.5 km/s | 4.131.8 km/s | |||||||
| corr.=91.1% | corr.=99.7% | |||||||
| Calar Altoddspeckle observations of Petr et al. (1998). | 11/15/94 | |||||||
| SAOaaspeckle observations of Weigelt et al. (1999). | 11/03/98 | |||||||
| GEMINI | 09/19/01 | |||||||
| LBT | 10/16/11 | |||||||
| before LBT= | 2.13 | |||||||
| with LBT= | -1.4 | 0.92 | ||||||
| 2.90.4 km/s | 6.60.5 km/s | |||||||
| corr.= 94.1% | corr.= 98.9% |
| Bin. | RAaaThe RA and DEC are the same format as in Table 1 | DECaaThe RA and DEC are the same format as in Table 1 | X | Y | Sep. | PA | Comment | ||
|---|---|---|---|---|---|---|---|---|---|
| J2000 | J2000 | pixelbbThe X and Y location are same format as in Table 1 | pixelbbThe X and Y location are same format as in Table 1 | (mag) | (mag) | (mas) | (∘) | ||
| 1A | 16.0795 | 22:54.036 | 1366.341 | 2841.632 | B has more | ||||
| 1B | 16.0717 | 22:54.2677 | 1372.379 | 2829.663 | extinction than A | ||||
| A&B both very red | |||||||||
| 2A | 16.1006 | 23:14.1407 | 1350.043 | 1802.635 | B has strong | ||||
| 2B | 16.1014 | 23:14.2772 | 1349.480 | 1795.580 | gray extinction? | ||||
| 3A | 16.8409 | 23:26.2297 | 778.753 | 1177.879 | Bowshock | ||||
| 3B | 16.8258 | 23:25.9032 | 790.355 | 1194.754 | between binary? |