Charmonium production from nonequilibrium charm and anticharm quarks in quark-gluon plasma
Abstract
Parameterizing the charm and anticharm quark momentum distributions by the Tsallis distribution, we study the nonequilibrium effect on the charmonium production rate in a quark-gluon plasma up to the next-to-leading order in perturbative QCD. We find that nonequilibrium charm and anticharm quarks suppress the charmonium production rate compared to that from equilibrated ones. We further show that the suppression factor calculated with the charm quark relaxation time, which has been frequently used in the literature, is close to our results.
pacs:
25:75.CjI introduction
Since the suggestion of using charmonium suppression as a possible signature for the formation of a quark-gluon plasma (QGP) in relativistic heavy-ion collisions Matsui:1986dk , there have been many theoretical Vogt:1999cu ; Zhang:2000nc ; Zhang:2002ug ; Yan:2006ve ; Zhao:2007hh ; Song:2010ix ; Song:2010er ; Zhao:2011cv ; Song:2011xi and experimental Alessandro:2004ap ; Adare:2006ns ; :2010px ; Silvestre:2011ei ; MartinezGarcia:2011nf studies on charmonium production in heavy ion collisions at energies available from the Super Proton Synchrotron (SPS), the Relativistic Heavy Ion Collider (RHIC), and the Large Hadron Collider (LHC). Although the collision energy spans two orders of magnitude from SPS to LHC, the observed suppression of charmonium production in these collisions was found to be similar. A possible explanation for this surprising result is that the expected larger suppression of charmonium production with increasing collision energy is compensated by the increasing number of regenerated charmonia from initially produced charm and anticharm quarks in QGP. This is because the number of regenerated charmonia is quadratically proportional to Andronic:2006ky while that of directly produced charmonia depends linearly on the number of charm quarks Andronic:2006ky ; Adare:2006kf ; Adare:2010de . Studies based on phenomenological models indeed show that although the fraction of regenerated charmonium is compatible to that of directly produced one in central Au+Au collisions at RHIC, it becomes dominant in central Pb+Pb collisions at LHC Yan:2006ve ; Zhao:2007hh ; Song:2010ix ; Zhao:2011cv ; Song:2011xi as more charm and anticharm quarks are produced.
The charmonia production rate in QGP depends on the charm and anticharm quark distributions in both momentum and coordinate spaces Greco:2003vf . Presently it is not clear to what degree charm and anticharm quarks, which are produced from initial hard collisions with a power law distribution, are thermalized in relativistic heavy-ion collisions. It seems that charm and anticharm quarks of low transverse momentum are close to while those of intermediate and high transverse momenta are far from thermal equilibrium Song:2011kw . In Refs. Zhao:2007hh ; Song:2010ix ; Song:2010er ; Zhao:2011cv ; Song:2011xi , the charm quark nonequilibrium effect on charmonia regeneration in QGP is included by multiplying the expected equilibrium charmonium number by a relaxation factor with being the relaxation time of charm quarks in QGP. Since the latter has a value , the regeneration contribution to charmonium production is suppressed by a factor of 0.53, 0.68 and 0.8 in heavy ion collisions at SPS, RHIC, and LHC, respectively, when the corresponding QGP lifetime is about 3.0, 4.5, and 6.5 fm. To check the accuracy of the estimate based on the relaxation factor, we calculate in the present study the charmonium production rate using the Tsallis distribution for charm and anticharm quarks Tsallis:1987eu ; Tang:2008ud . The Tsallis distribution with a parameter is a generalized Boltzmann distribution, which is the same as the normal Boltzmann distribution when but becomes a harder power law distribution as the value of increases. In this study, we define and determine its values for the initially produced charm and anticharm quarks from hard collisions at RHIC and LHC by fitting the charm quark spectra generated by the event generator PHYTIA Sjostrand:2006za . To study how the charm and anticharm quarks approach equilibrium in a QGP, we use the parton cascade model based on their elastic scattering with light quarks and gluons in the QGP. Fitting these distributions by the Tsallis distribution, we then calculate the charmonium production rate using the transition amplitude that is calculated up to the next-to-leading order (NLO) in perturbative QCD (pQCD) Song:2005yd ; Park:2007zza . We find that nonequilibrium charm and anticharm quarks suppress the charmonium production rate compared to that from equilibrated ones and that the suppression factor estimated from the charm quark relaxation time, which has been frequently used in the literature, is close to our results.
This paper is organized as follows. We first give in Sec. II the transition amplitudes for charmonium production in pQCD. In Sec. III, we derive the expression for the charmonium production rate from charm and anticharm quarks based on the Tsallis distribution and study the dependence of the production rate on the parameters in the Tsallis distribution. We then apply in Sec. IV these results to heavy-ion collisions at RHIC and LHC. Finally, we give the conclusions in Sec. V. For details on the evaluation of the phase space integral in the charmonium production rate, they are given in Appendix A.
II transition amplitudes for charmonium production
Although the suggestion of suppression as a signature of QGP was based on the idea that the could not be formed in QGP Matsui:1986dk due to screening of the color charge, recent studies on the spectral functions of charmonia have suggested, on the other hand, that the dissociation temperature of is higher than the critical temperature for QGP phase transition Hatsuda04 ; Datta04 ; Mocsy:2007yj , indicating that the can survive and be regenerated in QGP.
In pQCD, the leading-order process for production from charm and anticharm quarks is the reaction . The transition amplitude for this reaction is same as that for the dissociation reaction given in Refs. Song:2005yd ; Park:2007zza , that is
| (1) |
In the above, and are, respectively, the gluon energy and the relative three momentum of charm and anticharm quarks in the rest frame with being the binding energy of ; is the strong coupling constant which is taken to be 1.87 from previous phenomenological studies Song:2011xi ; Song:2011nu , and and are the masses of charm quark and , respectively; is the thermal gluon mass obtained from lattice data using the quasiparticle model Levai:1997yx ; and is the wavefunction of . To include the medium effect, we use the temperature-dependent wavefunction and binging energy of obtained from solving the Schrödinger equation using the screened Cornell potential between charm and anticharm quarks Karsch:1987pv . Eq. (1) becomes the same as that of Bhanot and Peskin Peskin:1979va ; Bhanot:1979vb if is taken to be the Coulomb wavefunction for the state.
For the next-leading order (NLO) reaction in pQCD, its transition amplitude is the same as that for the reaction . As given in Ref. Song:2005yd ; Park:2007zza , the squared transition amplitudes of quark- and gluon-induced NLO processes are
| (2) | |||
| (3) |
where is the number of quark colors, and and are the momenta of incoming and outgoing partons, respectively.
Other NLO reactions include which can be obtained from the reactions by changing the incoming parton to an outgoing parton. Their squared amplitudes can thus be obtained from Eqs. (2) and (3) by changing and to and , respectively, and by multiplying Eq. (2) by an overall minus sign and the nubmer of light quark flavors, that is
| (4) | |||
| (5) |
III the charmonium production rate
The production rate of charmonium with momentum in a QGP from the LO and NLO charm and anticharm quark recombination processes described in the previous Section can be written as Zhao:2010ti
| (6) | |||||
| (7) | |||||
| (8) | |||||
In the above, and are, respectively, the charm and anticharm quark distributions; is the thermal parton distribution including the degeneracies of quarks due to their flavors and antiparticles; is the outgoing gluon momentum in the LO reaction; and is the outgoing parton momentum, while is the outgoing and incoming parton momentum in the NLO and reactions, respectively.
For the charm and anticharm quark distributions, we use the modified Tsallis distribution function
| (9) |
where with being a parameter in the original Tsallis distribution function and , which depends on , is given by
| (10) |
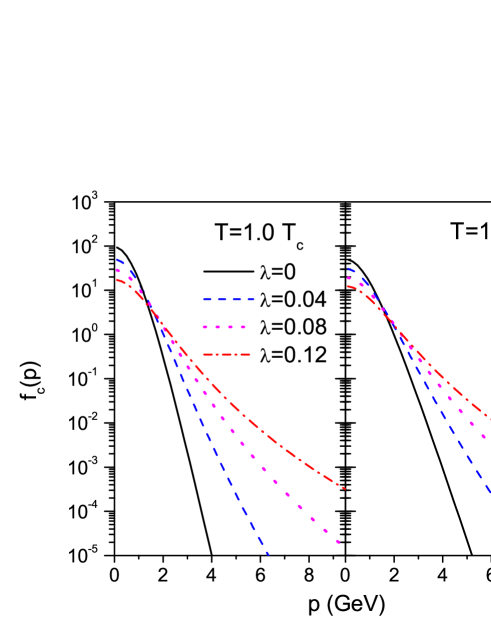
to ensure that the integration of over the charm quark momentum gives the charm quark density . In Fig. 1, we show the charm quark distribution for different values of . It is seen that as approaches 0, becomes the Boltzmann distribution. Details on the phase-space integrations in Eqs.(6), (7), and (8) with the Tsallis distribution are given in Appendix A.
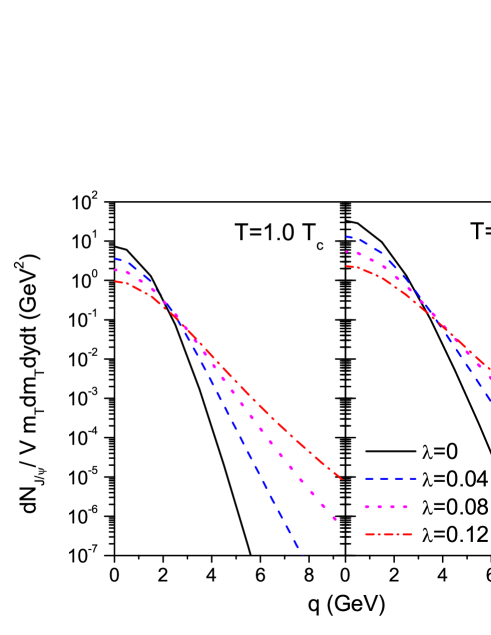
In Fig. 2, we show the production rate for charmonium of momentum in QGP at temperature (left panel) and (right panel), where is taken to be 170 MeV, from charm and anticharm quarks that have a Tsallis distribution with various values of 0, 0.04, 0.08, and 0.12. These results are obtained with the density of charm quarks in the QGP taken to be 0.008/fm3 (1 ). It is seen that the momentum dependence of the production rate becomes harder as increases. This is reasonable because a larger indicates a harder charm quark momentum spectrum. Also, the production rate is larger at 1.5 than at 1.0 , consistent with the larger thermal decay width at higher temperature.
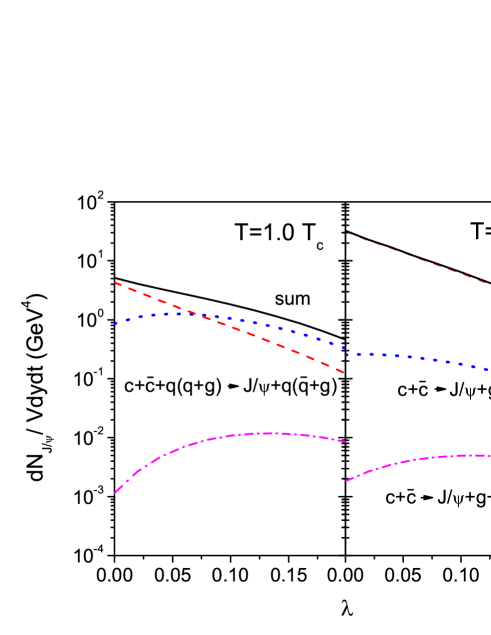
Figure 3 shows the dependence of the momentum integrated production rate per unit rapidity on the parameter for the three reactions (dotted line), (dashed line), and (dot-dashed line). The most dominant process is , especially at high temperature. The reason for this is that the common factor in the squared transition amplitudes in Eq. (1)(5) peaks at small relative momentum between charm and anticharm quarks and the value of is smaller in the reaction than in other reactions.
Figure 3 also shows that the production rate from the three reactions behave differently as the value of increases. Since harder charm and anticharm quark spectra are less favorable to production as a result of the large relative momentum between charm and anticharm quarks, the production rate of from the reaction decreases as increases, similar to that found in the coalescence model Greco:2003vf . Although the transition amplitudes in all processes favor soft charm and anticharm quark spectra, to produce additional partons in the final state as in the reactions and requires that the initial charm and anticharm quarks to have high energy. As a result, the production rates of from the reactions and increase and then decrease with increasing , particularly from the latter reaction as it has two thermal partons in the final state. The total production rate given by the sum of the production rates from the three reactions decreases, however, with increasing since it is dominated by the reaction . Therefore, nonequilibrium charm and anticharm quark distributions suppress the production rate in QGP compared to that from completely thermalized charm and anticharm quark distributions.
IV applications to heavy-ion collisions
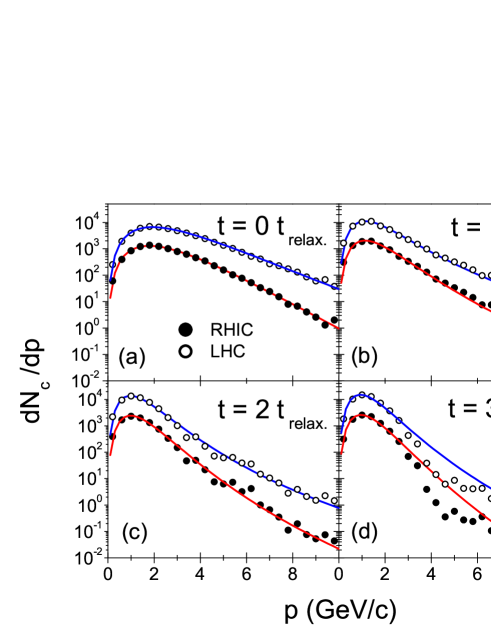
To see the relevance of our results to production in heavy ion collisions, we carry out a cascade calculation to study how the charm and anticharm quark distributions change with time in a QGP at a fixed temperature. Specifically, we take the initial charm and anticharm quark spectra at mid-rapidity () from the PHYTIA simulations Sjostrand:2006za for p+p collisions at and , available at RHIC and LHC, respectively, and they are shown by solid and open circles in panel (a) of Fig. 4. Assuming that the charm and anticharm quark spectra are isotropic in momentum space, we then find that they can be very well described by the Tsallis distribution with (650 MeV, 0.013) and (680 MeV, 0.033) as shown, respectively, by lines in panel (a) of Fig. 4. Taking the elastic scattering cross sections of charm and anticharm quarks with light quarks and antiquarks to be 1 mb and those with gluons to be 2 mb, we examine the change of their momentum distributions with time. The results for the two initial charm and anticharm quark spectra corresponding to and in a QGP of temperature are shown by solid and open circles in panels (b)-(d) of Fig. 4 for different times of 1, 2, and 3. Here denotes the charm (anticharm) quark relaxation time and is defined by
| (11) |
where is the density of parton species including its degeneracy factor in grand canonical ensemble, is the relative velocity between the charm (anticharm) quark and parton, is the elastic cross section of charm (anticharm) quark by the parton, and are three momenta of incoming and outgoing charm quarks in laboratory frame, respectively, and denotes an average over the charm quark momentum distribution. The relaxation time is thus the inverse of drag coefficient of charm quarks Svetitsky:1987gq . We find from the parton cascade simulation that the relaxation time of charm quarks in a QGP of temperature depends only weakly on their momentum distribution and has an approximate value of about 3.2 fm/. In Fig. 4, we also show by lines the fitted charm (anticharm) quark momentum distributions using the Tsallis distribution with the parameters =(190 MeV, 0.078), (140 MeV, 0.072), and (150 MeV, 0.058) for the case of RHIC and =(140 MeV, 0.107), (90 MeV, 0.097), and (100 MeV, 0.081) for the case of LHC at different times of 1, 2, and 3. It is seen that the Tsallis distribution again describes very well the charm (anticharm) quark distribution from the cascade simulation. We note that the results shown in Fig. 4 with the time measured in unit of the relaxation time hardly depends on the value of elastic cross sections of charm and anticharm quarks.
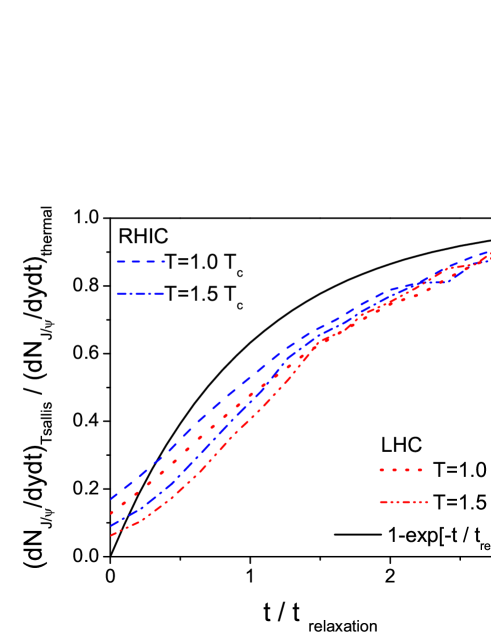
Using the production rate given in Fig. 3 and the charm and anticharm quark distribution given in Fig. 4, we can calculate the production rate and obtain its ratio with respect to the rate from completely thermalized charm and anticharm quarks. This is shown in Fig. 5 as a function of time for a QGP of temperature 1.0 and 1.5 in collisions at RHIC and LHC. These results show that the suppression of production due to the nonequilibrium charm and anticharm quark distributions is stronger at higher-energy collisions and at higher temperature. This is due to the fact that the more energetic charm and anticharm quarks produced in higher energy collisions make it harder to produce the charmonium, and that the smaller charmonium binding energy at higher temperature further suppresses its production. Although the suppression starts at different values in different cases, their time dependences all seem to be similar. Since the temperature of QGP formed in relativistic heavy ion collisions decreases with time, the suppression of production due to nonequilibrium charm anticharm quarks would decrease with time as well. For comparison, we also show in Fig. 5 by the solid line the results from using the relaxation factor that has been used in the literature to take into account the effect of nonequilibrium charm and anticharm quark distributions Zhao:2007hh ; Song:2010ix ; Song:2011xi . It is seen that the suppression of the production rate based on the nonequilibrium Tsallis distribution is similar to the relaxation factor correction. Assuming the lifetime of QGP is given by the relaxation time of charm quarks, the production rates in heavy ion collisions at RHIC and LHC are then suppressed, respectively, by 40-50 % and 35-45 % compared to those from completely thermalized charm and anticharm quarks.
V conclusions
Using the transition amplitudes for production from charm and anticharm quarks calculated up to NLO in pQCD and including the medium effect on the wavefunctions and binding energies from a screened Cornell potential between the charm and anticharm quarks in QGP, we have studied charmonium production in QGP from nonequilibrium charm and anticharm quarks that are described by the Tallis distribution. We have found that nonequilibrium charm and anticharm quarks suppress the production rate of in QGP, compared to the rate from completely thermalized charm and anticharm quarks. We have further used the calculated production rate in QGP to study production in heavy-ion collisions at RHIC and LHC by using the PHYTIA simulation to obtain the initial charm and anticharm quark distributions and then follow their elastic scattering with light quarks and antiquarks as well as gluons in QGP via the cascade simulation. With the resulting charm and anticharm quark distribution parameterized by the Tsallis distribution, we have found that the suppression in the production rate is stronger in higher energy collisions and at higher temperatures, although their time dependence is similar in all cases. We have also compared our results to those in the literature obtained with the relaxation factor correction using the charm quark relaxation time and found that the latter is similar to our results.
Acknowledgements
We thank Rapp Ralf for helpful comments on the charm quark relaxation time. This work was supported in part by the U.S. National Science Foundation under Grant Nos. PHY-0758115 and PHY-1068572, the US Department of Energy under Contract No. DE-FG02-10ER41682, and the Welch Foundation under Grant No. A-1358.
Appendix A
In this Appendix, we give details on the evaluation of the production rates in QGP from the reactions , , and , based on the Tsallis distribution for the charm and anticharm quark distributions.
A.1
Substituting Eq. (9) into Eq. (6) and using in terms of the transverse mass and rapidity , we obtain
| (12) |
where is the volume of the system. To evaluate above integrals, we first express the Tsallis distribution function in covariant form by replacing with , where with being the boost velocity and . Transforming to the center of mass frame of charm and anticharm quarks via and , which leads to and , with and , we then have
| (13) |
where is the angle between and .
Choosing the momentum of produced to be the -axis, i.e., , and denoting , we then have
where . We note that the squared transition amplitude, Eq. (1), is a function of , which is the energy of thermal gluon in the rest frame and can be expressed as .
A.2
As in the previous case, the production rate from this reaction can be expressed in the center of mass frame of charm and anticharm quarks, and it is given by
| (15) |
where and are, respectively, the three momenta of incoming and outgoing partons; and ; and is the Fermi-Dirac distribution in the quark-induced reaction and the Bose-Einstein distribution in the gluon-induced reaction. Furthermore, should be multiplied by the flavor number in the case of quark-induced reaction.
Choosing the -axis along the momentum and using
| (16) | |||||
where , the production rate becomes
| (17) |
where
| (18) |
Because the incoming energy is always larger than the invariant mass of final state, i.e., , and have the following integration limits
| (19) |
with
For the integration ranges of , , and , they are such that .
A.3
The production rate for this reaction is similar to the one for the reaction , i.e.,
| (23) |
where and are momenta of two outgoing thermal partons.
Again, choosing the -axis along the momentum and using
the production rate is then
| (25) |
where
References
- (1) T. Matsui and H. Satz, Phys. Lett. B 178, 416 (1986).
- (2) B. Alessandro et al. [NA50 Collaboration], Eur. Phys. J. C 39, 335 (2005).
- (3) A. Adare et al. [PHENIX Collaboration], Phys. Rev. Lett. 98, 232301 (2007).
- (4) G. Aad et al. [Atlas Collaboration], Phys. Lett. B 697, 294 (2011).
- (5) C. Silvestre, J. Phys. G G 38, 124033 (2011).
- (6) G. Martinez Garcia [ALICE Collaboration], J. Phys. G G 38, 124034 (2011).
- (7) R. Vogt, Phys. Rept. 310, 197-260 (1999).
- (8) B. Zhang, C. M. Ko, B. A. Li, Z. W. Lin and B. H. Sa, Phys. Rev. C 62, 054905 (2000).
- (9) B. Zhang, C. M. Ko, B. A. Li, Z. W. Lin and S. Pal, Phys. Rev. C 65, 054909 (2002).
- (10) L. Yan, P. Zhuang, N. Xu, Phys. Rev. Lett. 97, 232301 (2006).
- (11) X. Zhao and R. Rapp, Phys. Lett. B 664, 253 (2008).
- (12) T. Song, W. Park and S. H. Lee, Phys. Rev. C 81, 034914 (2010).
- (13) X. Zhao, R. Rapp, Nucl. Phys. A859, 114-125 (2011).
- (14) T. Song, K. C. Han and C. M. Ko, Phys. Rev. C 84, 034907 (2011) [Phys. Rev. C 84, 039902 (2011)].
- (15) T. Song, C. M. Ko, S. H. Lee and J. Xu, Phys. Rev. C 83, 014914 (2011).
- (16) A. Andronic, P. Braun-Munzinger, K. Redlich and J. Stachel, Nucl. Phys. A 789, 334 (2007).
- (17) A. Adare et al. [PHENIX Collaboration], Phys. Rev. Lett. 98, 232002 (2007).
- (18) A. Adare et al. [PHENIX Collaboration], Phys. Rev. C 84, 044905 (2011).
- (19) V. Greco, C. M. Ko, R. Rapp, Phys. Lett. B595, 202-208 (2004).
- (20) T. Song, W. Park and S. H. Lee, Phys. Rev. C 84, 054903 (2011).
- (21) C. Tsallis, J. Statist. Phys. 52, 479-487 (1988).
- (22) Z. Tang, Y. Xu, L. Ruan, G. van Buren, F. Wang, Z. Xu, Phys. Rev. C79, 051901 (2009).
- (23) T. Sjostrand, S. Mrenna and P. Z. Skands, JHEP 0605, 026 (2006).
- (24) T. Song and S. H. Lee, Phys. Rev. D 72, 034002 (2005).
- (25) Y. Park, K. -I. Kim, T. Song, S. H. Lee, C. -Y. Wong, Phys. Rev. C76, 044907 (2007).
- (26) M. Asakawa and T. Hatsuda, Phys. Rev. Lett. 92, 012001 (2004).
- (27) S. Datta, F. Karsch, P. Petreczky and I. Wetzorke, Phys. Rev. D 69, 094507 (2004).
- (28) A. Mocsy, P. Petreczky, Phys. Rev. D77, 014501 (2008).
- (29) T. Song, K. C. Han and C. M. Ko, arXiv:1109.6691 [nucl-th].
- (30) P. Levai and U. W. Heinz, Phys. Rev. C 57, 1879 (1998).
- (31) F. Karsch, M. T. Mehr and H. Satz, Z. Phys. C 37, 617 (1988).
- (32) M. E. Peskin, Nucl. Phys. B 156, 365 (1979).
- (33) G. Bhanot and M. E. Peskin, Nucl. Phys. B 156, 391 (1979).
- (34) X. Zhao, arXiv:1203.2572 [nucl-th].
- (35) B. Svetitsky, Phys. Rev. D 37, 2484 (1988).