11email: wyrowski, rguesten, kmenten, hwiese, bklein@mpifr-bonn.mpg.de
Terahertz ammonia absorption as a probe of infall in high-mass star forming clumps
Cloud contraction and infall are the fundamental processes of star formation. While “blue-skewed” line profiles observed in high-mass star forming regions are commonly taken as evidence of infall by an ever increasing number of studies, their interpretation offers many pitfalls. Detecting infall via redshifted absorption in front of continuum sources is a much more direct and reliable method but so far mostly restricted toward absorption in the centimeter toward strong HII regions. Here we present a novel approach by probing absorption of rotational ammonia transitions in front of the strong dust emission of massive star-forming regions. A carefully selected sample of three regions with different stages of evolution is selected to study infall through the evolution of massive star-forming clumps. Redshifted absorption is detected toward all three sources and infall rates between M⊙ yr-1 are derived.
Key Words.:
Stars: formation — ISM: kinematics and dynamics — ISM – molecules1 Introduction
The earliest phases of massive star formation (MSF) are still poorly understood. We know that massive stars are born in dense clumps within giant molecular cloud complexes. Ultracompact HII regions (UCHIIRs) embedded within these clumps represent a key phase in the early lives of massive stars (see review by Hoare, 2005). In their environments, often hot ( 100 K), compact (0.1 pc), and dense cores are found, some of which are believed to be in a stage prior to the formation of UCHIIRs (Kurtz et al., 2000). More recently, so-called high-mass protostellar objects (HMPOs) or massive young stellar objects (MYSOs) were recognized to likely represent an even earlier stage of MSF (e.g. Beuther et al., 2002). Very recently, clumps within InfraRed Dark Clouds (IRDCs) were found to be promising candidates for even earlier stages in the formation of massive stars (see Menten et al., 2005, and references therein), sometimes called pre-protocluster clumps.
One of the important results of studies of low-mass star formation has been the observation of infall motions (e.g. Belloche et al., 2002), which give direct evidence of accretion. Models of high mass cluster formation also predict a large scale contraction as the protocluster evolves and molecular gas is funneled from the outer regions of the core into the center of the cluster (Bonnell & Bate, 2002; Bonnell et al., 2004). But toward high-mass star-forming cores, the observational evidence of infall is still scarce (e.g. Wu & Evans, 2003).
Most studies rely on the observations of so-called “blue-skewed” line profiles: with a negative excitation gradient in a molecular clump, molecular lines with suitable optical depths (e.g. low rotational lines of HCO+) will show a central self-absorption dip whose blue peak is stronger than the red peak. But there are many pitfalls in the interpretation of this signature (see discussion in Evans, 2003). Especially at distances (few kpc) typical of MSF sites, other kinematical properties such as rotation and outflow activity might easily be mistaken for infall. Furthermore, abundance variations in the clumps can change the self-absorption profile tremendously. Still, this method led to evidence for infalling envelopes of a quite a few of hot cores (Wyrowski et al., 2006).
Alternatively, absorption lines toward compact and strong continuum sources can be observed. In particular, centimeter ammonia inversion lines have been successfully detected in absorption toward bright UCHIIRs, e.g. by Sollins et al. (2005) in G10.6-0.4. They derive gas velocities consistent with material spiraling toward the central newly-formed stars. Similar results have been reported by Zhang & Ho (1997) in the W51 massive star-forming region (see their Fig. 6), and by Beltrán et al. (2006) toward G24.78+0.08. These results strongly indicate the presence of infall, as predicted by the accretion models. But this method is restricted to a fairly late state of MSF when an UCHII has already developed and can be used as a background source.
At THz frequencies new opportunities arise now: Their high dust column densities make MSF clumps very bright far-infrared (FIR) continuum sources, especially in their early stages. Therefore, molecular lines with lower excitation than the (background) continuum temperature will be in absorption and will probe the kinematics of the clump on the line of sight toward the deeply embedded forming massive clusters. This signature is then a much more direct probe of infall and can be used through all embedded stages of MSF.
Of particular interest is the ammonia molecule which has been extensively studied, mostly via its centimeter inversion lines, and proven to be one of the best-known interstellar “thermometers” (Ho & Townes, 1983; Maret et al., 2009). In the THz range rotational transitions of ammonia can now be observed, in particular transitions from non-metastable to metastable levels, which will have low excitation temperatures and therefore are likely to be observed in absorption. In addition, ammonia is known to be one of the molecules that is the least likely to freeze out in the earliest, coldest stages of molecular clumps (e.g. Bergin & Langer, 1997).
We therefore present here a first small survey of sources in a range of evolutionary stages that we observed with the Stratospheric Observatory for Infrared Astronomy (SOFIA) in ammonia to measure their infall signatures. This observational evidence of accretion in the clumps harboring the forming massive (proto) clusters is essential for our understanding of the MSF process.
| Source | Stage | R.A.(J2000) | Decl.(J2000) | Lbol | S(870m)a | |||
|---|---|---|---|---|---|---|---|---|
| ( h m s ) | ( ∘ ′ ′′ ) | () | (kpc) | (mJy/bm) | (K) | (min.) | ||
| W43-MM1 | MIR-quiet core | 18 47 47.0 | 01 54 28 | b | 5.5b | 21.2 | 3700 | 13 |
| G31.41+0.31 | hot core | 18 47 34.3 | 01 12 46 | c | 7.9c | 21.2 | 3500 | 6.8 |
| G34.26+0.15 | UC HII | 18 53 18.6 | +01 14 58 | c | 3.7c | 44.7 | 3500 | 2.5 |
2 Observations and data reduction
We used the GREAT111GREAT is a development by the MPI für Radioastronomie and the KOSMA/Universität zu Köln, in cooperation with the MPI für Sonnensystemforschung and the DLR Institut für Planetenforschung. instrument (Heyminck et al., 2012, this volume) onboard SOFIA to observe the NH3 line at 1810.379971 GHz (taken from the JPL line catalog, Pickett et al., 1998). This line has the same lower level as the well-studied centimeter inversion line at 23.7 GHz of the ()=(2,2) level, hence we know that this level is sufficiently populated to give rise to strong absorption signatures.
To reach this frequency, a slight technical change was necessary: the modularity of GREAT allows the implementation of new technical opportunities between flights. A spare local oscillator (LO) source for the high-frequency channel allowed tuning to slightly lower than advertised frequencies (1810 instead of 1820 GHz with the nominal LO). With this setup, the line became accessible, but only if tuned into the lower sideband of the receiver. GREAT operates in double sideband mode and parts of the image sideband then cover a region of very low transmission, which led to uncertainties in the determination of the (weak) continuum level. The lower frequency channel was tuned to the CO (13–12) line at 1496.922909 GHz and was in turn used, at much better transmission, to determine the THz continuum flux of the sources.
The beam sizes at the observing frequencies are 20 and 16 arcsec, respectively. The three sources given in Table 1 were observed on 2011 July 20 at an altitude ranging from 39000 to 43000 feet.
The system temperatures during the observations and integration times are given in Table 1. As backends, MPIfR fast Fourier transform spectrometers (Klein et al., 2012) were used to cover a bandwidth of 1.5 GHz for each channel with a velocity resolution of 0.03 km/s, which was later lowered to 1 km/s to increase the signal-to-noise ratio in the spectra. The wobbling secondary was chopped with a throw of about the cross elevation axis in a symmetric mode. The pointing was monitored with the fiber optic gyroscopes. Spectra were calibrated to a scale and then the conversion to was made assuming a forward efficiency of 0.95 and beam efficiencies of 0.54 and 0.51 for the lower and higher frequency receivers, respectively.
In addition, complementary ground-based spectra of the C17O (3–2) and HNC (4–3) were obtained with the APEX telescope.
Final processing and analysis of the data was then performed using the CLASS program within the GILDAS software 222http://www.iram.fr/IRAMFR/GILDAS.
3 Results
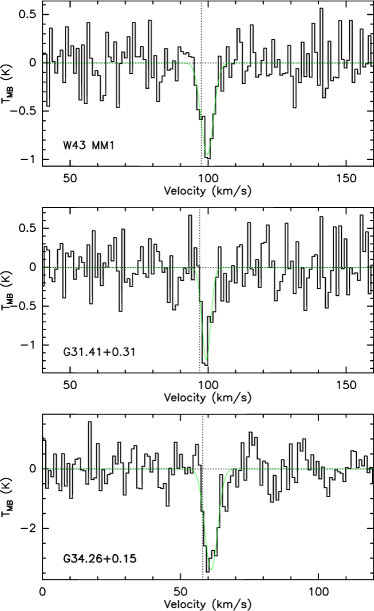
The averaged and baseline-subtracted spectra are shown in Fig. 1. Ammonia absorption lines were detected in all three sources. The line parameters from Gaussian fits are given in Table 2. Compared with C17O (3–2) line velocities, which as optically thin emission lines probe the systemic velocities of the sources with a comparable resolution of , all ammonia absorption lines are redshifted. This is consistent with blue-skewed emission profiles observed in HNC (4–3) toward these clumps with the APEX telescope. The fact that we observe absorption lines is not surprising: compared to the microwave inversion lines, the FIR rotational lines have Einstein A values about five magnitudes higher, hence they will decay rapidly from the non-metastable (JK) into the metastable (J=K) levels, which in turn only decay slowly via collisions (Ho & Townes, 1983). Thus, the metastable levels are “overpopulated” compared with the non-metastable ones.
Because we were unable to measure the 1.8 THz continuum reliably owing to the double sideband reception and the low atmospheric transmission in part of the image band, the 1.5 THz continuum was used to estimate the continuum level at the frequency. Table 3 gives the 1.5 THz continuum level, which was divided by 2 to correct for the single sideband calibration that by default is applied to the lines. The modeling of the clumps described in the next section suggests that the real 1.8 THz continuum might be up to 20% higher. The optical depths of the absorption can then be estimated from the line-to-continuum ratio as using the temperatures from Table 2 and 3. Optical depths on the order of unity are found meaning that the filling factor of the absorbing material in front of the dust continuum must be very high.
The total column density of the absorbing can then be computed from (e.g. Comito et al., 2003),
| (1) |
This equation is valid for excitation temperatures much lower than the continuum temperature and also much lower than the ’transition temperature’ ( K for this transition), which likely is the case given the rapid radiative decay of the non-metastable upper level. The transition probability of s-1 leads to a critical density for the transition of . and are the statistical weights of the lower and upper levels, respectively. Both inversion levels have almost the same population for densities above , hence the total column density in the (2,2) levels is twice as high. This leads to column densities of as given in Table 3.
| Source | ||||
|---|---|---|---|---|
| (K) | (km s-1) | (km s-1) | (km s-1) | |
| W43-MM1 | –0.96 (0.22) | 5.3 (0.8) | 99.7 (0.4) | 97.65 (0.06) |
| G31.41+0.31 | –1.18 (0.29) | 3.7 (0.8) | 99.4 (0.4) | 97.02 (0.04) |
| G34.26+0.15 | –3.38 (0.56) | 5.5 (0.6) | 61.2 (0.3) | 58.12 (0.03) |
| Source | |||
|---|---|---|---|
| (K) | () | ||
| W43-MM1 | 1.5 | 1.0 | 1.2 |
| G31.41+0.31 | 1.3 | 2.4 | 2.0 |
| G34.26+0.15 | 5.5 | 1.0 | 1.2 |
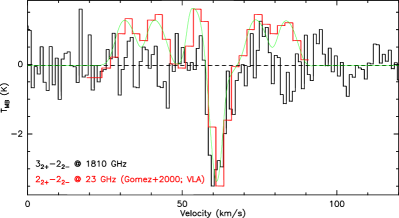
In Figure 2 we show a comparison of the (2,2) inversion line seen with the VLA (Keto et al., 1987; Gómez et al., 2000) with the SOFIA results. This inversion line shares the same lower level with the line observed by SOFIA. The velocity and width of the two absorption lines agree very well. Interestingly, the VLA spectrum shows the (2,2) line’s outer hyperfine structure components in emission. This can be understood when the absorbing continuum is only filling the beam partly and the absorption spectrum is blended with an additional high optical depth emission component from the hot core that is situated offset from the continuum.
4 Analysis
To model the observed absorption lines, we used the physical structures determined by Rolffs et al. (2011): they fitted the continuum structure of MSF clumps as observed in the ATLASGAL survey (Schuller et al., 2009) with density power laws for our observed sources) and determined temperature structures dictated by the inner heating sources. The velocity structure was assumed to be a fixed fraction of the free-fall velocities and adjusted using RATRAN (Hogerheijde & van der Tak, 2000) to fit high-density molecular probes observed with the APEX telescope. We compared the predicted 1.5 THz continuum of the models with the observed ones. G31.41 was fitted well with dust of Ossenkopf & Henning (1994) using their models with coagulation at cm-3 but no ice mantles. For G34.26 we adjusted the grain properties to dust with thin mantles that have a higher spectral index to reproduce the high observed continuum temperature. W43-MM1 was not modeled by Rolffs et al. (2011). For this source we scaled the G31.41 model to match the observed 1.5 THz continuum flux.
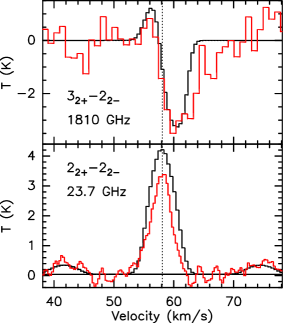
In the next step we adjusted the ammonia abundance () and the velocity to fit the SOFIA absorption lines with the RATRAN code. While in principle the clumps could have an increased hot core abundance in the inner K region, this hot core component to the spectrum is negligible because of its small filling factor. To fit the velocity, we adjusted the turbulence widths of the gas and the free-fall fraction in , where is the mass inside (cf. Rolffs et al., 2011). An example fit is shown in Fig. 3 for G34.26+0.15 together with a fit of the model to the (2,2) inversion line observed by Churchwell et al. (1990). In the model, the velocity was adjusted to 30% of the free-fall velocity and an ammonia abundance of . The Doppler -parameter was adjusted to km s-1. In the SOFIA spectrum, there is even evidence for additional excess redshifted absorption, not fit by the model, albeit only with low signal-to-noise ratio. The optically thick main cm-inversion line is somewhat overpredicted, whereas the outer hyperfine satellites are reproduced quite well. High infall velocities in the innermost part of the model do not contribute to the observed line profile, since the filling factor of the hot core region is too low. W43-MM1 and G31.41 could be fitted with velocity fields with 20% free-fall contribution.
5 Discussion and conclusions
From the observed and modeled velocity fields the infall rate of the clumps can be determined. From the RATRAN models, was determined from the model density and velocity at the radius corresponding to the SOFIA beam size. Alternatively, Eq. 4 from Beltrán et al. (2006) can be used with the observed column density and infall velocity. Both approaches agree and lead to infall rates between M⊙ yr-1. These rates are high enough to quench any HII region (Walmsley, 1995) and to overcome the radiation pressure from the forming (proto) cluster, although we only probed the infall at the outer envelope. In the inner part accretion might already be halted. From the absorption, we also only probed the infall on the line-of-sight, hence it might not be spherical.
In summary, we present the first velocity-resolved ammonia spectra from a rotational transition at THz frequency toward MSF clumps. Absorption of a comparable line at 1764 GHz was also recently observed with Herschel in the low-mass source IRAS16293-2422 (Hily-Blant et al., 2010). In G34.26 the redshifted absorption agrees with cm absorption observed with the VLA toward the UCHII component B (Heaton et al., 1989). This component is within the SOFIA beam but the strong absorption we detected implies that the absorption fills most of the dust continuum, which peaks toward the hot molecular core. G31.41 and W43-MM1 do not have compact cm continuum that might be used for absorption studies at cm wavelengths, hence our observations are first detections of redshifted absorption in these sources and demonstrate that ammonia absorption in front of strong dust continuum can be successfully used to probe infall in a variety of evolutionary stages of MSF clumps.
Acknowledgements.
Based [in part] on observations made with the NASA/DLR Stratospheric Observatory for Infrared Astronomy. SOFIA Science Mission Operations are conducted jointly by the Universities Space Research Association, Inc., under NASA contract NAS2-97001, and the Deutsches SOFIA Institut under DLR contract 50 OK 0901.References
- Belloche et al. (2002) Belloche, A., André, P., Despois, D., & Blinder, S. 2002, A&A, 393, 927
- Beltrán et al. (2006) Beltrán, M. T., Cesaroni, R., Codella, C., et al. 2006, Nature, 443, 427
- Bergin & Langer (1997) Bergin, E. A. & Langer, W. D. 1997, ApJ, 486, 316
- Beuther et al. (2002) Beuther, H., Schilke, P., Menten, K. M., et al. 2002, ApJ, 566, 945
- Bonnell & Bate (2002) Bonnell, I. A. & Bate, M. R. 2002, MNRAS, 336, 659
- Bonnell et al. (2004) Bonnell, I. A., Vine, S. G., & Bate, M. R. 2004, MNRAS, 349, 735
- Churchwell et al. (1990) Churchwell, E., Walmsley, C. M., & Cesaroni, R. 1990, A&AS, 83, 119
- Comito et al. (2003) Comito, C., Schilke, P., Gerin, M., et al. 2003, A&A, 402, 635
- Evans (2003) Evans, II, N. 2003, in SFChem 2002: Chemistry as a Diagnostic of Star Formation, ed. C. L. Curry & M. Fich, 157–+
- Gómez et al. (2000) Gómez, Y., Rodríguez-Rico, C. A., Rodríguez, L. F., & Garay, G. 2000, Rev. Mexicana Astron. Astrofis., 36, 161
- Heaton et al. (1989) Heaton, B. D., Little, L. T., & Bishop, I. S. 1989, A&A, 213, 148
- Heyminck et al. (2012) Heyminck, S., Graf, U., Güsten, R., et al. 2012, this volume
- Hily-Blant et al. (2010) Hily-Blant, P., Maret, S., Bacmann, A., et al. 2010, A&A, 521, L52+
- Ho & Townes (1983) Ho, P. T. P. & Townes, C. H. 1983, ARA&A, 21, 239
- Hoare (2005) Hoare, M. G. 2005, Ap&SS, 295, 203
- Hogerheijde & van der Tak (2000) Hogerheijde, M. R. & van der Tak, F. F. S. 2000, A&A, 362, 697
- Keto et al. (1987) Keto, E. R., Ho, P. T. P., & Reid, M. J. 1987, ApJ, 323, L117
- Klein et al. (2012) Klein, B., Hochgürtel, S., Krämer, I., Bell, A., & Meyer, K. Güsten, R. 2012, this volume
- Kurtz et al. (2000) Kurtz, S., Cesaroni, R., Churchwell, E., Hofner, P., & Walmsley, C. M. 2000, Protostars and Planets IV, 299
- Maret et al. (2009) Maret, S., Faure, A., Scifoni, E., & Wiesenfeld, L. 2009, MNRAS, 399, 425
- Menten et al. (2005) Menten, K. M., Pillai, T., & Wyrowski, F. 2005, in IAU Symposium, Vol. 227, Massive Star Birth: A Crossroads of Astrophysics, ed. R. Cesaroni, M. Felli, E. Churchwell, & M. Walmsley, 23–34
- Motte et al. (2003) Motte, F., Schilke, P., & Lis, D. C. 2003, ApJ, 582, 277
- Ossenkopf & Henning (1994) Ossenkopf, V. & Henning, T. 1994, A&A, 291, 943
- Pickett et al. (1998) Pickett, H., Poynter, R. L., Cohen, E. A., et al. 1998, J. Quant. Spec. Radiat. Transf., 60, 883
- Rolffs et al. (2011) Rolffs, R., Schilke, P., Wyrowski, F., et al. 2011, A&A, 527, A68+
- Schuller et al. (2009) Schuller, F., Menten, K. M., Contreras, Y., et al. 2009, A&A, 504, 415
- Sollins et al. (2005) Sollins, P. K., Zhang, Q., Keto, E., & Ho, P. T. P. 2005, ApJ, 624, L49
- Walmsley (1995) Walmsley, M. 1995, in Revista Mexicana de Astronomia y Astrofisica, vol. 27, Vol. 1, Revista Mexicana de Astronomia y Astrofisica Conference Series, ed. S. Lizano & J. M. Torrelles, 137
- Wu & Evans (2003) Wu, J. & Evans, II, N. J. 2003, ApJ, 592, L79
- Wyrowski et al. (2006) Wyrowski, F., Heyminck, S., Güsten, R., & Menten, K. M. 2006, A&A, 454, L95
- Zhang & Ho (1997) Zhang, Q. & Ho, P. T. P. 1997, ApJ, 488, 241