The Dynamics and Metallicity Distribution of the Distant Dwarf Galaxy VV124**affiliation: The data presented herein were obtained at the W. M. Keck Observatory, which is operated as a scientific partnership among the California Institute of Technology, the University of California and the National Aeronautics and Space Administration. The Observatory was made possible by the generous financial support of the W. M. Keck Foundation.
Abstract
VV124 (UGC 4879) is an isolated, dwarf irregular/dwarf spheroidal (dIrr/dSph) transition-type galaxy at a distance of 1.36 Mpc. Previous low-resolution spectroscopy yielded inconsistent radial velocities for different components of the galaxy, and photometry hinted at the presence of a stellar disk. In order to quantify the stellar dynamics, we observed individual red giants in VV124 with the Keck/DEIMOS spectrograph. We validated members based on their positions in the color-magnitude diagram, radial velocities, and spectral features. Our sample contains 67 members. The average radial velocity is km s-1, in agreement with the previous radio measurements of H I gas. The velocity distribution is Gaussian, indicating that VV124 is supported primarily by velocity dispersion inside a radius of 1.5 kpc. Outside that radius, our measurements provide only an upper limit of km s-1 on any rotation in the photometric disk-like feature. The velocity dispersion is km s-1, from which we inferred a mass of and a mass-to-light ratio of , both measured within the half-light radius. Thus, VV124 contains dark matter. We also measured the metallicity distribution from neutral iron lines. The average metallicity, , is consistent with the mass-metallicity relation defined by dwarf spheroidal galaxies. The dynamics and metallicity distribution of VV124 appear similar to dSphs of similar stellar mass.
Subject headings:
galaxies: individual (VV124) — galaxies: dwarf — Local Group — galaxies: kinematics and dynamics — galaxies: abundances1. Introduction
The dwarf galaxy VV124 is one of the “newest” members of the local universe. The discovery of VV124 was first published in the Vorontsov-Velyaminov (1959) Atlas and Catalog of Interacting Galaxies, though the galaxy does not have an interacting neighbor. The CfA galaxy redshift survey (Huchra et al., 1983) reported its redshift as km s-1. In the Hubble flow, this redshift corresponds to a distance of Mpc. At that distance, VV124 would have belonged to a group of three galaxies (Turner & Gott, 1976; Geller & Huchra, 1983). However, Kopylov et al. (2008) noticed resolved stars in Sloan Digital Sky Survey images (Adelman-McCarthy et al., 2007). Kopylov et al. imaged VV124 to a depth of , and they confirmed that it is in fact much nearer than 10 Mpc. They measured a distance of Mpc based on the tip of the red giant branch (TRGB). This new distance placed the galaxy on the periphery of the Local Group. Despite its proximity to the group, VV124 is extremely isolated. Its nearest neighbor, Leo A, is another isolated dwarf galaxy 700 kpc away (Jacobs et al., 2011).
The revision to VV124’s distance drastically affected its inferred star formation history. From low-resolution spectroscopy, James et al. (2004) measured its H star formation rate as , but that rate was based on a distance of 10.5 Mpc. Corrected to the true distance of 1.36 Mpc (Jacobs et al., 2011), the rate dropped to (a point also noted by Bellazzini et al., 2011a, hereafter B11a). The new distance also inspired deep photometry in addition to that obtained by Kopylov et al. (2008). B11a obtained wide-field photometry of VV124 at the Large Binocular Telescope (LBT) to study the structure of the galaxy in detail. Jacobs et al. (2011) obtained even deeper and photometry over a smaller field with the Hubble Space Telescope (HST) Advanced Camera for Surveys. They determined that of the stars are older than 10 Gyr. The rest are younger than 1 Gyr. Bellazzini et al. (2011b) used the same HST images as Jacobs et al. to show that the oldest, most metal-poor population is significantly more extended than the younger stars. The galaxy-averaged star formation rates that Jacobs et al. derived were over the last 0.5 Gyr and over the last 1 Gyr. Together, the HST photometry and H spectroscopy indicated that VV124 is a typically old dwarf galaxy that experienced a small burst of star formation Gyr ago.
Tikhonov et al. (2010) expanded Kopylov et al.’s (2008) study. They classified VV124 as transition-type galaxy, caught between being an dIrr and a dwarf spheroidal galaxy (dSph). They noticed that the young, blue stars lie in a thin, disk-like structure, whereas the older, red giants occupy a thicker configuration. However, the small number of very young stars was inconsistent with an irregular-only classification. Therefore, they concluded that VV124 is a rare dIrr/dSph galaxy. Grebel et al. (2003) listed only five other such members of the Local Group: Antlia, Aquarius, Phoenix, Pisces, and KKR 25. This class of galaxies is especially interesting because their existence supports the theory that dSphs are dIrrs that lost their gas through ram pressure stripping and tidal interactions with other galaxies (Mayer et al., 2001a, b, 2006, 2007). There is strong observational support for the removal of gas from dwarf galaxies in dense environments (e.g., Geha et al., 2006; Grcevich & Putman, 2009), and the similarity of the star formation histories except in the past Gyr of dIrrs, dSphs, and dIrr/dSphs further supports the transformation of dIrrs into dSphs (Weisz et al., 2011). Although there are counterexamples, such as the comparatively young Leo A dIrr (Cole et al., 2007), the star formation history of VV124 less recent than 1 Gyr appears much like other dIrrs and dSphs. Except for the recent burst, Jacobs et al. (2011) reported that almost all of its stars are ancient, like nearly all dSphs.
The dynamics of VV124 have been unclear. Despite the corrected redshift, measurements of the galaxy’s radial velocity have been inconsistent. Kopylov et al. (2008) and Tikhonov et al. (2010) obtained low-resolution spectroscopy of individual stars, resolved H II regions, diffuse stellar light, and diffuse emission. The velocities varied widely, but they seemed to cluster around km s-1. B11a measured the H I velocity structure with the Westerbork Synthesis Radio Telescope. They measured a heliocentric radial velocity of km s-1 with a dispersion of km s-1 and a full range of about to 0 km s-1. B11a also measured the velocities of a blue supergiant and a young star cluster, but the cluster velocity was inconsistent with (more negative than) the H I velocity by . So far, the discrepancy between the velocities of the neutral gas and younger populations has not been resolved.
B11a also observed what appears to be a stellar disk. VV124 is elongated (, ), but its shape cannot be described by a single ellipsoid. There is an even more elongated component whose major axis is aligned with the main spheroid. The second component, which B11a called “wings,” resembles a stellar disk, which should rotate coherently, unlike the spheroid. As an alternative, B11a also proposed that the wings might be tidal tails instead of a disk. However, VV124’s extreme isolation makes strong tidal interaction unlikely.
In order to provide closure to the discrepancies in velocity measurements and to test for rotation, we observed red giants in VV124 with the Deep Extragalactic Imaging Multi-Object Spectrograph (DEIMOS, Faber et al., 2003) on the Keck II telescope. The median velocity uncertainty of the individual stellar measurements is 4.1 km s-1, which is small enough to test for the presence of dark matter. The spectra are also of sufficient quality to measure metallicities from neutral iron lines. The median uncertainty in metallicity is 0.23 dex. This article presents the results of our dynamics and metallicity studies.
2. Observations and Reductions
2.1. Target selection
Targets were selected from B11a’s photometric catalog. DEIMOS slitlets cannot overlap in the dispersion direction, and the VV124 field is dense enough that we needed to prioritize the targets for placement on the DEIMOS slitmasks. The targets were prioritized by magnitude and physical location with respect to the center of VV124. Brighter targets were preferred for higher signal-to-noise ratios (SNRs). We defined as the distance along the major axis and as distance along the minor axis. This is the same nomenclature introduced by B11a.
We used the dsimulator111http://www.ucolick.org/$∼$phillips/deimos_ref/masks.html program to select targets for placement on DEIMOS slitmasks. The program maximizes the number of high-priority targets within user-defined constraints. We required slitlets to be at least 4” long and separated by 0.35” for adequate sky subtraction. Slit widths were 0.7”, a choice that balanced observing efficiency with spectral resolution, which corresponds to precision in the radial velocity and metallicity measurements.
We prioritized targets for spectroscopy in the following order:
-
1.
Brighter red giant branch (RGB) candidates near the major axis ( and )
-
2.
Fainter RGB candidates near the major axis ( and )
-
3.
Bright, blue non-RGB stars near the major axis (, , and )
-
4.
RGB candidates away from the major axis ()
-
5.
Any other non-RGB candidates
RGB candidates are defined as and .
One pair of slitmasks comprised our observations. The slitmasks, subtending roughly , were roughly centered on the galaxy at position angles of and (i.e., rotated ). The target lists for the two slitmasks were almost identical. This ensured that we had two independent measurements of the radial velocities for almost all of the stars. The target list included 131 unique targets, of which 106 were included on both slitmasks.
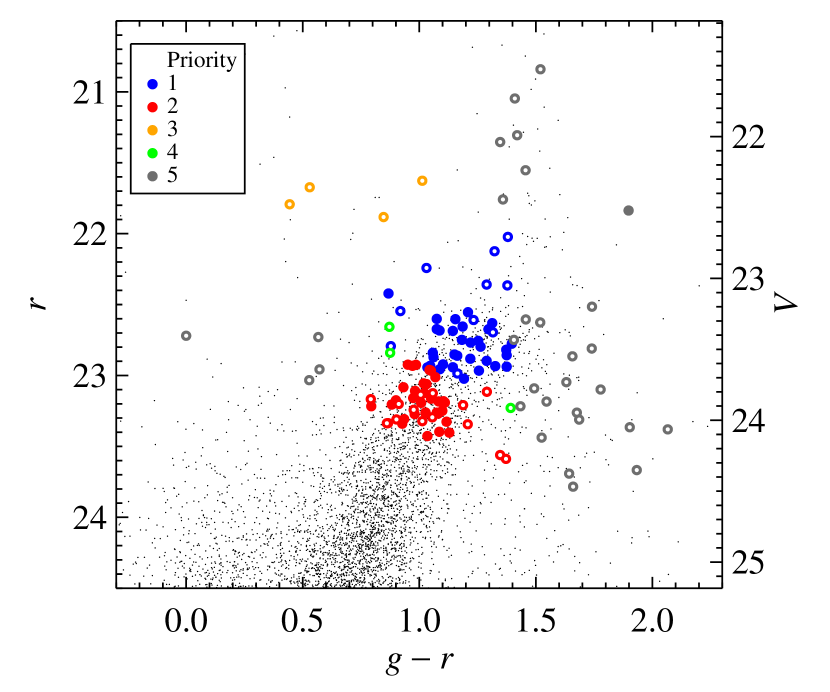
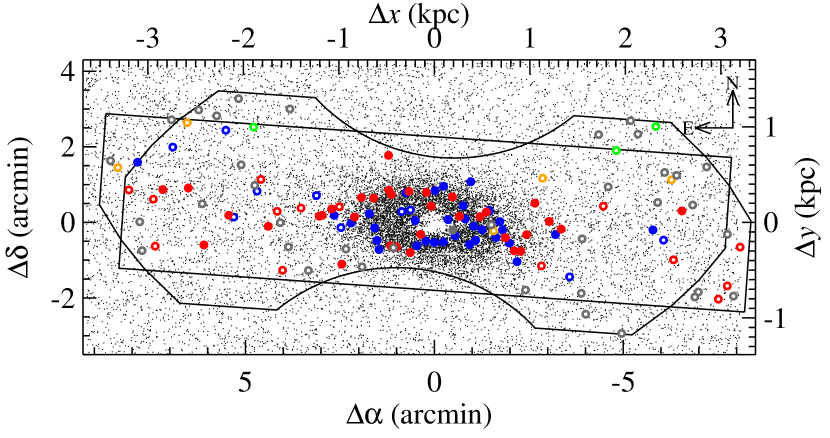
Figure 1 shows the color-magnitude diagram (CMD) for VV124. Spectroscopic targets are identified by colored points. Filled points indicate spectroscopically confirmed member stars (see Section 4). The colors correspond to the priorities in the list above. Figure 2 shows the coordinates of the stars with the same color coding.
2.2. Observations
| Mask | Seeing (”) | Targets | Members | Total Exp. Time (s) | Individual Exp. Times (s) |
|---|---|---|---|---|---|
| vv124a | 0.57–0.87 | 121 | 61 | 13200 | , |
| vv124b | 0.55–0.65 | 120 | 64 | 13600 | , 1600, 1200 |
We observed the two slitmasks, called vv124a and vv124b, on 2011 January 30 (UT). Table 1 lists the exposure times, seeing, number of targets, and number of VV124 members for each slitmask. The following night was also allocated to this project, but high humidity and fog on that night prevented any observing of VV124.
We used the 1200 lines mm-1 grating centered at 7800 Å. This grating, combined with the slit widths of 0.7”, yielded a line spread profile with a FWHM of 1.2 Å. The resolving power is about near the Ca II triplet (CaT) at 8500 Å. We obtained a 1 sec exposure of internal Ne, Ar, Kr, and Xe arc lamps for wavelength calibration and three 12 sec exposures of an internal quartz lamp for flat fielding. Although DEIMOS is mounted on the Nasmyth platform of Keck II, it rotates to track the sky. An active flexure compensation system maintains stability to within 0.2 pixels, corresponding to 3 m on the focal plane, which is equivalent to 0.02” in the spatial direction and to 0.07 Å in the dispersion direction.
Individual exposure times for the VV124 slitmasks ranged from 20 to 30 minutes. Most of the exposures were 30 minutes. We checked the alignment of the slitmask about once per hour by placing the grating in zeroth order. In this direct imaging mode, bright alignment stars aligned with 4” boxes in the slitmask. We measured the seeing by fitting Gaussian profiles to the point spread functions of the alignment stars. Seeing remained low and stable for the entire night (see Table 1).
2.3. Reductions
We reduced the raw images into one-dimensional spectra with the spec2d222http://deep.berkeley.edu/spec2d/ software developed by the Deep Extragalactic Evolutionary Probe 2 team (DEEP2, Davis et al., 2003). The software excised the footprint of each spectrally dispersed slitlet from each exposure of the flat field, arc lamps, and science targets. Because the DEIMOS focal plane is curved, the program rectified the slitlet images by tracing and straightening both the edges of the flat field and the roughly orthogonal arc lines. Then, the program generated a flat field image from the three exposures of the quartz lamp. This flat field was used to remove the slit response function, dust, and cosmetic imperfections in the science images. The spec2d software also fitted a fifth-order Legendre polynomial in wavelength to the pixel positions of arc lines. For each exposure of each slitlet, spec2d computed the sky emission as a function of wavelength and subtracted it from the two-dimensional spectrum. All of the science exposures for each slitmask were averaged with inverse variance weighting and cosmic ray rejection. Finally, the object spectrum was extracted with optimal weighting (Horne, 1986). The final result was a clean, one-dimensional spectrum, wavelength-calibrated to a precision of 0.01 Å. The spectrum was not flux calibrated, and it did not need to be for our purposes.
Some spectra suffered from artifacts or such low SNR that measurement of the radial velocity was not possible. There were 13 such spectra. They are included and identified in Table The Dynamics and Metallicity Distribution of the Distant Dwarf Galaxy VV124**affiliation: The data presented herein were obtained at the W. M. Keck Observatory, which is operated as a scientific partnership among the California Institute of Technology, the University of California and the National Aeronautics and Space Administration. The Observatory was made possible by the generous financial support of the W. M. Keck Foundation., but we do not consider them further.
The spec2d software also computed the error spectrum from Poisson statistics of the raw frame. The errors were adjusted appropriately during flat fielding, and the one-dimensional error spectrum was extracted identically to the flux spectrum. We used the error spectra for estimation of uncertainties in radial velocities (Section 3) and metallicities (Section 6).
As mentioned in Section 2.1, the two slitmasks included 106 duplicate targets. We measured the precision of our velocity measurements using the independently measured radial velocities from the two slitmasks. However, for the final list of radial velocities, we used a combined spectrum. We summed the two one-dimensional spectra for each duplicate object with inverse variance weighting.
We removed telluric absorption using archived DEIMOS spectra of hot stars. We used the same hot star spectra and spectral division procedure as Kirby et al. (2008). However, our science exposures took place over an entire night. The varying airmass and water vapor made it impossible to remove the telluric absorption accurately. Regions of moderately strong telluric absorption were not considered for metallicity measurements.
The metallicity measurements discussed in Section 6 required normalization of the spectral continuum. We followed the continuum normalization procedure described by Kirby et al. (2009, their Section 3.4). After normalization, we calculated the SNR of each spectrum. First, we computed the median absolute deviation (m.a.d.) from the continuum of pixels in “continuum regions” (defined by Kirby et al., 2008) in the rest wavelength ranges 7400–7500 Å, 7750–8100 Å, and 8400–8900 Å. These selections excluded most telluric absorption and TiO bands. Then, we removed all pixels that exceeded five times the m.a.d. and re-calculated the m.a.d. with this slightly trimmed set of pixels. The result was the SNR per pixel. To convert to SNR per Å, we multiplied by , where 0.33 is the pixel scale in Å per pixel. This measurement of SNR is sensitive to inaccuracies in the continuum placement, which will artificially decrease the SNR. However, errors in continuum placement dominate the SNR calculation only at , which is much higher than any member star in our sample.
3. Radial Velocity Measurements
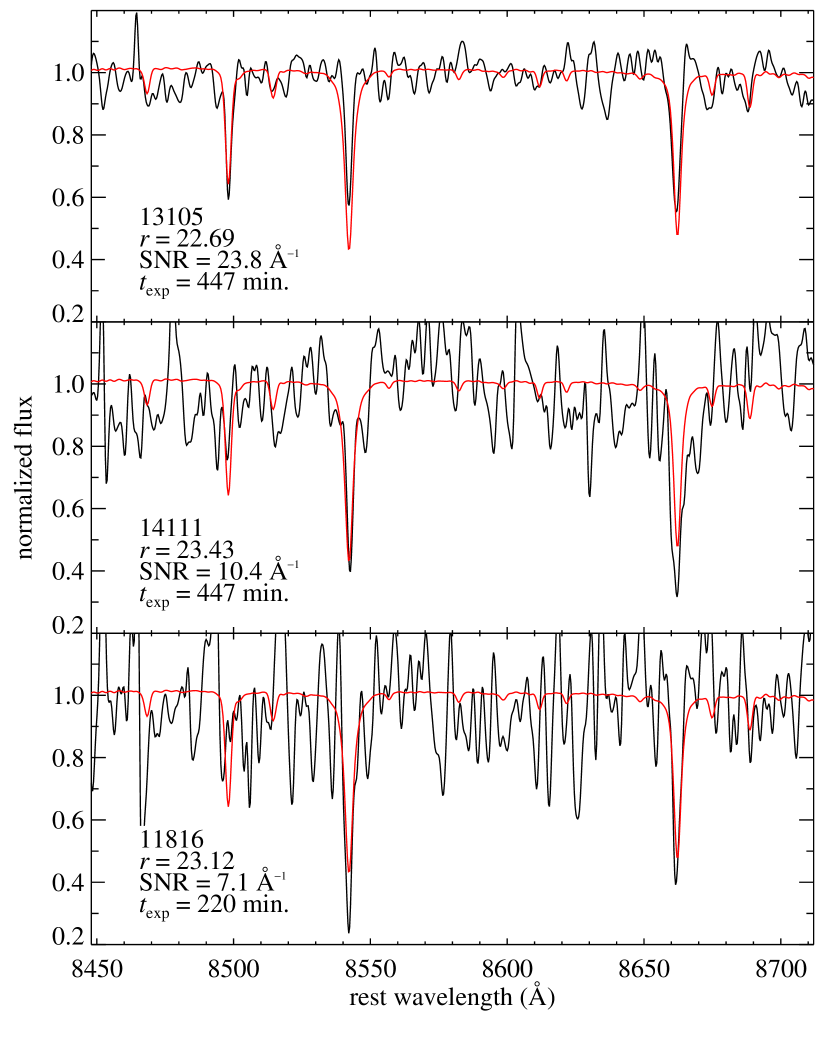
We measured radial velocities and their uncertainties following the procedure of Simon & Geha (2007). First, we measured the radial velocity of the star by cross-correlating the observed spectrum with a library of template stars and galaxies observed with DEIMOS. The template spectra were the same as those used by Simon & Geha. They were observed with a nearly identical configuration of DEIMOS and therefore have the same resolution as our science spectra. The strong atmospheric A and B bands (7588–7700 Å and 6862–6950 Å) were excluded from the cross-correlation. Three weaker telluric bands (7167–7315 Å, 8210–8325 Å, and 8900–9200 Å) were given weights of 10% of other pixels in the cross-correlation. We adopted the velocity corresponding to the cross-correlation peak of the template with the lowest when compared to the observed spectrum. We call this velocity . Figure 3 shows typical spectra of VV124 member stars along with the best-fitting template spectra.
Next, we computed a correction for mis-centering of the star in the slitlet (Sohn et al., 2007). For this step, we used the observed spectrum before correction for telluric absorption. We cross-correlated this spectrum with the spectrum of HR 1641, a hot, rapidly rotating star. Only regions subject to significant telluric absorption (the same regions used by Simon & Geha, 2007) were considered in the cross-correlation. We call the velocity obtained from this cross-correlation . The radial velocity of the star is , where is the heliocentric velocity correction appropriate for Keck Observatory on the observation date.
We estimated uncertainties in by Monte Carlo resampling of the spectra. For each of 1000 realizations, we added Gaussian random noise to the spectrum. The dispersion of the Gaussian probability distribution at each pixel was equal to the estimated Poisson error of that pixel. Then, we recomputed and for each realization. For computational efficiency, we considered only the template spectrum that best matched the original spectrum. The standard deviation of the 1000 measurements of is .


From duplicate measurements of the same stars, Simon & Geha realized that was an incomplete estimate of the radial velocity uncertainty. In order to explain the dispersion among the repeat measurements, they added a systematic error term, , in quadrature with . The systematic term was chosen such that the radial velocity differences divided by their total uncertainties were distributed normally with unit standard deviation.
| (1) |
Because we observed 106 duplicate objects on both DEIMOS slitmasks, we also calculated a systematic error term. We excluded galaxies, obvious foreground dwarfs with Na I 8190 absorption, and other objects failing any membership criterion other than radial velocity (see Section 4). From the 57 remaining stars, we computed km s-1—which is the same value that Simon & Geha derived—by solving Equation 1. Figure 4 shows the distribution of differences in repeat measurements divided by their estimated uncertainties. The width of the distribution matches a unit Gaussian because was tuned to force such a match.
Figure 5 shows how velocity errors and uncertainties trend with SNR. The differences between repeat measurements (top panel) are based on exposures from one slitmask only. Therefore, their SNRs are about of the SNR of the stacked spectra used for remainder of our analysis. The estimated uncertainties (bottom panel) decrease with increasing SNR, as expected. Only the random error term, , decreases with SNR. The systematic error term, , is constant.
4. Membership
We used several criteria for determining membership. First, we eliminated stars based on their positions in the CMD. Then, we eliminated stars with spectral features not found in red giants. Finally, we eliminated stars based on their radial velocities.
4.1. Color-Magnitude Diagram
B11a identified the extinction-corrected magnitude of the TRGB as . In selecting spectroscopic targets, we prioritized stars with , which conservatively allowed for large error in the TRGB magnitude. It also allowed some asymptotic giant branch (AGB) stars. In order to fill the slitmasks, we also included some targets with .
Stars brighter than the TRGB are not likely members. We carefully examined all stars with ( brighter than the TRGB). After excluding stars failing to meet the membership criteria in the following sections, four stars remained. Star 8116 showed broad CaT lines. The width and shape suggested pressure broadening typical of dwarf stars. Therefore, we ruled 8116 as a non-member. The spectrum of star 8445 looked in all respects like a red giant. Although the star is slightly brighter and bluer than the TRGB, we kept 8445 in the member list under the premise that it is an AGB star. The spectrum of star 11163 showed very strong cyanogen bands. If this carbon star is an AGB member of VV124, it could be significantly brighter and redder than the TRGB. In fact, that is its location in the CMD. For this reason, we kept 11163 in the membership list. Finally, star 13649 is solidly in the “wall” of foreground dwarfs in the CMD, and its Na I 8190 equivalent width (EW) is very close to the cut-off for membership (see the next section). We ruled 13649 a foreground dwarf for the combination of its position in the CMD and moderately strong Na I 8190 doublet.
4.2. Spectral Features
Inspection of the DEIMOS spectra revealed that many of our targets were background galaxies or foreground dwarf stars. First, we excluded all objects with emission lines or broad, redshifted Ca H and Ca K in absorption. These 20 objects are background galaxies.
Second, we excluded stars with very strong, broad Na I 8190 doublets. The strengths of these lines are especially sensitive to surface gravity. That sensitivity makes them excellent discriminators between giants and foreground dwarf stars (Spinrad & Taylor, 1971; Cohen, 1978; Schiavon et al., 1997; Gilbert et al., 2006). We measured the EWs of each of the two lines in the doublet by fitting two independent Gaussians. We computed Monte Carlo uncertainties by resampling the spectrum 100 times. For each pixel in each resample, we added noise from a Gaussian random distribution with a standard deviation equal to the estimated Poisson noise of that pixel. We fitted Gaussians to each resample, and we adopted the standard deviation among their EWs as the error on the EW. Table The Dynamics and Metallicity Distribution of the Distant Dwarf Galaxy VV124**affiliation: The data presented herein were obtained at the W. M. Keck Observatory, which is operated as a scientific partnership among the California Institute of Technology, the University of California and the National Aeronautics and Space Administration. The Observatory was made possible by the generous financial support of the W. M. Keck Foundation. gives the summed EWs and their uncertainties for stars where the doublet was measurable above the noise.

We computed a threshold value for the summed EW of the doublet by looking up EWs in a grid of non-local thermodynamic equilibrium (NLTE) Na abundances (Lind et al., 2011). We sampled EWs from to and to . We found the appropriate effective temperature for each combination of surface gravity and abundance (assuming ) from a 10 Gyr Yonsei-Yale isochrone (Demarque et al., 2004). Interpolations in the NLTE grid yielded Figure 6. Some points are missing from the figure because they are also missing from the NLTE grid. Regardless, it is clear that the doublet increases sharply in EW for dwarf stars with . The summed EW of the doublet exceeds 1 Å for stars with only at surface gravities . We identified 17 stars with a summed Na I 8190 EW greater than 1 Å. These 17 stars are foreground dwarfs.
Counting star 8116, excluded for its broad calcium lines and for being brighter than the TRGB, we eliminated 38 objects based on spectral features. Another three stars showed strong CN bands. One of these, 11163, is discussed in Section 4.1. The other two stars, 9378 and 13043, pass all membership criteria, and we retained them as members.
4.3. Radial Velocities

The median radial velocity uncertainty in our sample of member stars is km s-1, on the order of the velocity dispersion of a small dSph. Therefore, it is important to consider velocity errors carefully when computing the velocity dispersion. Walker et al. (2006) devised a formalism to take these errors into account. The procedure involved maximizing the likelihood that the average radial velocity, , and the intrinsic velocity dispersion, , accurately describe the observed velocity distribution of candidate member stars in the presence of observational error. The process was iterative. We chose km s-1 and km s-1 as rough guesses for the first iteration. In each subsequent iteration, only stars within (99% of a normal distribution) of were considered. In fact, just one iteration was required to converge on the final member sample and the final values of and . The uncertainties on and were determined from the likelihood covariance matrix. Table 5 gives the fiducial values for and and their uncertainties.
We used and to determine the final membership cut. If a normal distribution is a good description of the velocity distribution, then the velocity range includes 99% of the members. This cut excluded 6 stars and retained 67 members. Some galaxy dynamics studies suggest that a cut of is a better choice. Adopting a cut for VV124 would not have affected the membership of any star.
Table The Dynamics and Metallicity Distribution of the Distant Dwarf Galaxy VV124**affiliation: The data presented herein were obtained at the W. M. Keck Observatory, which is operated as a scientific partnership among the California Institute of Technology, the University of California and the National Aeronautics and Space Administration. The Observatory was made possible by the generous financial support of the W. M. Keck Foundation. lists all of the spectroscopic targets. The table gives astrometric and photometric data, as well as quantities derived from the spectra. The last two columns of the table indicate whether the object is a member star and the reasons that stars were considered non-members.
Figure 7 presents the velocity distribution of VV124. The velocities are distributed normally. The skewness, a measure of asymmetry, of the distribution is . The kurtosis, a measure of the deviation from Gaussianity, is . Both parameters are consistent with zero, indicating conformance to a normal distribution. The vertical, dashed lines show , and the solid curve shows a perfect normal distribution (not a fit) for those parameters, normalized to the number of member stars.
5. Dynamics
| Property | Symbol | Value |
|---|---|---|
| Photometry | ||
| DistanceaaNumber of DEIMOS masks on which the object was observed. | Mpc | |
| LuminositybbReasons for non-membership. : Inappropriate radial velocity. Na: Spectrum shows strong Na I 8190 doublet. G: Spectrum shows emission lines or redshifted Ca H and K lines, indicating that the object is a galaxy. Bright: Target is brighter than the TRGB. Bad: Spectral quality was insufficient for radial velocity measurement. | ||
| Stellar massccAlthough B11a assumed , we assumed that , a value more typical of transition-type dwarfs (Woo et al., 2008). We used this stellar mass-to-light ratio to calculate these quantities. The value could range from 0.8 to 1.5, and we took these limits into account in the estimation of the uncertainties. | ||
| Gas massbbReasons for non-membership. : Inappropriate radial velocity. Na: Spectrum shows strong Na I 8190 doublet. G: Spectrum shows emission lines or redshifted Ca H and K lines, indicating that the object is a galaxy. Bright: Target is brighter than the TRGB. Bad: Spectral quality was insufficient for radial velocity measurement. | ||
| Half-light radiusbbReasons for non-membership. : Inappropriate radial velocity. Na: Spectrum shows strong Na I 8190 doublet. G: Spectrum shows emission lines or redshifted Ca H and K lines, indicating that the object is a galaxy. Bright: Target is brighter than the TRGB. Bad: Spectral quality was insufficient for radial velocity measurement. | pc | |
| Dynamics | ||
| Mean radial velocity | km s-1 | |
| Line-of-sight velocity dispersion | km s-1 | |
| Mass within half-light radiusddUsing the formula (Wolf et al., 2010). | ||
| Mass-to-light ratio within half-light radiusddUsing the formula (Wolf et al., 2010). | ||
| Dynamical-to-stellar mass ratio within half-light radiusc,dc,dfootnotemark: | ||
| Total masseeUsing the formula (Illingworth, 1976), which may not be appropriate for VV124. This formula often gives smaller than the formula for . | ||
| Total mass-to-light ratioeeUsing the formula (Illingworth, 1976), which may not be appropriate for VV124. This formula often gives smaller than the formula for . | ||
| Metallicity | ||
| Mean metallicityffAlthough Kirby et al. (2011a) calculated with inverse variance weighting, we present the unweighted mean. The low SNRs of many of our spectra cause the error on [Fe/H] to increase strongly with decreasing metallicity. Therefore, the weighted mean would be biased toward high [Fe/H]. | ||
| Standard deviation | ||
| Median metallicity | med([Fe/H]) | |
| Median absolute deviation | mad([Fe/H]) | |
| Interquartile range | IQR([Fe/H]) | |
| Skewness | Skew([Fe/H]) | |
| Kurtosis | Kurt([Fe/H]) | |
| Yield (Simple Model) | (Simple) | |
| Yield (Pre-Enriched Model) | (Pre-Enriched) | |
| Initial metallicity (Pre-Enriched Model) | ||
| Yield (Extra Gas Model) | (Extra Gas) | |
| Extra Gas Parameter (Extra Gas Model) | ||
5.1. Mean Radial Velocity and Velocity Dispersion
The mean radial velocity, km s-1, agrees with the radial velocity of the H I gas, km s-1 (B11a). The agreement is especially reassuring because previous optical measurements of radial velocities showed significantly more negative . Kopylov et al. (2008) and Tikhonov et al. (2010) observed two blue supergiants: bl1 with km s-1 and bl2 with km s-1. They also estimated the average radial velocity of unresolved stellar light to be km s-1. Radial velocities of resolved and diffuse H II gas, measured from the [O III] 5007 emission line, ranged from to km s-1. B11a revised the velocity of the supergiant bl2 to km s-1. They also observed a star cluster, C1, with km s-1 and diffuse H emission with km s-1. The individual sources bl1, C1, and one of the H II regions have radial velocities more than inconsistent with our velocity cuts for membership. The stellar integrated light measurement of by Kopylov et al. and Tikhonov et al. is discrepant from our measurement. In every case, the discrepancies are such that the other measurements are more negative than ours. We are confident that our measurement of is accurate because it agrees with the H I measurement. Moreover, our estimate is based on higher-resolution spectra and a much larger sample than Kopylov et al. (2008), Tikhonov et al. (2010), and B11a.
There are two possible causes of the discrepancy. First, there could have been some systematic error in the measurements of from the low-resolution spectra of Kopylov et al. and Tikhonov et al. The upward revision of for bl2 by B11a may support this conclusion. On the other hand, B11a also measured a very negative for the star cluster C1. We also note that we excluded three stars with as non-members because their velocities are too negative. These velocities are similar to those of bl1 and C1. It may also be relevant that the H I gas southeast of the center of the galaxy has more negative than the gas in the central regions (B11a). Thus, VV124 may have a non-equilibrium dynamical component consisting of a young stars and star-forming regions. This component would have more negative than the old red giants and neutral gas. The data available do not point to a definitive conclusion. Higher resolution observations of bl1, C1, other young stars, and star-forming regions will better define VV124’s velocity structure.
Unresolved binaries could inflate the velocity dispersion. Minor et al. (2010) concluded that this inflation is unlikely to be more than 30% in galaxies with . In a separate study, McConnachie & Côté (2010) arrived at a similar conclusion, but cautioned that even a modest binary fraction could cause an ultra-faint dSph-sized stellar population free of dark matter to appear to have the velocity dispersion of a dark matter-dominated system. In a confirmation of the contribution of unresolved binaries to mass estimates of dSphs, Koposov et al. (2011) revised the velocity dispersion of the Boötes I dSph from km s-1 (Muñoz et al., 2006; Martin et al., 2007) to two components: one population at 2.4 km s-1 and a smaller population at km s-1. Most of this revision was due to a more precise estimation of velocity uncertainties, but removing binaries did contribute to the reduction in .
We did not obtain multi-epoch spectroscopy for VV124. Therefore, we were unable to remove the contribution of unresolved binaries. We suggest that the binary contribution to for VV124 is not nearly as large as for Boötes I or other ultra-faint dSphs. The warnings about the inflation of velocity dispersion by Minor et al. (2010), McConnachie & Côté (2010), and Koposov et al. (2011) specifically concerned the ultra-faint dSphs with very low luminosities (). VV124 does not fall into this class. Olszewski et al. (1996) showed that unresolved binaries inflate for the Ursa Minor and Draco dSphs by much less than 1 km s-1. Because the velocity dispersion of VV124 is closer to the dispersions of Ursa Minor and Draco than to ultra-faint dSphs, binarity likely does not dominate our measurement uncertainty.
5.2. Rotation
While B11a concluded that the H I gas in VV124 does not show any signature of rotation, the interpretation of the stellar wings as an edge-on disk of stars prompted us to search for stellar rotation. If the structure is a disk, it is nearly edge-on, and rotation in principle should be evident in measurements of stellar radial velocities.
VV124 also contains H I gas that has a velocity gradient of 5–10 km s-1 across the face of the galaxy and a full velocity range of km s-1. However, the gradient is not aligned with the disk-like structure. B11a suggested that the gradient arises not from rotation, but asymmetric stellar winds acting preferentially on the southeast quadrant of the galaxy.
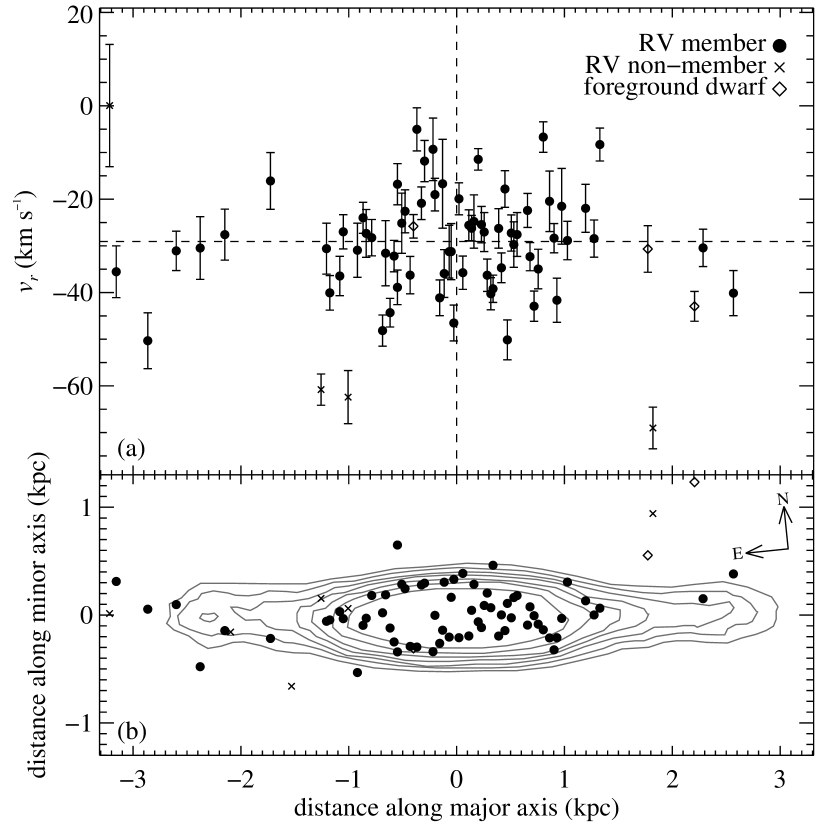
Based on B11a’s Figure 11 and our Figure 8, we define the “wings” of VV124 as (1.6 kpc) , where is distance along the major axis. Our sample includes eight such member stars. Therefore, we have spectroscopically confirmed the existence of the photometrically feeble disk-like structure discovered by B11a.
However, these stars show no evidence of rotation within the limitations of our measurements. Figure 8 shows stellar radial velocities versus distance from the minor axis. We quantified the amount of rotation as , the difference between the average in the eastern and western wings. Our sample contains six members in the eastern wing and two members in the western wing. The velocity measurements of these stars yielded km s-1.
In order to assess the precision of this measurement, we constructed theoretical rotation curves for the outermost regions of the galaxy. The curves were flat in the wings (), and their magnitudes ranged from 0 to 20 km s-1, spaced at 1 km s-1. We sampled the theoretical rotation curves with eight fake stars at the same distances along the major axis as the stars in our sample. Each fake star had a radial velocity perturbed from the rotation curve, and the amount of perturbation was sampled from a Gaussian random probability distribution with a standard deviation equal to the estimated uncertainty in for the corresponding observed star. Under the assumption that any rotation would be diluted by incoherent velocity dispersion, we further perturbed each star’s velocity according to a Gaussian random distribution with a standard deviation of , the previously measured line-of-sight velocity dispersion of VV124. We computed for 1000 such Monte Carlo trials for each of the rotation curves. The standard deviation of the probability distributions is an estimate of the uncertainty on the observed value of km s-1. This uncertainty, km s-1, is insensitive to the magnitude of the rotation.
Our measurements are consistent with the absence of rotation because is consistent with zero. However, our data set is limited in its ability to detect rotation. Under the assumption that the velocity dispersion is constant with radius and that this velocity dispersion dilutes any rotation signal in the wings, the minimum rotation signal we could have detected is km s-1.
The stars in the southeast of the galaxy do not have any more negative than stars elsewhere. Therefore, our observations do not show a stellar counterpart to the asymmetric gas velocity. Radial velocity measurements of bluer, younger stars might show such structure, but we have not performed such observations.
Our observations are not conclusive evidence against rotation or a stellar counterpart to the H I velocity structure. Furthermore, we may have misclassified some foreground stars as members. Such misclassifications may alter a rotation signal. We considered the possibility that some true members may have been misclassified as foreground dwarfs based on the strength of their Na I 8190 doublets (hollow diamonds in Figure 8), but the radial velocities of those stars do not suggest rotation or velocity structure any more than the spectroscopic members. We cannot rule out the possibility that a larger sample with more precise measurements of will detect velocity structure in the stars.
5.3. Mass
The mass of a spheroidal stellar system can be determined from its line-of-sight velocity dispersion under the assumption of a mass profile and velocity anisotropy. In the case of VV124, only stars and dark matter significantly affect . Gas is irrelevant because the gas mass is just a small fraction of the stellar mass. Illingworth (1976) presented a formula to measure the mass of globular clusters: , where is the King (1962) core radius and 333King (1966) and Illingworth (1976) called this parameter . Mateo (1998) and Simon & Geha (2007) called it . Because is typically used to represent velocity dispersion anisotropy, we have chosen to call the concentration parameter . is a dimensionless number that quantifies the mass concentration toward the system’s center. The core radius may be approximated in relation to , the half-light or effective radius, as follows: . Mateo (1998) stated that is appropriate for low-concentration King profiles and therefore appropriate for most dwarf galaxies. However, Illingworth’s (1976) formula assumes that mass follows light and that the velocity dispersion anisotropy . These two assumptions are appropriate for globular clusters but not for dark matter-dominated galaxies. Wolf et al. (2010) presented an alternative formula for the mass enclosed within the half-light radius: , where is the half-light or effective radius. It is at this radius that has the least influence on the estimate of the enclosed mass. Inside and beyond , the enclosed mass becomes increasingly uncertain because is unknown when only line-of-sight velocities are known. Table 5 gives both from the Illingworth (1976) formula and from the Wolf et al. (2010) formula. As is typical for dwarf galaxies, actually exceeds because the Illingworth (1976) formula is inappropriate for dwarf galaxies. Note that both of these formulae assume sphericity. The ellipticity of VV124 (, B11a) diminishes the accuracy of these mass estimators for VV124.
The mass-to-light ratio within the half-light radius is . This value is too large for a mass dominated by stars alone. According to up-to-date stellar models (Percival et al., 2009), old (12 Gyr) and metal-poor (, which is about the mean metallicity for VV124, as derived in Section 6) stellar populations without dark matter exhibit . Due to the contribution of the young population, the expected value for VV124 should be lower. The ratio of the dynamical mass to the stellar mass within the half-light radius is . (This value depends inversely on the assumed stellar mass-to-light ratio, . See footnote c in Table 5.) Therefore, we conclude that the mass of VV124 is dominated by dark matter.
B11a roughly estimated the mass-to-light ratio () of VV124 from the H I velocity distribution. They assumed that the gravitational potential dominates the gas motion and that the H I distribution is spherical and isotropic. Their value is 1.5 times our measurement of . However, theirs was a rough estimate. The difference can be explained by their slightly larger measurement of 11 km s-1 for the velocity dispersion, compared to our measurement of km s-1. Our measurement is more accurate because it is based on individual stars. The gas velocity dispersion could be sensitive to stellar feedback, especially in light of Bellazzini et al.’s interpretation of stellar winds as the cause of the velocity gradient seen in the gas.
6. Metallicity Distribution


We measured iron abundances from Fe I lines in the DEIMOS spectra. Kirby et al. (2008, 2009, 2010) described the procedure that we used for these measurements. We corrected the photometry for extinction with Schlegel et al.’s (1998) dust maps. The average reddening was low (). After we converted the extinction-corrected apparent magnitudes to absolute magnitudes assuming (Jacobs et al., 2011), we used 12 Gyr Padova isochrones (Girardi et al., 2002) to estimate the photometric effective temperature and surface gravity of each star. A large grid of synthetic spectra was searched for the best-fitting synthetic spectrum. In the search, temperature and [Fe/H] were varied. The temperature was assigned a probability distribution based on the uncertainty in the star’s position in the CMD. This probability distribution was included in the minimization to find the best-fitting synthetic spectrum. In this way, the spectroscopic temperature was not allowed to stray far from the photometric temperature. (See Sections 4.5 and 4.7 of Kirby et al. 2009 for more details.) The photometry and the spectroscopy shared roughly equal weight in determining the final temperature. The photometry alone determined the surface gravity.
In previous works based on this technique, the uncertainty in [Fe/H] () was calculated in part from the covariance matrix in the Levenberg-Marquardt optimization. Various diagnostics indicated that this random uncertainty term underestimated the full error in the measurement. Therefore, a systematic error term, , was added in quadrature to the random uncertainty. That term was calculated from spectra with a typical exposure time of one-hour. The exposure time for most spectra in this work exceeds seven hours. Therefore, errors in sky subtraction play a much larger role than in our previous works.
Because the spectral noise behavior assumes a different character than in the spectra from which the systematic error term was originally calculated, we re-evaluated the magnitude of using only the VV124 data set. In analogy to our calculation of radial velocity uncertainties, we examined differences in [Fe/H] between measurements of the same stars on the two separate slitmasks. We determined from the following equation.
| (2) |
In other words, is the value required to force agreement between the repeat measurements of [Fe/H]. Figure 9 shows that this agreement was achieved.
Figure 10 shows the relationship between the error or uncertainty on metallicity versus spectral SNR. The top panel shows the differences in [Fe/H] measured from the two different slitmasks. These measurements are different by up to 0.8 dex because most of them (those observed on both slitmasks) are based on partial exposures with low SNRs. The bottom panel shows the estimated uncertainty on metallicity versus SNR. These estimates are based on the full exposures (coadded spectra from both slitmasks). Therefore, the bottom panel shows larger SNRs than the top panel. The trend of error with SNR is weaker than for radial velocities (Figure 5) because for radial velocities was calculated with Monte Carlo resampling of the observed spectra. Monte Carlo resampling was computationally prohibitive for estimating uncertainties on [Fe/H]. As a result, we relied in part on instead of for estimating the uncertainty on [Fe/H]. This quantity comes from the covariance matrix, which tends to underestimate uncertainty compared to Monte Carlo techniques. Therefore, accounts for the majority of the uncertainty in most stars, and the resulting error distribution shows only a weak trend with SNR.
In the following discussion, we have assumed that the solar iron abundance is (Sneden et al., 1992). Also, we discarded metallicity measurements with uncertainties larger than 0.5 dex.

Another popular method of measuring metallicities of red giants from low- to medium-resolution spectra is the empirical relation between [Fe/H] and the EW of the CaT. In order to compare CaT metallicities to our synthetic spectral metallicities, we measured the EWs of the CaT lines at 8542 Å and 8662 Å. We fitted Lorentzian functions to each of the CaT lines. We estimated uncertainties on EWs by Monte Carlo resampling. We added Gaussian random noise to each spectrum in proportion to its error spectrum. The amount of noise added to each pixel was sampled from a Gaussian random distribution with a standard deviation equal to that pixel’s estimated Poisson noise. We took the error on EW as the standard deviation of 100 such realizations. Then, we applied Starkenburg et al.’s (2010) calibration between CaT EW, absolute magnitude, and [Fe/H]. This calibration was based on a combination of Gaussian fits and numerical integration in order to include the pressure-broadened wings of the CaT. As a rough substitute, we used the Lorentzian, which is a good approximation to both the cores and the wings of the CaT lines. We transformed extinction-corrected and magnitudes to Cousins magnitudes using Jordi et al.’s (2006) equations. We computed errors on by propagating the errors on EW and . We did not include the uncertainty in the metallicity calibration because it is significantly less than the substantial errors in EW. Figure 11 shows the comparison between [Fe/H] measured from the CaT and from spectral synthesis for the stars where it was possible to measure Lorentzian fits confidently. Although the measurement uncertainties are large, the agreement is good. This comparison reinforces credibility in our metallicity measurements based on Fe I lines. For the rest of this discussion, we used synthetic metallicities instead of the CaT metallicities because the synthetic metallicities are more precise for two reasons. First, the synthetic metallicities do not require a conversion between photometric systems. Second, Fe I lines in the DEIMOS spectrum of a typical moderately metal-poor red giant have more signal (sum of EWs) than the combined CaT.
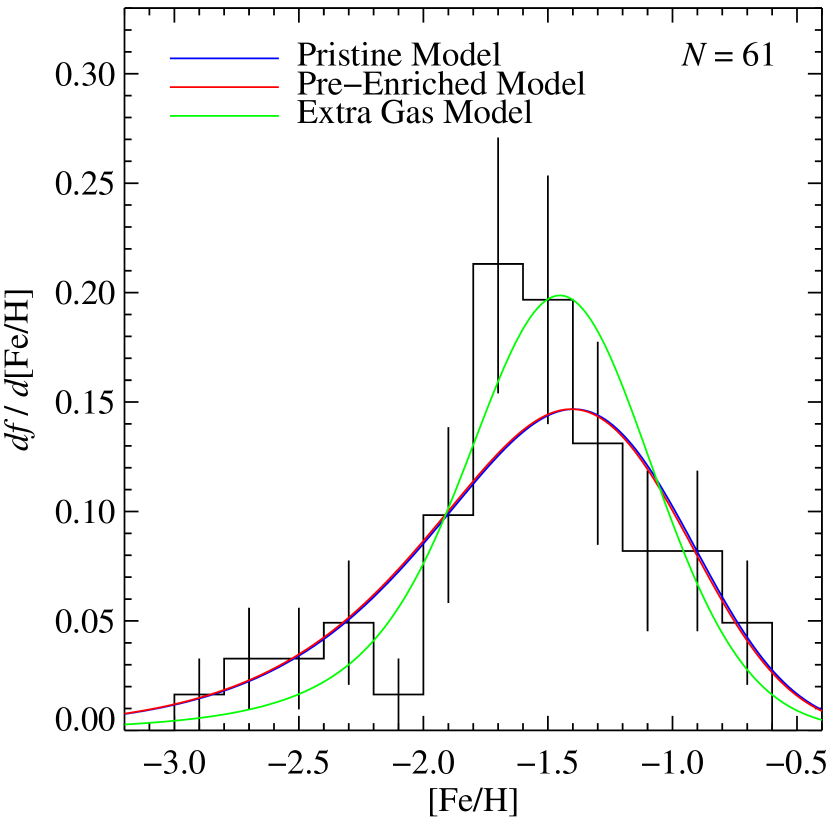
Figure 12 shows the metallicity distribution of member stars. The metallicities range from to . The shape of the distribution (a peak with a longer metal-poor tail than a metal-rich one) is typical of dwarf galaxies of VV124’s stellar mass (Kirby et al., 2011a). The bottom of Table 5 lists some additional shape characteristics of the metallicity distribution.
We measured a mean metallicity of . This number agrees with previous photometric estimates: (Kopylov et al., 2008; Tikhonov et al., 2010), (Jacobs et al., 2011), (in the outskirts, B11a), and (in the region , where is the elliptical radius, Bellazzini et al., 2011b). The metallicities measured by Jacobs et al. (2011) and Bellazzini et al. (2011a, b) are consistent because Jacobs et al. measured [M/H] whereas Bellazzini et al. measured [Fe/H]. Jacobs et al. (2011) and Bellazzini et al. (2011a, b) also noted that the great majority of old RGB stars have .
Kirby et al. (2011a) fitted three analytic chemical evolution models to the metallicity distributions of eight dSph satellites of the Milky Way. The Simple Model is also known as a Closed Box (Talbot & Arnett, 1971). Its single parameter is the effective yield, . Low effective yield indicates that the galaxy lost metals. Hence, we prefer the name “Simple Model” to “Closed Box.” The Pre-Enriched Model (Pagel, 1997) is the Simple Model with the additional parameter , which is the initial metallicity of the gas. The Extra Gas Model (Lynden-Bell, 1975) allows for gas to fall into the galaxy during star formation. The infall rate is specifically chosen to allow for an analytic solution to the metallicity distribution. The parameter quantifies the amount of infalling gas. The Extra Gas Model reduces to the Simple Model in the limit .
We fitted the same models with the same maximum likelihood estimation procedure as Kirby et al. (2011a). The colored curves in Figure 12 show the results. The curves for the Simple and Pre-Enriched Models nearly overlap because the Pre-Enriched Model reduces to the Simple Model in the limit that . The maximum likelihood estimation could not constrain a lower bound to . Hence, the metallicity distribution is consistent with initially metal-free gas. The metallicity distribution is more peaked than the Simple Model. The Extra Gas Model roughly accounts for this peak. In fact, the Extra Gas Model is times more likely to describe the metallicity distribution than the Simple Model. Metallicity distributions consistent with gas inflow are typical for dSphs with the stellar mass of VV124 (Kirby et al., 2011a).
The low metallicity and highly sub-solar effective yields () require that VV124 lost some of its metals (see Kirby et al., 2011b), possibly in the form of supernova winds. B11a also noted the role of gas flows into and out of VV124. The H I gas distribution is asymmetric and suggestive of gas flowing to or from the southeast of the galaxy’s star-forming center. The densest concentration of gas is also offset to the southeast, further supporting the bulk motion of gas along that direction. While the present gas motions did not affect the past star formation that made the bulk of the RGB, the radio observations do support the role of gas flows in shaping the stellar population of VV124.
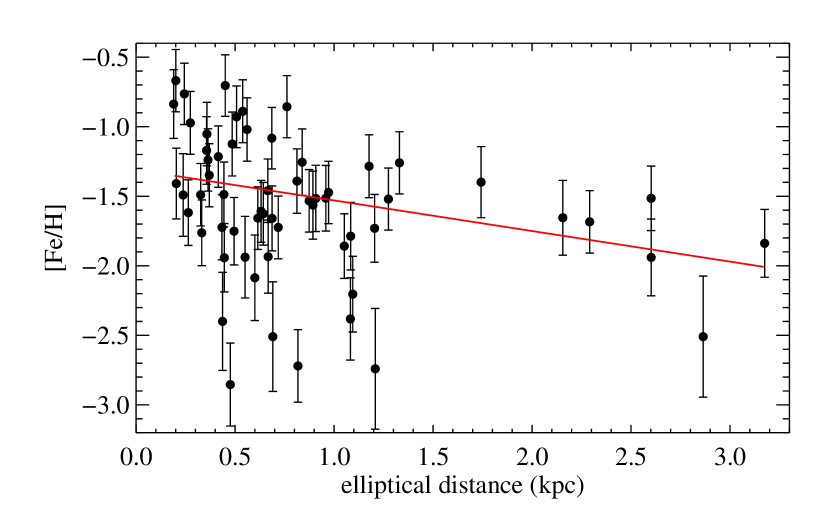
Radial metallicity gradients are typical of many galaxies, and many dwarf galaxies are no exception (e.g., Tolstoy et al., 2004; Battaglia et al., 2006; Koch et al., 2006; Spolaor et al., 2009; Koleva et al., 2009a, b; Kirby et al., 2011a). If gradients exist, they are always negative in the sense that metallicity decreases with increasing radius. Photometry strongly indicated that the stars near the center of VV124 are younger and more metal-rich (Tikhonov et al., 2010; Jacobs et al., 2011; Bellazzini et al., 2011b). We confirmed a gradient of . Figure 13 shows the radial distribution of [Fe/H] along with an illustration of the gradient. Radial gradients can arise by several mechanisms. The most plausible explanation is that metallicity increased with time as supernovae enriched the interstellar medium with iron. Star formation also became more centrally concentrated because gas loss (due to supernova winds, for example) preferentially expelled gas from the outer reaches of the galaxy. Therefore, the radial gradient arose because successive generations of stars became simultaneously more metal-rich and more centrally concentrated.
7. Discussion and Conclusions
Since its recent relocation to the edge of the Local Group, the dwarf galaxy VV124 has received considerable scrutiny. However, measurements of its radial velocity have been inconsistent. The galaxy also seemed to possess a disk of stars. We observed VV124 with Keck/DEIMOS, and we determined that its radial velocity agrees with H I measurements. The stellar velocities we measured show no evidence of a disk rotating any faster than km s-1, but larger samples will be necessary to place stricter limits on rotation.
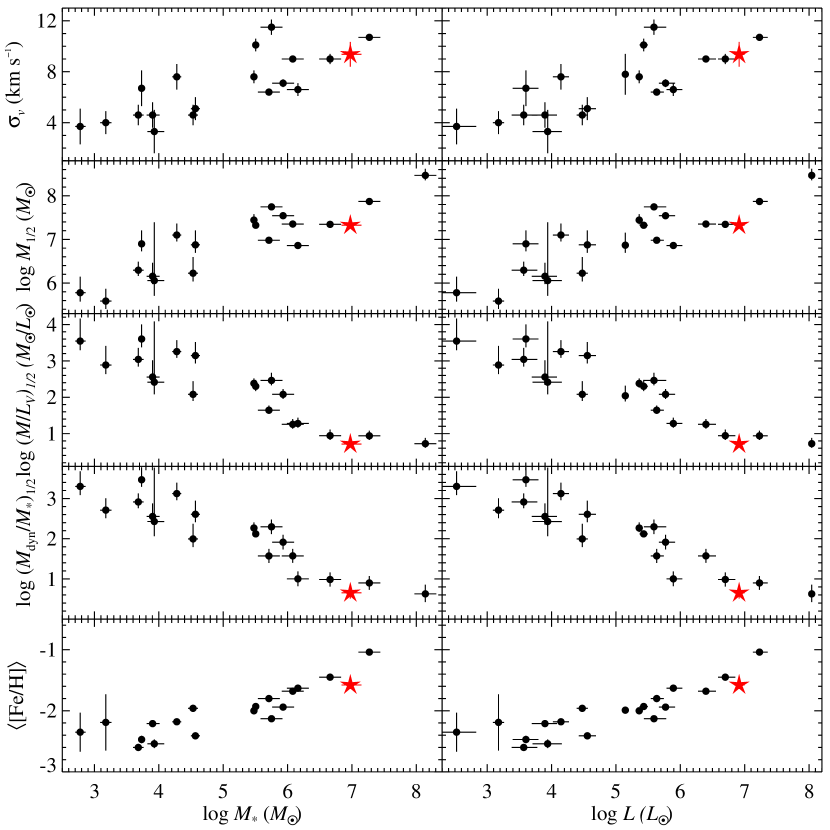
We gave an estimate of the dynamical mass of VV124 and determined that the mass of its stars alone does not account for the velocity dispersion. Therefore, VV124 contains dark matter. Its mass-to-light ratio agrees with dSphs of similar stellar mass. The metallicity distribution is also similar to dSphs of similar stellar mass. The average metallicity, metallicity dispersion, and shape of the distribution are nearly indistinguishable from dSphs like Leo I or Fornax. As is typical for large dSphs, the metallicity distribution fits a chemical evolution model with infalling gas better than a Closed Box Model.
The parameters we derived from new spectroscopy suggest that VV124 is a dIrr far along on its transformation into a dSph. Figure 14 shows that VV124 lies along the same trends defined by other dSphs and dwarf elliptical galaxies in the Local Group. Thus, the galaxy is an excellent test case for models that posit that dIrrs evolve into dSphs by the removal of gas and randomization of stellar velocities. This process may happen in isolation or in the vicinity of a much larger galaxy, such as the Milky Way.
The transformation of a dIrr into a dSph might proceed without the benefit of a dense environment. For example, VV124 in its present form could have resulted from a merger of two dwarf galaxies Gyr ago (D’Onghia et al., 2009; Kazantzidis et al., 2011b). The merger would have disrupted a disk and possibly triggered the starburst that Jacobs et al. (2011) observed. Recent simulations showed that ultraviolet background radiation and stellar feedback are sufficient to expel all of the gas from a dwarf galaxy (Sawala et al., 2010). The challenge in these models is the formation of disk-less dSphs. It is possible that VV124 could have formed as a dispersion-supported galaxy, but this scenario runs contrary to the view that dwarf galaxies formed as disks from which supernova feedback removed gas with low angular momentum (Governato et al., 2010). Another challenge is to explain the low gas fraction of VV124 relative to other isolated dwarf galaxies. In a sample of 39 dwarf galaxies with stellar masses from Woo et al. (2008) and gas masses from Grebel et al. (2003), the only galaxies with lower gas fractions than VV124 () are satellites of the Milky Way or M31, not isolated dwarfs like VV124.
The tidal stirring model (Mayer et al., 2001a, b) explains the transformation from dIrrs to dSphs in the context of galaxy environment. This model posits that disky dIrrs lose their gas through ram pressure stripping in a group environment. The stars then lose their rotational structure by tidal interactions. Numerous simulations address the transformation of dIrrs to dSphs by tidal stirring (e.g., Klimentowski et al., 2009a; Łokas et al., 2010, 2011; Kazantzidis et al., 2011a). The stated goal of most of these simulations is to construct a spheroid from a disk. As a result, few studies address the kind of morphology peculiar to VV124 (a spheroid with a very faint disk-like feature). Nonetheless, the intermediate stages of some tidal stirring simulations resemble a spheroid with a disk. The simulated tidally stirred dwarf galaxy in Figure 12 of Mayer et al. (2001b) is a decent representation of VV124, but the “disk” is actually tidal tails. Our radial velocity observations of stars in the wings of VV124 do not support their interpretation as a disk. Hence, they may be tidal tails. However, tidal tails near apocenter are expected to be elongated toward the perturber (Klimentowski et al., 2009b). The disk- or tail-like feature observed in VV124 must be nearly perpendicular to the Milky Way, and the great circle that connects VV124 and M31 intersects the major axis of VV124 at an angle of . Therefore, the elongated photometric features are unlikely to be tidal tails resulting from an interaction with either of the large spiral galaxies of the Local Group.
Furthermore, VV124 is in a remote corner of the Local Group, highly isolated from other galaxies. Karachentsev et al. (2009) concluded that VV124 resides outside the zero-velocity surface of the Local Group. Because its velocity relative to the Local Group’s barycenter is positive, it will never enter the group in the future. Additionally, B11a calculated that the intragroup medium around VV124 is probably not dense enough to remove gas by ram pressure stripping. As a result, tidal stirring would require that VV124 passed near another galaxy and subsequently traveled Mpc to its current position. Traveling such a large distance after a tidal interaction is not out of the question. A dwarf galaxy that passed within half of the virial radius of a massive halo could have traveled up to several virial radii beyond that massive halo (Lin et al., 2003; Ludlow et al., 2009; Teyssier et al., 2012). As many as 10% of all dark matter halos are actually ejected subhalos that can be found as far away as four virial radii from their former hosts (Wang et al., 2009). VV124 qualifies as a candidate subhalo ejected from either the Milky Way or M31. Its low velocity relative to the Local Group would require VV124 to be near its apocenter. Such a location would not be surprising given its large distance from the nearest massive halo. It also makes sense that we would observe an ejected subhalo near its apocenter because subhalos linger near their apocenters. As a potentially ejected satellite galaxy, VV124 could be an example of tidal stirring. In this scenario, a brief, high-speed passage near the Milky Way or M31 removed most of its gas, and the violent change in tidal force near pericenter disrupted its stellar disk. A single passage is sufficient for ram pressure stripping to remove most or all of the gas in a galaxy of VV124’s circular velocity (Mayer et al., 2006), but most simulations of tidal stirring require multiple pericentric passages to transform a disk into a spheroid (Kazantzidis et al., 2011a).
The tidal stirring explanation requires special circumstances. First, VV124 had to have been ejected from the Milky Way or M31, possibly in a multi-body encounter. Second, the stellar disk would have to be disrupted in just one pericentric passage, or VV124 would have had to acquire a large amount of orbital energy in a multi-body encounter on a subsequent pericentric passage. Third, the tidal tails—if indeed the photometric wings are tidal tails—would have to somehow point in a direction away from the former host galaxy.
While our observations support the interpretation of VV124 as a galaxy of a type between dIrr and dSph, they do not explain how it came to be that way. We look forward to future simulations that will manufacture a digital replica of VV124: an isolated, mostly spheroidal dwarf galaxy that somehow lost most of its gas but retained wispy, minimally rotating wings.
References
- Adelman-McCarthy et al. (2007) Adelman-McCarthy, J. K., Agüeros, M. A., Allam, S. S., et al. 2007, ApJS, 172, 634
- Battaglia et al. (2006) Battaglia, G., Tolstoy, E., Helmi, A., et al. 2006, A&A, 459, 423
- Bellazzini et al. (2011a) Bellazzini, M., Beccari, G., Oosterloo, T. A., et al. 2011a, A&A, 527, A58 (B11a)
- Bellazzini et al. (2011b) Bellazzini, M., Perina, S., Galleti, S., & Oosterloo, T. 2011b, A&A, 533, A37
- Cohen (1978) Cohen, J. G. 1978, ApJ, 221, 788
- Cole et al. (2007) Cole, A. A., Skillman, E. D., Tolstoy, E., et al. 2007, ApJ, 659, L17
- Davis et al. (2003) Davis, M., Faber, S. M., Newman, J., et al. 2003, Proc. SPIE, 4834, 161
- Demarque et al. (2004) Demarque, P., Woo, J.-H., Kim, Y.-C., & Yi, S. K. 2004, ApJS, 155, 667
- D’Onghia et al. (2009) D’Onghia, E., Besla, G., Cox, T. J., & Hernquist, L. 2009, Nature, 460, 605
- Faber et al. (2003) Faber, S. M., Phillips, A. C., Kibrick, R. I., et al. 2003, Proc. SPIE, 4841, 1657
- Geha et al. (2006) Geha, M., Blanton, M. R., Masjedi, M., & West, A. A. 2006, ApJ, 653, 240
- Geller & Huchra (1983) Geller, M. J., & Huchra, J. P. 1983, ApJS, 52, 61
- Gilbert et al. (2006) Gilbert, K. M., Guhathakurta, P., Kalirai, J. S., et al. 2006, ApJ, 652, 1188
- Girardi et al. (2002) Girardi, L., Bertelli, G., Bressan, A., et al. 2002, A&A, 391, 195
- Governato et al. (2010) Governato, F., Brook, C., Mayer, L., et al. 2010, Nature, 463, 203
- Grcevich & Putman (2009) Grcevich, J., & Putman, M. E. 2009, ApJ, 696, 385
- Grebel et al. (2003) Grebel, E. K., Gallagher, J. S., III, & Harbeck, D. 2003, AJ, 125, 1926
- Helmi et al. (2006) Helmi, A., Irwin, M. J., Tolstoy, E., et al. 2006, ApJ, 651, L121
- Horne (1986) Horne, K. 1986, PASP, 98, 609
- Huchra et al. (1983) Huchra, J., Davis, M., Latham, D., & Tonry, J. 1983, ApJS, 52, 89
- Illingworth (1976) Illingworth, G. 1976, ApJ, 204, 73
- Jacobs et al. (2011) Jacobs, B. A., Tully, R. B., Rizzi, L., et al. 2011, AJ, 141, 106
- James et al. (2004) James, P. A., Shane, N. S., Beckman, J. E., et al. 2004, A&A, 414, 23
- Jordi et al. (2006) Jordi, K., Grebel, E. K., & Ammon, K. 2006, A&A, 460, 339
- Karachentsev et al. (2009) Karachentsev, I. D., Kashibadze, O. G., Makarov, D. I., & Tully, R. B. 2009, MNRAS, 393, 1265
- Kazantzidis et al. (2011a) Kazantzidis, S., Łokas, E. L., Callegari, S., Mayer, L., & Moustakas, L. A. 2011a, ApJ, 726, 98
- Kazantzidis et al. (2011b) Kazantzidis, S., Łokas, E. L., Mayer, L., Knebe, A., & Klimentowski, J. 2011b, ApJ, 740, L24
- King (1962) King, I. R. 1962, AJ, 67, 471
- King (1966) King, I. R. 1966, AJ, 71, 64
- Kirby et al. (2009) Kirby, E. N., Guhathakurta, P., Bolte, M., Sneden, C., & Geha, M. C. 2009, ApJ, 705, 328
- Kirby et al. (2010) Kirby, E. N., Guhathakurta, P., Simon, J. D., et al. 2010, ApJS, 191, 352
- Kirby et al. (2008) Kirby, E. N., Guhathakurta, P., & Sneden, C. 2008, ApJ, 682, 1217
- Kirby et al. (2011a) Kirby, E. N., Lanfranchi, G. A., Simon, J. D., Cohen, J. G., & Guhathakurta, P. 2011a, ApJ, 727, 78
- Kirby et al. (2011b) Kirby, E. N., Martin, C. L., & Finlator, K. 2011b, ApJ, 742, L25
- Klimentowski et al. (2009a) Klimentowski, J., Łokas, E. L., Kazantzidis, S., Mayer, L., & Mamon, G. A. 2009a, MNRAS, 397, 2015
- Klimentowski et al. (2009b) Klimentowski, J., Łokas, E. L., Kazantzidis, S., et al. 2009b, MNRAS, 400, 2162
- Koch et al. (2006) Koch, A., Grebel, E. K., Wyse, R. F. G., et al. 2006, AJ, 131, 895
- Koleva et al. (2009a) Koleva, M., de Rijcke, S., Prugniel, P., Zeilinger, W. W., & Michielsen, D. 2009a, MNRAS, 396, 2133
- Koleva et al. (2009b) Koleva, M., Prugniel, P., De Rijcke, S., Zeilinger, W. W., & Michielsen, D. 2009b, Astron. Nachr., 330, 960
- Koposov et al. (2011) Koposov, S. E., Gilmore, G., Walker, M. G., et al. 2011, ApJ, 736, 146
- Kopylov et al. (2008) Kopylov, A. I., Tikhonov, N. A., Fabrika, S., Drozdovsky, I., & Valeev, A. F. 2008, MNRAS, 387, L45
- Kroupa et al. (1993) Kroupa, P., Tout, C. A., & Gilmore, G. 1993, MNRAS, 262, 545
- Lin et al. (2003) Lin, W. P., Jing, Y. P., & Lin, L. 2003, MNRAS, 344, 1327
- Lind et al. (2011) Lind, K., Asplund, M., Barklem, P. S., & Belyaev, A. K. 2011, A&A, 528, A103
- Łokas et al. (2010) Łokas, E. L., Kazantzidis, S., Klimentowski, J., Mayer, L., & Callegari, S. 2010, ApJ, 708, 1032
- Łokas et al. (2011) Łokas, E. L., Kazantzidis, S., & Mayer, L. 2011, ApJ, 739, 46
- Ludlow et al. (2009) Ludlow, A. D., Navarro, J. F., Springel, V., et al. 2009, ApJ, 692, 931
- Lynden-Bell (1975) Lynden-Bell, D. 1975, Vistas Astron., 19, 299
- Martin et al. (2008) Martin, N. F., de Jong, J. T. A., & Rix, H.-W. 2008, ApJ, 684, 1075
- Martin et al. (2007) Martin, N. F., Ibata, R. A., Chapman, S. C., Irwin, M., & Lewis, G. F. 2007, MNRAS, 380, 281
- Mateo (1998) Mateo, M. L. 1998, ARA&A, 36, 435
- Mayer et al. (2001a) Mayer, L., Governato, F., Colpi, M., et al. 2001a, ApJ, 547, L123
- Mayer et al. (2001b) Mayer, L., Governato, F., Colpi, M., et al. 2001b, ApJ, 559, 754
- Mayer et al. (2007) Mayer, L., Kazantzidis, S., Mastropietro, C., & Wadsley, J. 2007, Nature, 445, 738
- Mayer et al. (2006) Mayer, L., Mastropietro, C., Wadsley, J., Stadel, J., & Moore, B. 2006, MNRAS, 369, 1021
- McConnachie & Côté (2010) McConnachie, A. W., & Côté, P. 2010, ApJ, 722, L209
- Minor et al. (2010) Minor, Q. E., Martinez, G., Bullock, J., Kaplinghat, M., & Trainor, R. 2010, ApJ, 721, 1142
- Muñoz et al. (2006) Muñoz, R. R., Carlin, J. L., Frinchaboy, P. M., et al. 2006, ApJ, 650, L51
- Olszewski et al. (1996) Olszewski, E. W., Pryor, C., & Armandroff, T. E. 1996, AJ, 111, 750
- Pagel (1997) Pagel, B. E. J. 1997, Nucleosynthesis and Chemical Evolution of Galaxies (Cambridge Univ. Press)
- Percival et al. (2009) Percival, S. M., Salaris, M., Cassisi, S., & Pietrinferni, A. 2009, ApJ, 690, 427
- Sawala et al. (2010) Sawala, T., Scannapieco, C., Maio, U., & White, S. 2010, MNRAS, 402, 1599
- Schiavon et al. (1997) Schiavon, R. P., Barbuy, B., Rossi, S. C. F., & Milone, A. 1997, ApJ, 479, 902
- Schlegel et al. (1998) Schlegel, D. J., Finkbeiner, D. P., & Davis, M. 1998, ApJ, 500, 525
- Simon & Geha (2007) Simon, J. D., & Geha, M. 2007, ApJ, 670, 313
- Sneden et al. (1992) Sneden, C., Kraft, R. P., Prosser, C. F., & Langer, G. E. 1992, AJ, 104, 2121
- Sohn et al. (2007) Sohn, S. T., Majewski, S. R., Muñoz, R. R., et al. 2007, ApJ, 663, 960
- Spinrad & Taylor (1971) Spinrad, H., & Taylor, B. J. 1971, ApJS, 22, 445
- Spolaor et al. (2009) Spolaor, M., Proctor, R. N., Forbes, D. A., & Couch, W. J. 2009, ApJ, 691, L138
- Starkenburg et al. (2010) Starkenburg, E., Hill, V., Tolstoy, E., et al. 2010, A&A, 513, A34
- Talbot & Arnett (1971) Talbot, R. J., Jr., & Arnett, W. D. 1971, ApJ, 170, 409
- Teyssier et al. (2012) Teyssier, M., Johnston, K. V., & Kuhlen, M. 2012, in prep.
- Tikhonov et al. (2010) Tikhonov, N. A., Fabrika, S. N., Sholukhova, O. N., & Kopylov, A. I. 2010, Astron. Lett., 36, 309
- Tolstoy et al. (2004) Tolstoy, E., Irwin, M. J., Helmi, A., et al. 2004, ApJ, 617, L119
- Turner & Gott (1976) Turner, E. L., & Gott, J. R., III 1976, ApJS, 32, 409
- Vorontsov-Velyaminov (1959) Vorontsov-Velyaminov, B. A. 1959, Atlas and Catalog of Interacting Galaxies, Sternberg Institute, Moscow State Univ.
- Walker et al. (2006) Walker, M. G., Mateo, M., Olszewski, E. W., et al. 2006, AJ, 131, 2114
- Wang et al. (2009) Wang, H., Mo, H. J., & Jing, Y. P. 2009, MNRAS, 396, 2249
- Weisz et al. (2011) Weisz, D. R., Dalcanton, J. J., Williams, B. F., et al. 2011, ApJ, 739, 5
- Wolf et al. (2010) Wolf, J., Martinez, G. D., Bullock, J. S., et al. 2010, MNRAS, 406, 1220
- Woo et al. (2008) Woo, J., Courteau, S., & Dekel, A. 2008, MNRAS, 390, 1453
| ID | RA (J2000) | Dec (J2000) | MasksaaNumber of DEIMOS masks on which the object was observed. | SNR (Å-1) | (km s-1) | EW(Na I 8190) (Å) | [Fe/H] | Member? | ReasonbbReasons for non-membership. : Inappropriate radial velocity. Na: Spectrum shows strong Na I 8190 doublet. G: Spectrum shows emission lines or redshifted Ca H and K lines, indicating that the object is a galaxy. Bright: Target is brighter than the TRGB. Bad: Spectral quality was insufficient for radial velocity measurement. | ||
|---|---|---|---|---|---|---|---|---|---|---|---|
| 13585 | 09 15 09.6 | +52 49 52.0 | 1 | 4.1 | N | G | |||||
| 16765 | 09 15 10.8 | +52 48 34.1 | 1 | 4.9 | N | Bad | |||||
| 11688 | 09 15 11.8 | +52 50 12.4 | 1 | 15.5 | N | G | |||||
| 16355 | 09 15 11.8 | +52 48 50.4 | 1 | 4.1 | N | Bad | |||||
| 16895 | 09 15 13.4 | +52 48 29.4 | 1 | 2.2 | N | Bad | |||||
| 3705 | 09 15 15.4 | +52 51 59.3 | 1 | 25.6 | N | Na | |||||
| 16598 | 09 15 16.9 | +52 48 40.7 | 1 | 50.9 | N | Na Bright | |||||
| 16798 | 09 15 17.5 | +52 48 32.7 | 1 | 68.8 | N | Na Bright | |||||
| 7035 | 09 15 17.9 | +52 50 58.8 | 2 | 16.5 | N | G | |||||
| 7917 | 09 15 19.8 | +52 50 49.5 | 2 | 13.0 | Y | ||||||
References. — Identifications, coordinates, and photometry from B11a.
Note. — (This table is available in its entirety in a machine-readable form in the online journal. A portion is shown here for guidance regarding its form and content.)