A search for AGN in the most extreme UV-selected starbursts using the European VLBI Network
Abstract
We have used the European VLBI Network (EVN) to observe a sample of Lyman Break Analogs (LBAs), nearby () galaxies with properties similar to the more distant Lyman Break Galaxies (LBGs). The study of LBGs may help define the feedback relationship between black holes (BHs) and their host galaxies. Previous VLA observations have shown that the kpc-scale radio emission from LBAs is dominated by starbursts. The main targets of this VLBI experiment were selected because they possessed emission-line properties between starbursts and Type 2 (obscured) AGN. Eight targets (three star-forming LBAs, four composite LBAs, and one Type 1 AGN) were observed at 5 GHz, four of which (one star-forming LBA and three composite LBAs) were also observed at 1.7 GHz. One star-forming LBA and one composite LBA were detected above 5 at 1.7 GHz (only), while the AGN was detected at 5 GHz. In both LBAs, the radio luminosity () exceeds that expected from supernovae (remnants) based on a comparison with Arp220, Arp229A and Mrk273, by factors of . The composite LBA exhibits a compact core emitting around 10 of the VLA flux density. The high of K and excess core with respect to the relation of radio-quiet AGN indicate that this LBA possesses an obscured AGN ( ). In three other composite LBAs detected previously in the X-ray, no radio sources were detected, indicating either variability or the presence of an obscured AGN below our radio sensitivity. While weak AGN may co-exist with the starbursts as shown in at least one of the LBAs, their contribution to the total radio flux is fairly minimal. Our results show that the detection of such weak AGN presents a challenge at radio, X-ray and optical emission-line wavelengths at , indicating the great difficulties that need to be overcome in order to study similar processes at high redshift when these types of galaxies were common.
keywords:
radio continuum: galaxies, techniques: interferometric, galaxies: active, galaxies: starburst, galaxies: ISM1 Introduction
The nuclei of local galaxies contain supermassive black holes. Evidence suggests that these BHs have grown over time following the mass increase of their host galaxies in accordance with the - or - relations (Magorrian et al., 1998; Gebhardt et al., 2000). Furthermore, feedback between these BHs and their hosts is an essential element of structure formation models as it has been proposed that they regulate or suppress star formation as a result of active galactic nucleus (AGN) activity (e.g. Di Matteo et al., 2005). One must thus approach galaxy formation with both star formation and BH accretion in mind.
Starburst galaxies at high redshift, such as the UV-selected Lyman Break Galaxies or their dusty counterparts such as the sub-mm galaxies (SMGs), are the precursors of present day massive galaxies undergoing a phase of intense star formation (e.g. Adelberger et al., 2005). A significant fraction of their stellar mass is contained in large, dense stellar clumps. It has been suggested that these giant clumps could host seed BHs that merge in the center of the galaxy (Elmegreen et al., 2008), where they can continue to grow further through other accretion events. It has been shown that the majority of SMGs at high redshift host an AGN as indicated by their X-ray emission (Alexander et al., 2005), while the fraction among LBGs is a few percent at most (Steidel et al., 2002; Lehmer et al., 2005; Laird et al., 2006; Ouchi et al., 2008; Zheng et al., 2010). One possible explanation for this discrepancy is a delay expected between the moment of onset of the starburst and the moment that a galaxy is able to feed its BH, as one has to wait for the strong winds and supernovae (SN) from the most massive stars to have ceased before gas can fall onto the BH (Norman & Scoville, 1988; Davies et al., 2007). This would be consistent with the relatively young ages of typical LBGs at compared to the dustier and more evolved SMGs.
Although the majority of LBGs do not appear to host luminous AGN, it is difficult to detect the presence of a low-luminosity AGN (LLAGN), especially when it is at the center of a powerful starburst. From studies in the local universe we know that weak or absent X-ray emission does not necessarily imply that an accreting BH is absent. LLAGN have a large range in optical-to-X-ray luminosity ratios, and many are very weak in hard X-rays due to heavy obscuration (Heckman et al., 2005a). Other AGN identification techniques, such as the commonly used diagnostic tests based on optical emission line ratios (e.g. Baldwin et al., 1981, “BPT” diagrams) can also yield inconclusive results. These line ratios are susceptible to, e.g., dust, metallicity, age and star formation history (Kewley et al., 2006; Yuan et al., 2010). New low velocity shock models furthermore show that the line ratios arising in purely star-forming or starbursting environments are often indistinguishable from those that are due to a combination of star formation and some AGN contribution, both occupying the same “composite” region of the BPT diagram (Rich et al., 2011). These problems can be partly alleviated by disentangling the emission from different galaxy components (e.g., nucleus vs. outer parts) using integral field spectroscopy, but this is currently not feasible at high redshifts except for the most extended galaxies.
We previously selected a rare population of nearby () galaxies that are remarkably similar to LBGs in most of their basic physical properties. These “Lyman Break Analogs” (LBAs) are similar to LBGs in mass, age, size, metallicity, optical extinction, SFR, and gas velocity dispersion (Heckman et al., 2005b; Hoopes et al., 2007). They also have morphologies similar to those at (Overzier et al., 2008, 2010), have similar emission line kinematics (Basu-Zych et al., 2009; Gonçalves et al., 2010), and a similar interstellar medium dominated by strong feedback from massive, clumpy starburst regions (Overzier et al., 2009; Heckman et al., 2011). While none of the sources show any evidence for an unobscured (Type I) AGN (largely by selection), it is unclear whether some may host obscured (Type II) LLAGN. A small subset of LBAs falls in the composite region of the BPT diagram. These sources were also found to have the densest and most massive nuclei reminiscent of extremely young bulges (Overzier et al., 2009). An obvious question to ask is whether we see any evidence for BH growth.
At low intrinsic radio luminosities, the total radio emission of AGN is often dominated by the star formation in their host galaxies (e.g. Padovani et al., 2011; Kimball et al., 2011). High-resolution Very Long Baseline Interferometry (VLBI) observations can be used to search for the elusive LLAGN through their compact, high brightness temperature radio emission amidst other compact sources corresponding to radio supernovae (RSN) and supernova remnants (SNR) frequently seen on pc scales by allowing us to identify excess radio emission above that expected for RSN and SNR models (Kewley et al., 2000; Bondi et al., 2005; Gallimore et al., 2006; Perez-Torres et al., 2010; Biggs et al., 2010). Previous VLBI surveys have primarily targeted dusty galaxies (e.g. Luminous or Ultra-Luminous IR galaxies, (U)LIRGs) in the nearby universe (e.g. Corbett et al., 2003; Parra et al., 2010). The UV-selected LBA sample allows us to study the relationship between nuclear starbursts and BHs in an environment much more similar to that expected at high redshift. We present the results from a pilot project using the European VLBI Network (EVN) exploring for the first time the compact radio structures in the nuclei of LBAs. The structure of this Paper is as follows. In §2 we present our sample and give details on the 6 and 18 cm radio observations and data reduction methods. In §3 we present the main results. We discuss the implications of our results in §4, and conclude with a summary in §5. Throughout this paper, we assume a cosmology [,,] [0.27,0.73,73.0] (with in km s-1 Mpc-1) so that the angular scales at 0.1, 0.2, and 0.3 are 1.8, 3.2, and 4.3 pc mas-1.
2 Sample, Observations, and Data Reduction
For this experiment we targeted LBAs that were previously detected at the 0.5 mJy level in the Very Large Array (VLA) observations of Basu-Zych et al. (2007). Our VLBI sub-sample consists of three sources that are unlikely to host an AGN, and four sources that may be of starburst-AGN composite type based on their optical emission line ratios (Overzier et al., 2009). For comparison, we also include an eighth source showing strong evidence for pure AGN emission. We note that this source has similar far-UV properties as the LBAs but it does not satisfy the full LBA selection criteria because the latter were designed to exclude pure AGN. Details on the sources are given in Table 1.
Two separate sets of observations were completed using the European VLBI Network (EVN) over the course of two years. EVN observations of J0150+1308, J0213+1259, J0921+4509 and J21030728 were carried out at 1.7 GHz on three days between 4–8 June 2008. The participating telescopes were the Lovell Telescope in Jodrell Bank, the 14-element Westerbork Synthesis Radio Telescope, Effelsberg, Onsala (25m), Medicina, Noto, Torun, Urumqi, Shanghai and Cambridge. Baselines therefore ranged from 198 km to 8476 km. The aggregate bitrate per telescope was 1024 Mbps using 2-bit sampling and 4s integration time. There were 816 MHz subbands each with 32 channels in both LCP and RCP polarizations.
| (J2000) | (J2000) | Type | SFR1.4 | SFRUV+IR | log | log | ||||
| (h m s) | (∘ ’ ”) | (mJy) | (M⊙ yr-1) | (M⊙ yr-1) | () | (erg s-1) | ||||
| 01:50:28.42 | +13:08:58.1 | 0.147 | 2.29 | 0.21 | SF-LBA | 1.50 | 30.9 | 57.1 | 11.40 | – |
| 08:15:23.39 | +50:04:14.6 | 0.164 | 0.76 | 0.29 | SF-LBA | 0.67 | 17.7 | – | – | – |
| 13:53:55.90 | +66:48:00.5 | 0.198 | 1.74 | 0.16 | SF-LBA | 0.57 | 22.5 | 26.8 | 11.05 | – |
| 02:13:48.54 | +12:59:51.4 | 0.219 | 0.78 | 0.81 | COMP-LBA | 0.90 | 44.3 | 56.1 | 11.38 | 41.63 |
| 08:08:44.26 | +39:48:52.3 | 0.091 | 0.58 | 0.66 | COMP-LBA | 0.5 | 6 | 11.5 | 10.47 | 41.60 |
| 09:21:59.39 | +45:09:12.4 | 0.235 | 0.74 | 0.50 | COMP-LBA | 1.41 | 81.5 | 87.1 | 11.57 | 42.36 |
| 21:03:58.73 | 07:28:02.2 | 0.137 | 0.93 | 0.76 | COMP-LBA | 3.84 | 68.1 | 62.4 | 11.36 | 41.68 |
| 10:29:59.95 | +48:29:37.9 | 0.232 | 4.17 | 0.45 | AGN | 0.85 | – | – | – | – |
To extend the coherence time, the targets were phase-referenced to nearby calibrators with separations of 0.5–2 degrees selected from the VLBA Calibrator List111http://www.vlba.nrao.edu/astro/calib/index.shtml. The calibrator positions were accurate to within 0.20 to 1.32 mas. Within the phase-reference cycle of about eight minutes, 100 seconds was spent on calibrators and 280 seconds on the targets, and there were 30s gaps included for system temperature measurements. The total on-source time per target was about 3.5 hours, that would ideally lead to a thermal noise below 10 Jy/beam.
Follow-up EVN observations of an extended sample, now including J0808+3948, J0815+5004, J1029+4829, J1353+6648 were carried out at 5 GHz on 19-20 March 2010 (see Table 1). A higher frequency was used in this second run because it was believed to lead to higher detection rates: the expected flat spectrum emission from an AGN core would dominate over the steep spectrum emission from star-forming regions and it was expected that free-free absorption would not play a dominant role at this frequency. The array included the Lovell Telescope, Yebes (40m), Westerbork, Effelsberg, Onsala (25m), Medicina, Noto and Torun. The resulting baselines ranged from 266 to 2279 km. The data were recorded at 1024 Mbps in a similar fashion to the first observations (2-bit sampling and a 2-second integration time). There were 816 MHz subbands each with 32 channels in both LCP and RCP polarizations. Targets were again phase-referenced to calibrators with angular separations of 0.5-2 degrees. A phase-reference cycle of 90–300 seconds on the calibrators and targets respectively was employed. The total on-source time on the targets was between 1–2 hours. The expected rms noise was below 15 Jy/beam allowing for detections for targets at the level of 100 Jy.
The data were correlated by the EVN Data Processor at the Joint Institute for VLBI in Europe (JIVE). For data reduction and analysis we used the NRAO Astronomical Image Processing System (AIPS). We followed standard data reduction procedures (e.g. Diamond, 1995): the data were amplitude calibrated with measured gaincurves and system temperatures then fringe-fitted and bandpass calibrated using the compact calibrator sources. Anomalous solutions were manually flagged in AIPS using the task to view calculated rate and delay solutions. Subband 8 for the Lovell telescope and subband 7 for Torun were completely flagged in the second set of observations using task due to poor bandpass solutions. The calibrated target data were averaged in time and frequency and then exported to UVFITS format. Additional manual flagging was carried out in Difmap (Shepherd et al., 1994). For the second set of data collected on March 2010, amplitude calibration was verified on several compact calibration sources (J0209+1352, J0808+4950, J1344+6606) in Difmap. The sources were cleaned using repeated calls to and and then the amplitude corrections were examined using . It was noted that across all calibrator sources all Torun amplitudes were off by a factor of 1.7 while Noto subband 7 amplitudes were off by a factor of 1.5 and subband 8 amplitudes were off by a factor of 1.7. Systematic corrections were made to these subbands using the AIPS task and then the data was re-exported to UVFITS format. Possible sources of such systematic errors include faulty measurements due to RFI usually present across most subbands.
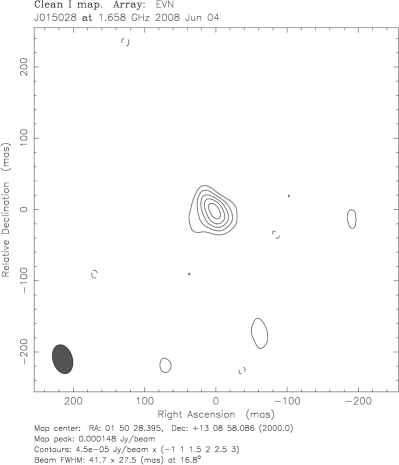
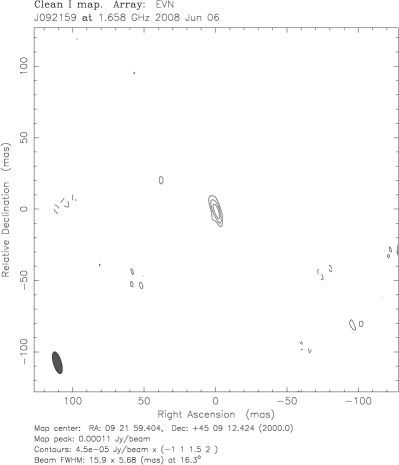
Dirty maps were formed with natural weighting (uvw 0, -2) using the command in Difmap. For each target source the peak brightness and rms noise was determined. The results are listed in Table 2. For the two safe detections we show clean maps in Figure 1.
| Source | noise | peak | S/N | beam | ||
|---|---|---|---|---|---|---|
| (GHz) | (Jy/b) | (Jy/b) | (mas) | (K) | ||
| J0150+1308 | 1.658 | 15 | 149 | 9.9 | 8.66.2 | 32.0 |
| J0213+1259 | 1.658 | 14 | 54 | 3.9 | 5.97.8 | 5.0 |
| J0921+4509 | 1.658 | 15 | 113 | 7.5 | 5.715.9 | 1.1 |
| J21030728 | 1.658 | 17 | 73 | 4.3 | 6.310.2 | 5.4 |
| J0150+1308 | 4.990 | 26 | 111 | 4.3 | 6.18.5 | 1.1 |
| J0213+1259 | 4.990 | 26 | 115 | 4.4 | 6.18.7 | 1.2 |
| J0808+3948 | 4.990 | 35 | 162 | 4.6 | 5.210.1 | 1.7 |
| J0815+5004 | 4.990 | 31 | 117 | 3.8 | 5.19.3 | 1.1 |
| J0921+4509 | 4.990 | 25 | 100 | 4.0 | 5.48.1 | 1.1 |
| J1029+4829 | 4.990 | 24 | 127 | 5.3 | 7.19.4 | 1.2 |
| J1353+6648 | 4.990 | 25 | 98 | 3.9 | 5.58.3 | 1.0 |
| J21030728 | 4.990 | 27 | 111 | 4.1 | 7.110.2 | 0.8 |
3 Results
For the 1.7 GHz data two sources, J0150+1308 (star-forming LBA) and J0921+4509 (composite LBA) were detected above 5. J0150+1308 is located at (,)J2000 of (01:50:28.39531,+13:08:58.0833). J0921+4509 is located at (09:21:59.40425,+45:09:12.4232). Both have a positional error of approximately 1 mas. For the 5.0 GHz data only one source was detected above 5, J1029+4829 (the AGN) while the two sources detected at 1.7 GHz were not. J1029+4829 is located at (10:29:59.95930,+48:29:38.0012) with a positional error of approximately 2 mas. Real detections should exhibit the synthesized beam pattern in their images due to the beam pattern’s large effect on the noise in any image, although this cannot be seen at very low signal-to-noise ratios. The two LBAs detected at 1.7 GHz exhibit this beam pattern in their dirty images suggesting they are safe detections. The strong detection of these two sources at 1.7 GHz demonstrates the success of our phase-referencing efforts. We believe that the sources that remained undetected at 1.7 GHz are diffuse radio sources which lack a compact core detectable on the scale of our observations. Applying a -taper to downweight longer baselines, testing the effects of possibly over-resolving the flux, did not lead to a detection thus strengthening our reasoning that these are indeed faint sources.
At 5 GHz one likely detection just above 5 was made. For the source J1029+4829 (AGN) the peak brightness location did not vary when applying a strong UV-taper or when removing baselines or observation times suggesting a probable detection. Observations with a greater sensitivity would be needed to confirm this detection. The two sources detected at 1.7 GHz were not detected at 5 GHz. This result could be explained in several possible ways. One option is that our phase-referencing did not work well. Alternatively, the sources did not have compact emission well exceeding the 100Jy level so the sources were completely resolved in this observation. Lastly, it is possible that they had spectra of () calculated using the 5 upper limit.
For the detected sources, parameters were obtained by fitting point and/or circular-Gaussian model components to the -data using the command in Difmap. The results are summarized in Table 3. It should be noted that in all cases less than 50 of the measured VLA flux density was recovered. For the source J0150+1308 (star-forming) only an extended model significantly larger than the restoring beam produced a good fit. Fitting a point source model on the map left residual emission on the dirty map, indicating a more extended structure. Thus the non-detection of J0150+1308 (star-forming) at 5 GHz is most likely due to over-resolution. On the other hand, J0921+4509 (composite) could be fit equally well with a point source, a relatively compact circular Gaussian ( 1.32 mas), or a more extended Gaussian source model (with size about the same as the major axis of the restoring beam).
Brightness temperatures were determined for each source detected using the formula
| (1) |
where is the flux density (Jy), and are the major and minor axes of the fitted Gaussian model component (mas or FWHM for a point source) and is the observing frequency (GHz).
| Source | Ratio | ||||
|---|---|---|---|---|---|
| (GHz) | (Jy) | (EVN/VLA) | (mas) | (K) | |
| J0150+1308 | 1.658 | 456 | 0.304 | 59.3 | 0.10 |
| J0921+4509 | 1.658 | 111 | 0.079 | 1.32 | 34.9 |
| J1029+4829 | 4.990 | 126 | N/A | 9.4 | 0.12 |
Because we could not distinguish between point and extended models in the case of J0921+4509 (composite), we used a Monte Carlo simulation of 1000 trials to attempt to constrain the source size. All Monte Carlo simulations were carried out using ParselTongue (Kettenis et al., 2006) to call the relevant AIPS task repeatedly. Taking the 1.7 GHz field of J0213+1259 (composite) as a non-detection field we used the AIPS task to add a point source directly to the -data. Random noise was simulated by placing the source at a different location in the field with every call to . The AIPS task was then used to fit a circular Gaussian model to this point source. Trials were conducted with initial modelfitting parameters of both 2 mas and 10 mas for the major axis and giving the correct location of the simulated source. In both cases, the results were strongly peaked at a size of 0 mas though an initial fit parameter of 10 mas occasionally led to give results between 10 mas and 15 mas as the estimation of the size of our point source. We repeated the trials adding phase errors of 10 rms by using ParselTongue to manually edit the SN table of our dataset. When fitting a 10 mas model to this data the secondary peak between 10 mas and 15 mas was more pronounced. So while one of our modelfit results for J0921+4509 had a radius of up to 15.9 mas our simulations reveal the radio source could still be unresolved with a much smaller radius, especially given expected phase errors in our data.
Next we performed a similar trial but attempted to fit a Gaussian model to an inserted Gaussian source of 10 mas. The initial model provided to exactly matched the simulated source. While results of the modelfitting program tended to cluster around 10 mas, there was a spread of 5 mas with and without phase errors of 10 rms. Thus any modelfit result obtained is likely accurate to within 5 mas. However, this trial never produced results in the region of 1 mas. In our simulations an extended model comparable to the beamsize can be fit by a weak point source accurately, but it is not possible to fit well an extended source with a compact model much smaller than the beam. Since the VLBI structure of J0921+4509 (composite) can be fit well with compact models, it is most likely that the true size of the source is about 1.32 mas, with an error of mas.
To summarize, we conclude that we have made two safe detections, one of which, J0150+1308 (star-forming), was resolved at 59.3 mas while the other, J0921+4509 (composite), is practically unresolved at 1.32 mas. In the next section we will discuss the interpretation of these results.
4 Discussion
4.1 Preexisting evidence for hidden AGN in composite LBAs
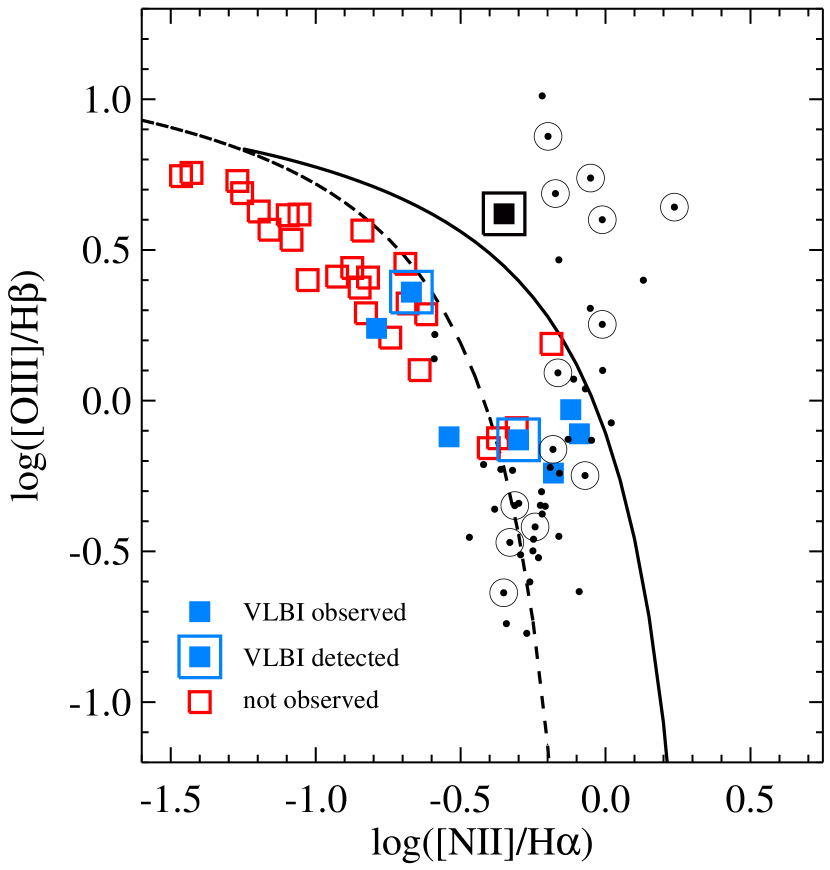
In order to address the question of whether weak AGN are present in the nuclear starburst regions of the LBAs, we specifically targeted four LBAs having optical emission-line spectra intermediate between pure starbursts and Type II AGN (J0213+1259, J0808+3948, J0921+4509, J2103–0728). We also targeted three objects that, at least according to their main optical emission line ratios, are not suspected of having an obscured AGN present (J0150+1308, J0815+5004, J1353+6648), and one source that is an AGN (J1029+4829). These sources are shown in the optical emission line diagnostics diagram in Figure 2 (BPT diagram).
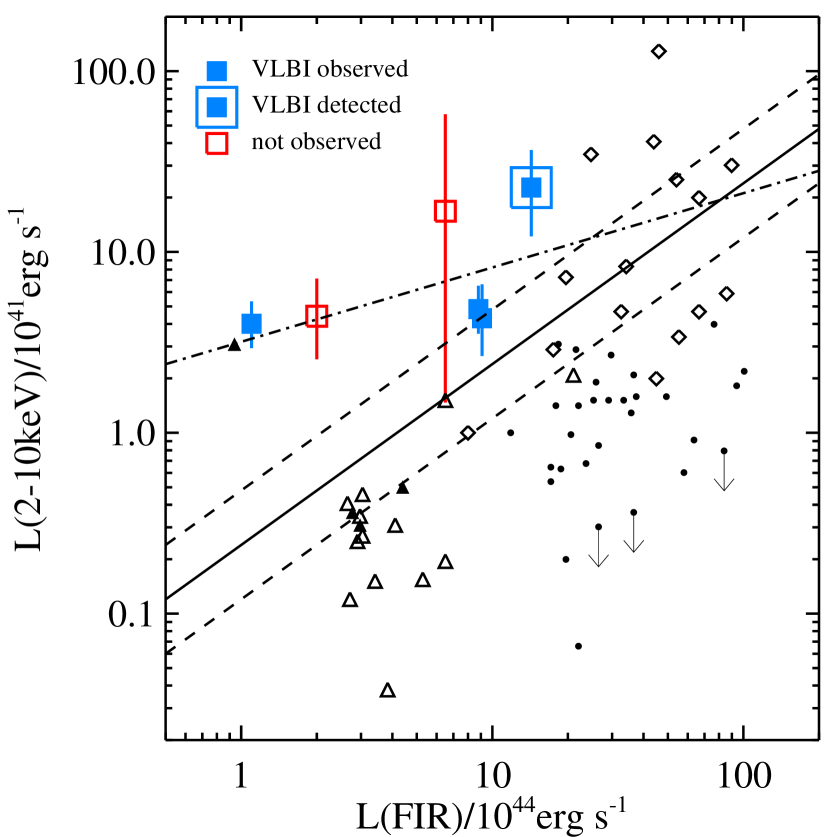
Previous work has shown that the LBAs that lie in the composite part of the BPT diagram have a number of other properties as well that make them peculiar with respect to the “non-composite” LBAs: Overzier et al. (2009) showed that they are host to particularly dense and compact starbursts (radii of order 100 pc), reaching stellar mass densities comparable to those of dense star clusters, while being up to 1000 times more massive (stellar masses of ). They also tend to be the most massive galaxies in the LBA sample, and have the highest SFR (several tens to a hundred yr-1, the exception being J0808+3948). Heckman et al. (2011) presented FUV spectra obtained with HST/COS that showed that these dense, compact starburst regions drive powerful winds with median and maximum velocities several times higher than that seen in typical starbursts, including LBGs at high redshift. Based on the starburst nature of the FUV spectra, the high wind speeds and the lack of evidence of unobscured (i.e. Type I) AGN, it was argued that these are momentum-driven winds caused by the intense supernova activity in the compact starbursts at the base of the wind. Finally, Jia et al. (2011) found the first plausible evidence for the presence of low luminosity, obscured AGN in some or all of 6 composite LBAs observed in the X-ray. The presence of an AGN was inferred from elevated levels (factors of 2–10) of hard X-ray emission over that expected from the SFR– sequence formed by pure star-forming galaxies (see Figure 3). However, the SFR– correlation and its scatter are not particularly well constrained, making the detection somewhat ambiguous. A stacked spectrum showed the potential detection of the 6.4 keV iron emission line (which is a key feature of obscured AGN), but only at the 2 level. Jia et al. (2011) further found that the ratios of the mid-infrared (24 m) continuum to [O III]5007 luminosities in these LBAs was higher than the values for typical Type 2 AGN by an average of 0.8 dex. Combining all these clues, it is likely that a hidden AGN is present in some or all of these composite LBAs, but that their bolometric luminosities are completely dominated by the intense starburst.
4.2 New insights from the VLBI data
The VLBI data on LBAs presented in this paper provide another piece of information on the issue of AGN in LBAs. As shown in Figure 2, we have detected one out of the four composite LBAs observed with VLBI, and one out of the three HII-like LBAs. (Our third detection of a known AGN will not be discussed further here).
On first sight, these results do not offer a clear dichotomy between star-forming and composite LBAs. Because all LBAs have extended radio structures due to star formation and supernova activity extending to larger scales than those probed by VLBI (Basu-Zych et al., 2007), the emission we have detected could in principle be coming from certain compact, high surface brightness regions related to those structures. The fact that three of the four composite LBAs do not show any VLBI radio emission at all indicates that (1) the radio emission arising from their star-forming regions is completely resolved at milliarcsecond or parsec scales, and (2) no (bright) radio AGN is present in these sources.
What other constraints do we have in order to study the relative contributions from starburst and AGN activity in this sample? Our detections have brightness temperatures of and K (see Table 3). These values are equal to (in the case of J0150+1308) and well in excess of (J0921+4509) the typical upper-limit for thermal emission arising from star-forming regions ( K), thus indicating that the emission in these objects is likely of non-thermal origin, at least in the case of J0921+4509 (Condon et al., 1991). Even though at these frequencies starburst emission may be dominated by nonthermal emission as well, their maximum brightness temperature still does not appear to exceed that limit. One interpretation is that the observed radio emission is associated with radio supernovae (RSNe) or supernova remnants (SNRs). The non-detection at 5 GHz of both of our detections at 1.7 GHz supports this conclusion: our sources have steep spectra which may be indicative of RSNe or SNR.
| Source | Physical Size | SFR | |
|---|---|---|---|
| ( ergs s-1 Hz-1) | (pc) | (M⊙ yr-1) | |
| J0150+1308 | 2.116 | 146.2 | 7.78 |
| J0921+4509 | 1.388 | 4.76 | 5.10 |
| J1029+4829 | 1.540 | 33.7 | 5.66 |
We can compare the total (non-thermal) radio luminosity detected from J0150+1308, erg s-1 Hz-1, and J0921+4509, erg s-1 Hz-1 (Table 4), with that expected based on nearby starburst galaxies for which it is possible to determine the relative contributions of individual RSNe and SNRs. The brightest RSN observed in starburst galaxies have a typical luminosity at 18 cm of the order of erg s-1 Hz-1, while the most luminous RSN ever observed (SN1988z) had erg s-1 Hz-1 (Bondi et al., 2005). It is thus clear that the radio emission from LBAs requires large complexes of such SN (or an AGN). We will employ the well-studied examples of such complexes observed in the starburst galaxies Arp299-A (Perez-Torres et al., 2009, 2010), Arp220 (Lonsdale et al., 2006; Parra et al., 2007), and Mrk273 (Bondi et al., 2005) to guide our discussion.
The central pc region of Arp299-A consists of a cluster of 26 RSNe and SNRs detected at 5 GHz, with a total luminosity coming from this region of erg s-1 Hz-1, corresponding to erg s-1 Hz-1 assuming a median spectral index of -0.72 for the region as a whole. The Western nucleus of Arp220 is another example of such a prolific supernova factory: it consists of 18 individual RNSe/SNRs within a region of pc and a total radio luminosity of erg s-1 Hz-1.222It should be noted that Downes & Eckart (2007) found evidence for a weak AGN in the West nucleus of Arp220. If this is the case then the radio excess we detect would either be the result of many additional RNSe/SNRs, though that would be unlikely, or the result of a stronger AGN. In order to minimize potential systematic biases when we compare these objects with the LBAs, we will apply a scaling based on the ratios of the physical areas () observed and the total IR luminosities () of these systems. The expected 18 cm luminosities for the LBAs are then , where with log and log. was typically in the range , and was never larger than a factor of 5, indicating that the comparison sample is well-matched to the LBAs in terms of their SFRs and size of the physical regions probed. Next, we calculate the ratio of observed to expected radio luminosity for both LBAs.
For J0150+1308, the radio luminosity observed is, respectively, and higher than that expected based on Arp220 and Arp299A. For J0921+4509, and assuming that the source is resolved (see Section 3), the observed luminosity is, respectively, and higher than that expected based on Arp220 and Arp299A. If we assume that J0921+4509 is unresolved, its smaller area leads to observed luminosities that are higher than expected by factors of and . Similarly, if we compare with the brightest radio nucleus in Mrk273, N1 with erg s-1 Hz-1 (Bondi et al., 2005), the observed luminosities are again higher by factors of 2–3 for both LBAs. To summarize, our comparison shows that the radio luminosities of the LBAs are always higher than expected by factor of 2–3 for J0150+1308 and a factor of 3–8 for J0921+4509 suggesting that more than just star formation may be contributing to the radio emission observed.
4.3 The starburst interpretation
In Overzier et al. (2009) we argued that one explanation for the position in the BPT diagram of composite LBAs such as J0921+4509, together with their relatively low , was that these are post-starbursts where the O stars were deficient and ionization by shocks (rather than photoionization by O stars) was very significant (our so-called “aged-starburst” hypothesis, §4.2.1 in that paper). However, confirmation of shock heating in the form of enhanced [SII] and [OI] line strengths was not found. New COS data on J0921+4509 imply a young age of 3 Myr for the central starburst (Heckman et al. (2011) and Borthakur et al., in prep.), ruling out that model. These are young starbursts where the ionizing luminosity is at least an order-of-magnitude larger than the rate of kinetic energy supplied by supernovae. While this does not mean that shocks may not be contributing (see Heckman et al. (2011) for evidence of high velocity outflows), there is certainly no evidence for a weakness or an absence of ionizing radiation from stars that would lead to shock-dominated emission lines if this were an aged starburst. The starburst interpretation also fails to explain the excess X-ray emission observed in this source, unless an exotic starburst contribution to the hard X-ray emission is invoked (Jia et al., 2011).
4.4 The AGN interpretation
A more likely interpretation is that (some) composite LBAs host an AGN, consistent with the large excess compact radio emission observed on VLBI scales (in the case of J0921+4509). Unfortunately, we do not have sufficient resolution and sensitivity to look for further confirming evidence by resolving the core-jet structure in the radio, and the non-detections at 5 GHz imply that these low-luminosity sources may have significantly steeper spectra than found in radio-loud AGN (e.g. Prandoni et al., 2010; Giroletti & Panessa, 2009). On the other hand, there are now four independent indications that an AGN may be present: (1) the composite position in the BPT diagram, (2) the high VLBI luminosity, (3) the compact radio size, and (4) the hard X-ray excess found by Jia et al. (2011, see also Fig. 3). The offset into the AGN/composite region of the BPT diagram could then be the result of the strong ionizing radiation from the starburst with a small contribution from an obscured AGN (as well as some contribution from shocks).
If we assume that the VLBI detection in J0921+4509 is due to a radio AGN, we can compare it to typical radio-quiet quasars and Seyfert galaxies. Taking erg s-1 from Jia et al. (2011) and applying a factor of 2.86 to convert to we find , about 10 higher than inferred from the relation from Laor & Behar (2008) who find (with a scatter of about a factor 3 in ) for radio-quiet quasars. We compare this source to the BH “fundamental plane” (FP) from Merloni et al. (2003, M03). Even though J0921+4509 was not detected at 5 GHz, we have extrapolated our 1.7 GHz detection to 5 GHz assuming a spectral index of -0.1 (consistent with the (5) upper limit for this source in the 5 GHz observation). At face value, the result suggests a BH mass of a few times . Much higher values are unlikely given the constraint on the radio luminosity, although there is significant uncertainty in the BH FP depending on the source of the radio and X-ray emission and the accretion state (e.g. see Plotkin et al., 2011). In a recent paper, de Gasperin et al. (2011) find that a sample of low luminosity Type II AGN and LINERS do not lie on the BH FP of Merloni et al. (2003). Instead, based on their BH masses inferred from stellar velocity dispersions, the M03 relation would overpredict the of their sources by up to two orders of magnitude. In Jia et al. (2011) it was estimated that the candidate Type 2 AGN in the composite LBAs may have BH masses in the range of if these objects are radiating at the Eddington limit, but they could be higher for sub-Eddington BHs. On the other hand, Overzier et al. (2009) showed that the central mass concentration on a scale of 100 pc is consistent with a “proto-bulge” of order in stars. Assuming a standard bulge-black hole mass scaling relation, it is hard to imagine the presence of a black hole substantially more massive than . The presence of a compact radio core has at least made it convincingly clear that an AGN is present in J0921+4509, but it is impossible to give better constraints on the BH mass than – .
We can compare the results from our small sample with the results of Parra et al. (2010) who analyzed the radio AGN fraction among a much larger sample of relatively nearby, “warm” IR-luminous galaxies (wLIRGs) across the BPT diagram, also using VLBI. In some respects, their sample can be considered to be the more obscured equivalent of our UV-selected LBA sample (see Overzier et al., 2009). The wLIRGs and LBAs are shown in Figure 2 (small dots), where sources with large circles indicate VLBI detections. While most of the wLIRG sources with optical spectra indicative of a dominant AGN were detected in VLBI, most (%) of the sources in the AGN-starburst composite region of the diagram were, in fact, not (see also Corbett et al., 2003). This situation is similar to the non-detections for three of our four composite LBAs. One may naively expect that the chance of detecting an AGN increases significantly as one moves from pure HII-like objects to pure AGN-like objects across the BPT diagram, contrary to what is observed. One explanation for the lack of VLBI detections among the composite LBAs and wLIRGs could be that the high gas columns of the dense nuclear gas associated with the starbursts leads to significant free-free absorption, which would especially affect these composite systems. In this case, it would be better to observe at higher frequencies in order to offset the dependence of the free-free opacity, although we note that we did not detect anything at 5.0 GHz either (including the known 1.7 GHz source J0921+4509). On the other hand, even with a relatively high of as found for J0921+4509, the remaining composite LBAs sources would have been hard to detect given their hard X-ray luminosities (about a factor of 10 lower). Not only are the radio AGN expected to be intrinsically faint, the relatively high redshift of our sources () complicates their detectability with VLBI. Alternatively, given AGN variability as observed in some LLAGN (Bell et al., 2011), or the episodic accretion expected in some cosmological galaxy formation models (e.g. Hopkins & Quataert, 2010) it is perhaps not surprising that our very small sample observed produced only one clear detection of an accreting BH in the radio as the X-ray observations were performed at a different epoch.
5 Summary and future prospects
This paper presents the results of a pilot program to observe LBAs with composite spectra intermediate between pure starbursts and Type II AGN for comparison with objects whose optical emission-line ratios did not appear to suggest the presence of an obscured AGN. The VLBI data obtained with the EVN were combined with data previously obtained in the X-ray from XMM-Newton, optical from SDSS and mid- and far- IR from Spitzer to further constrain the nature of these objects that are of special interest given their demonstrated similarities to galaxies that were common only at high redshift. While it might be expected that composite objects are detected more frequently than pure HII-like regions only % of our composite LBAs were detected, possibly due to free-free absorption.
Three sources, J0150+1308, J0921+4509, and J1029+4829 were detected above 5, and all had brightness temperatures close to or in excess of the typical upper-limit for thermal emission from star-forming regions. In addition, J0150+1308 and J0921+4509 had radio luminosities 2-8 times above that expected from multiple radio supernovae and supernova remnants in the starbursts Arp220, Arp229A and Mrk273 after a careful normalization based on the different resolutions and total SFRs.
In particular, the composite LBA J0921+4509 displayed a compact core, most likely unresolved as confirmed by Monte Carlo simulation, emitting around 10 of observed VLA flux. The source also possessed an excess expected from the / ratio of radio-quiet AGN, while its was found to be high relative to the value expected based on its SFR (Jia et al., 2011). This suggests a source of radio and X-ray emission beyond that expected of a pure starburst. We conclude therefore that this excess is most probably due to an obscured AGN with an estimated BH mass of .
As stated in §1, one of our main motivations for probing BH formation in these LBAs as local analogs of LBGs is the question of whether the young starburst-dominated galaxies seen at high redshift already carry the “seeds” of supermassive BHs detected in the local universe. If so, these small-to-moderate mass BHs at high redshift may reveal their presence through AGN activity. It is currently not clear whether BHs would be able to accrete very efficiently in these young and dense starburst dominated regions, or whether a delay should exist between the onset of a central starburst and the accretion onto the central BH (e.g. Norman & Scoville, 1988; Davies et al., 2007). Taken together, our X-ray and radio results shown here indicate that LLAGN can co-exist in young, dense starbursts, but our sample is currently too small to put strong constraints on this timing argument.
It is important to point out that at radio wavelengths, the contribution of these AGN is still only a fraction of the total radio flux density, making the identification of such sources based on radio data practically impossible much beyond (see below). Even in the X-rays, the combined luminosity from SFR and candidate AGN in LBAs (Jia et al., 2011, and Fig. 3) is lower or comparable to that detected in the deepest X-ray stacks of star-forming galaxies at (Laird et al., 2006; Zheng et al., 2010), illustrating that individual detections are likely out of reach for current X-ray observatories. Also discussed in this paper, the interpretation of optical emission line diagnostic diagrams for identifying weak AGN is not trivial either, especially in the case of shocks or due to the limited physical resolution achieved in high redshift data (see Fig. 12 in Overzier et al., 2009, for a large compilation of BPT information from low and high redshift galaxies). These limitations indicate the important role that nearby galaxies still play in studying the AGN-starburst (or BH-host galaxy) connection.
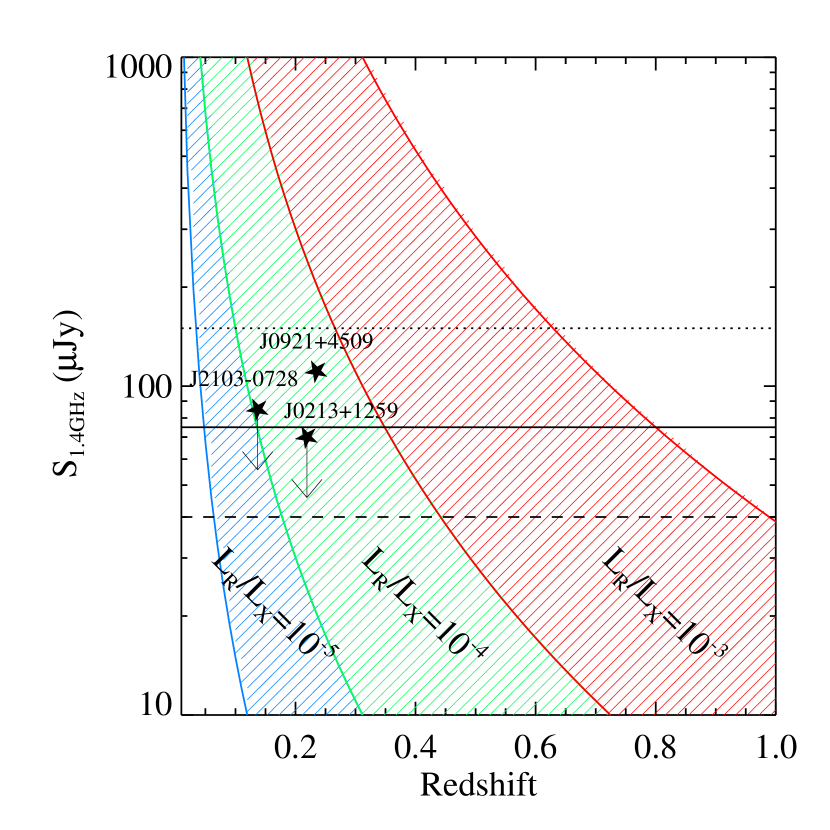
Our pilot program of searching for AGN in the most extreme UV-selected starbursts in the relatively nearby universe demonstrates the unique power of VLBI to assess the prevalence of accreting BHs and SN complexes in young, star-forming galaxies. With this goal in mind, we conclude with investigating the prospects for future VLBI detection experiments. In Fig. 4 we show the predicted 1.4 GHz flux densities for (weak) radio AGN as a function of redshift up to . The blue, green and red shaded areas show the 1.4 GHz flux densities expected for a compact core having ratios of (i.e. typical radio-quiet AGN), (i.e. that measured for the LBA composite J0921+4509), and . The upper boundary of each region assumes erg s-1 (i.e. comparable to that of J0921+4509), while the lower boundaries are for sources that are a factor 10 less luminous in the X-ray (i.e. comparable to the other composite LBAs studied in this paper). Horizontal lines indicate typical EVN 5 sensitivities achieved in a 1 hr (dotted line) and 4 hr observation (solid line) both at 1 Gbps recording, as well as the projected 4 hr sensitivity expected in the next few years (dashed line). A source similar to J0921+4509 both in and can be detected to a redshift of , while it could be seen out to if its radio-loudness () was higher. In contrast, the prospects for sources that are radio-quiet and a factor ten less luminous in the X-ray are grim: such sources could potentially be detected only out to .
The recently increased sky coverage in the UV (GALEX), optical (SDSS) and IR (WISE) will allow the efficient selection of exotic starbursts, composites, and AGN at relatively low redshifts suitable for VLBI. A systematic survey of their pc-scale radio emission offers a unique chance of gaining new insights into the complex nuclear processes occurring in galaxies over a very wide redshift range.
Acknowledgments
The EVN is a joint facility of European, Chinese, South African and other radio astronomy institutes funded by their national research councils. We thank Patricia Arévalo, Jenny Greene, Lisa Kewley, and Miguel Pérez Torres for discussions. We would also like to thank the referee for his or her helpful feedback.
References
- Adelberger et al. (2005) Adelberger, K. L., Steidel, C. C., Pettini, M., Shapley, A. E., Reddy, N. A., & Erb, D. K. 2005, ApJ, 619, 697
- Alexander et al. (2005) Alexander, D. M., Bauer, F. E., Chapman, S. C., Smail, I., Blain, A. W., Brandt, W. N., & Ivison, R. J. 2005, ApJ, 632, 736
- Baldwin et al. (1981) Baldwin, J. A., Phillips, M. M., & Terlevich, R. 1981, PASP, 93, 5
- Basu-Zych et al. (2007) Basu-Zych, A. R., et al. 2007, ApJS, 173, 457
- Basu-Zych et al. (2009) Basu-Zych, A., et al. 2009, ApJL, 699, L118
- Bell et al. (2011) Bell, M. E., Tzioumis, T., Uttley, P., et al. 2011, MNRAS, 411, 402
- Bondi et al. (2005) Bondi, M., Pérez-Torres, M.-A., Dallacasa, D., & Muxlow, T. W. B. 2005, MNRAS, 361, 748
- Biggs et al. (2010) Biggs, A. D., et al. 2010, MNRAS, 408, 342
- Condon et al. (1991) Condon, J. J., Huang, Z. P., Yin, G. F., & Thuan, T. X. 1991,ApJ, 378, 65C
- Corbett et al. (2003) Corbett, E. A., Kewley, L. Appleton, P. N., Charmandaris, V., Dopita, M. A., Heisler, C. A., Norris, R. P., Zezas, A., & Marston, A. 2003, ApJ, 583, 670
- Davies et al. (2007) Davies, R. I., Sánchez, F. M., Genzel, R., Tacconi, L. J., Hicks, E. K. S., Friedrich, S., & Sternberg, A. 2007, ApJ, 671, 1388
- Downes & Eckart (2007) Downes, D., & Eckart, A. 2007, A&A, 468L, 57D
- de Gasperin et al. (2011) de Gasperin, F., Merloni, A., Sell, P., Best, P., Heinz, S., & Kauffmann, G. 2011, MNRAS, 835
- Diamond (1995) Diamond, P.J. 1995, in ASP Conf. Ser. 82, Very Long Baseline Interferometry and the VLBA, ed. J.A. Zensus, P.J. Diamond, & P.J. Napier, 227
- Di Matteo et al. (2005) Di Matteo, T., Springel, V., & Hernquist, L. 2005, Nature, 433, 604
- Elmegreen et al. (2008) Elmegreen, B. G., Bournaud, F., & Elmegreen, D. M. 2008, ApJ, 684, 829
- Gallimore et al. (2006) Gallimore, J. F., Axon, D. J., O’Dea, C. P., Baum, S. A., & Pedlar, A. 2006, AJ, 132, 546
- Gebhardt et al. (2000) Gebhardt, K., et al. 2000, ApJL, 539, L13
- Giroletti & Panessa (2009) Giroletti, M., & Panessa, F. 2009 ApJL, 706, 260
- Gonçalves et al. (2010) Gonçalves, T. S., et al. 2010, ApJ, 724,1373G
- Heckman et al. (2005a) Heckman, T. M., Ptak, A., Hornschemeier, A., & Kauffmann, G. 2005a, ApJ, 634, 161
- Heckman et al. (2005b) Heckman, T. M., et al. 2005b, ApJL, 619, L35
- Heckman et al. (2011) Heckman, T. M., et al. 2011, ApJ, 730, 5
- Hoopes et al. (2007) Hoopes, C. G., Heckman, T. M., Salim, S., et al. 2007, ApJS, 173, 441
- Hopkins & Quataert (2010) Hopkins, P. F., & Quataert, E. 2010, MNRAS, 407, 1529
- Iwasawa et al. (2009) Iwasawa, K., Sanders, D. B., Evans, A. S., Mazzarella, J. M., Armus, L., & Surace, J. A. 2009, ApJL, 695, L103
- Jia et al. (2011) Jia, J., Ptak, A., Heckman, T. M., Overzier, R. A., Hornschemeier, A., & LaMassa, S. M. 2011, ApJ, 731, 55
- Kauffmann et al. (2003) Kauffmann, G., et al. 2003, MNRAS, 346, 1055
- Kettenis et al. (2006) Kettenis, M., van Langevelde, H. J., Reynolds, C., Cotton, B. 2006, ASP Conference Series 351, 497
- Kewley et al. (2006) Kewley, L. J., Groves, B., Kauffmann, G., & Heckman, T. 2006, MNRAS, 372, 961
- Kewley et al. (2000) Kewley, L. J., Heisler, C. A., Dopita, M. A., & Sutherland, R. 2000, ApJ, 530, 704
- Kimball et al. (2011) Kimball, Amy E., Kellermann, K. I., Condon, J. J., Ivezić, Z̆eljiko, & Perley, Richard A. 2011, ApJ, 739L, 29K
- Laor & Behar (2008) Laor, A., & Behar, E. 2008, MNRAS, 390, 847
- Laird et al. (2006) Laird, E. S., Nandra, K., Hobbs, A., & Steidel, C. C. 2006, MNRAS, 373, 217
- Lehmer et al. (2005) Lehmer, B. D., Brandt, W. N, Alexander, D. M, Bauer, F. E, Conselice, C. J, Dickinson, M. E, Giavalisco, M, Grogin, N. A, Koekemoer, A. M, Lee, K. S, Moustakas, L. A, & Schneider, D. P 2005, AJ, 129, 1L
- Lehmer et al. (2010) Lehmer, B. D., Alexander, D. M., Bauer, F. E., Brandt, W. N., Goulding, A. D., Jenkins, L. P., Ptak, A., & Roberts, T. P. 2010, ApJ, 724, 559
- Lonsdale et al. (2006) Lonsdale, C. J., Diamond, P. J., Thrall, H., Smith, H. E., & Lonsdale, C. J. 2006, ApJ, 647, 185
- Magorrian et al. (1998) Magorrian, J., et al. 1998, AJ, 115, 2285
- Merloni et al. (2003) Merloni, A., Heinz, S., & di Matteo, T. 2003, MNRAS, 345, 1057
- Norman & Scoville (1988) Norman, C., & Scoville, N. 1988, ApJ, 332, 124
- Ouchi et al. (2008) Ouchi, M., et al. 2008, ApJS, 176, 301
- Overzier et al. (2008) Overzier, R. A., et al. 2008, ApJ, 677, 37
- Overzier et al. (2009) Overzier, R. A., et al. 2009, ApJ, 706, 203
- Overzier et al. (2010) Overzier, R. A., Heckman, T. M., Schiminovich, D., Basu-Zych, A., Gonçalves, T., Martin, D. C., & Rich, R. M. 2010, ApJ, 710, 979
- Overzier et al. (2011) Overzier, R. A., et al. 2011, ApJL, 726, L7
- Padovani et al. (2011) Padovani, P., Miller, N., Kellermann, K. I., Mainieri, V., Rosati, P., & Tozzi, P. 2011, ApJ, 740, 20P
- Parra et al. (2007) Parra, R., Conway, J. E., Diamond, P. J., Thrall, H., Lonsdale, C. J., Lonsdale, C. J., & Smith, H. E. 2007, ApJ, 659, 314
- Parra et al. (2010) Parra, R., Conway, J. E., Aalto, S., Appleton, P. N., Norris, R. P., Pihlström, Y. M., & Kewley, L. J. 2010, ApJ, 720, 555
- Perez-Torres et al. (2009) Perez-Torres, Romero-Canizales, C., M. A., Alberdi, A., & Polatidis, A. 2009,A&A, 507, L17-L20
- Perez-Torres et al. (2010) Perez-Torres, M. A., Alberdi, A., Romero-Canizales, C., & Bondi, M. 2010, A&A, 519, L5
- Plotkin et al. (2011) Plotkin, R. M., Markoff, S., Kelly, B. C., Koerding, E., & Anderson, S. F. 2011, arXiv:1105.3211
- Prandoni et al. (2010) Prandoni, I., de Ruiter, H. R., Parma, P. Gregorini, L., & Ekers, R. D. 2010, A&A, 510, 42
- Ranalli et al. (2003) Ranalli, P., Comastri, A., & Setti, G. 2003, A&A, 399, 39
- Rich et al. (2011) Rich, J. A., Kewley, L. J., & Dopita, M. A. 2011, ApJ, 734, 87
- Shepherd et al. (1994) Shepherd, M. C., Pearson, T. J. & Taylor, G. B. 1994,BAAS, 26, 987
- Steidel et al. (2002) Steidel, C. C., Hunt, M. P., Shapley, A. E., Adelberger, K. L., Pettini, M., Dickinson, M., & Giavalisco, M. 2002, ApJ, 576, 653
- Terashima & Wilson (2003) Terashima, Y., & Wilson, A. S. 2003, ApJ, 583, 145
- Yuan et al. (2010) Yuan, T.-T., Kewley, L. J., & Sanders, D. B. 2010, ApJ, 709, 884
- Zheng et al. (2010) Zheng, Z. Y., Wang, J. X., Finkelstein, S. L., Malhotra, S., Rhoads, J. E., & Finkelstein, K. D. 2010, ApJ, 718, 52