Enhanced anisotropic spin fluctuations below tetragonal-to-orthorhombic transition
in LaFeAs(O1-xFx) probed by 75As and 139La NMR
Abstract
75As and 139La NMR results of LaFeAs(O1-xFx) (=0, 0.025, and 0.04) were reported. Upon F-doping, the tetragonal-to-orthorhombic structural phase transition temperature , antiferromagnetic transition temperature and internal magnetic field are gradually reduced for . However, at , is abruptly suppressed to be 30 K along with a tiny , which is distinct from the continuous disappearance of the ordered phases in the Ba122 systems of Ba(Fe,Co)2As2 and BaFe2(As,P)2. The anisotropy of the spin-lattice relaxation rate , , in the paramagnetic phase of and 0.025 is constant (), but increases abruptly below due to the enhancement of by the slowing down of magnetic fluctuations. This indicates that the tetragonal-to-orthorhombic structural distortion enhances the anisotropy in the spin space via magnetoelastic coupling and/or spin-orbit interaction.
pacs:
76.60.-k, 75.50.Ee 74.70.XaIn the “1111” iron-arsenide FeAsO ( = rare earth elements), a tetragonal-to-orthorhombic structural phase transition occurs at , while a stripe-like antiferromagnetic (AF) ordering occurs at a slightly lower temperature at . Paglione and Greene (2010) In contrast, in the low- iron-phosphide superconductor LaFePO, Kamihara et al. (2006) there are neither AF ordering nor structural phase transition, suggesting that they may be essential for the high- superconductivity in iron-based superconductors. Understanding the connection between magnetism and structural distortion in LaFeAsO is the first important step toward clarifying their relation to the high-temperature superconductivity. Until now, however, the relationship between the structural and magnetic phase transition is an open question. The structural transition has been suggested to arise from various kinds of electron order such as spin nematic ordering Fang et al. (2008); Xu et al. (2008) and orbital order. Lee et al. (2009); Krüger et al. (2009) Recent experiments on detwined samples found strong anisotropy in the electronic properties of the orthorhombic phase, suggesting an underlying electronic nematic state. Chuang et al. (2010); Chu et al. (2010) It has been proposed that the structural distortion involves a change in the orbital configuration. Shimojima et al. (2010)
In this paper, we report 75As and 139La NMR results in LaFeAs(O1-xFx) (0, 0.025, and 0.04). F-doping suppresses and rapidly at , and the first-order like transition against F content is realized at , which is consistent with previous reports. Such a sudden disappearance of the ordered phases is in acute contrast with the Ba122-type iron-based superconductors where the ordered phase is continuously suppressed by chemical substitution. In the paramagnetic phase, exhibits anisotropic behavior [, measured in the magnetic field perpendicular to the axis, is 1.5 times larger than , measured in the magnetic field parallel to the axis,] and becomes more anisotropic below , indicative of the presence of magnetoelastic coupling and/or spin-orbit interaction.
Polycrystalline samples of LaFeAs(O1-xFx) (0, 0.025, and 0.04) were grown by solid state reactions. Kamihara et al. (2008) Powder x-ray diffraction indicates that they are mostly of single-phase and contain only a small amount of FeAs (1%). The values were determined by lattice constants using Vegard’s volume law. The error in the doping level is evaluated to be less than 0.5 %. Previous electrical resistivity, susceptibility, Kamihara et al. (2008) specific heat, Kohama et al. (2008) synchrotron x-ray diffraction, Nomura et al. (2008) Mössbauer Kitao et al. (2008) and NMR measurements Nakai et al. (2008, 2009) showed K and K for LaFeAsO. A superconducting (SC) transition determined by zero resistivity was observed at K in , but was not observed in .
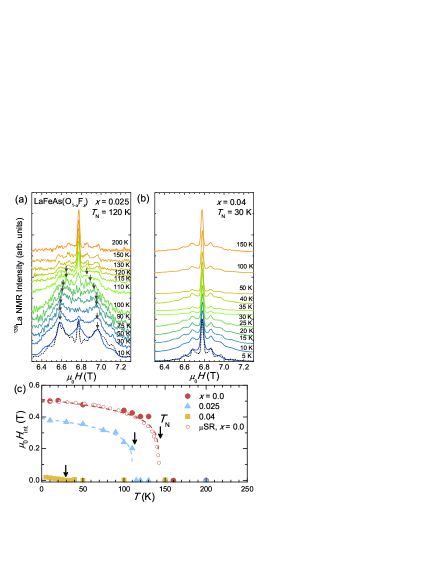
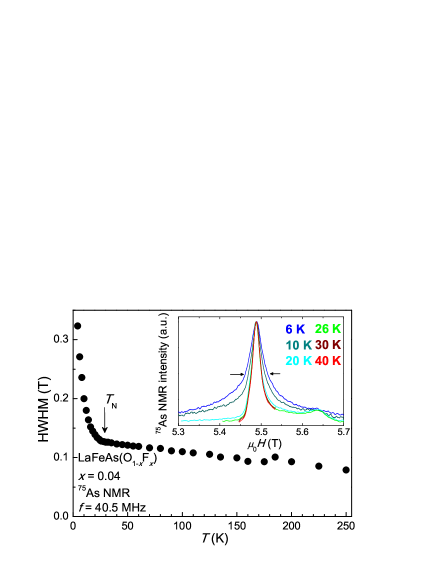
First, we show the evolution of and the internal magnetic field upon F doping revealed by 139La NMR spectra. Figures 1 (a) and (b) display 139La NMR spectra of our powdered samples of and 0.04, which are obtained by sweeping magnetic field at a fixed frequency of 40.5 MHz. 139La NMR spectra of becomes broadened due to the appearance of below approximately 120 K, and three peaks were observed at 10 K (Fig. 1 (a)). These peaks were assigned as follows; one peak at T corresponds to and the remaining two split peaks correspond to since the ordered Fe moments induce parallel to the axis at the La site. Kitagawa et al. (2008) The spectrum at 10 K is reproduced consistently by powder lineshape simulations based on the above assignment. From the simulations, we found that the two peaks around 6.6 and 7 T correspond to the first satellite peaks of 139La NMR spectrum split due to the appearance of the internal magnetic field. The internal magnetic field determined by the splitting of the two peaks shown by the arrows in Fig. 1 (a) is plotted in Fig. 1 (c). In the undoped LaFeAsO, we previously observed determined from 139La NMR spectra below K, Nakai et al. (2008) which is shown by the closed circles in Fig. 1 (c). The dashed line in Fig. 1 (c) is a fitting to the expression, , where is the ordered moment. The growth of below is much steeper than 3D mean field value (0.5), and the transition to the antiferromagnetic state is almost first-order like. This is consistent with the previous SR experiments as shown by the open circles. Luetkens et al. (2008) In contrast, for , there is no obvious splitting but only a slight broadening of the NMR spectrum appears as shown in Fig. 1 (b). Thus, the half width at half maximum (HWHM) of the central peak of is plotted in Fig. 1 (c). The gradual increase in HWHM suggests the occurrence of magnetic order with reduced moment below 30 K for . To confirm this magnetic ordering, we measured NMR spectrum at the As site for , since the hyperfine coupling at the As site is larger than that at the La site, and thus larger broadening is expected. Indeed, a broadening of HWHM of the central peak was observed in the 75As NMR spectrum as shown in Fig. 2. In addition, a peak in 75As at 30 K due to the slowing down of AF spin fluctuations as shown below (see Fig. 5 (a)) also evidences a magnetic ordering at . From the broadening behavior of the central peak of the 139La NMR spectra, we estimated the upper bound for the internal magnetic field for as T, which is much smaller than of T for . From the F doping dependence of at low temperatures, we found that the ordered moments abruptly decrease at around , which is consistent with previous results. Luetkens et al. (2009); Huang et al. (2008); Qureshi et al. (2010)
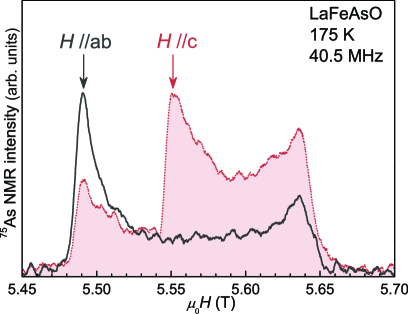
Next, we discuss anisotropic behavior of in LaFeAs(O1-xFx) revealed by 75As NMR measurements. In order to obtain the anisotropy of , we aligned our powdered samples. All our samples were mixed with Stycast 1266 epoxy, and allowed to cure in 5.5 T at room temperature. Due to the anisotropy of magnetic susceptibility, the powdered samples were partially aligned with the axis perpendicular to the applied field (“two-dimensional alignment”). Figure 3 displays 75As NMR spectra of the aligned powder of LaFeAsO above obtained by sweeping magnetic field perpendicular to the plane where the axis is randomly distributed (solid line) and parallel to the plane (dotted line). A peak at about 5.55 T corresponding to was clearly observed, and similar spectra were observed for and 0.04. 75As was measured at each central line for and . was measured with a saturation recovery method, and was fitted with a single component in a whole measured temperature range except in = 0.04 below 30 K. Nakai et al. (2008)
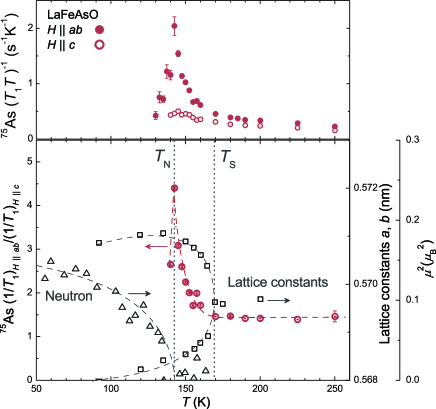
As shown in the upper panel of Fig. 4, for increases rapidly on cooling and exhibits a pronounced peak at , which is consistent with our previous 139La-NMR results. Nakai et al. (2008) In contrast, for increases gradually on cooling and exhibits a tiny bump at . The anisotropic behavior of is clearly seen in the lower panel of Fig. 4 where the anisotropy of defined as is plotted. The anisotropy is constant at high temperatures, but starts to increase at around 170 K, indicating that fluctuating hyperfine fields at the 75As site become anisotropic below approximately 170 K. Interestingly, the tetragonal-to-orthorhombic structural phase transition temperature inferred from the lattice constants coincides with the temperature at which the anisotropy of starts to develop. This indicates that the structural phase transition has a strong impact on the spin dynamics, and that measurements of the anisotropy can be utilized as an indicator of the structural phase transition.
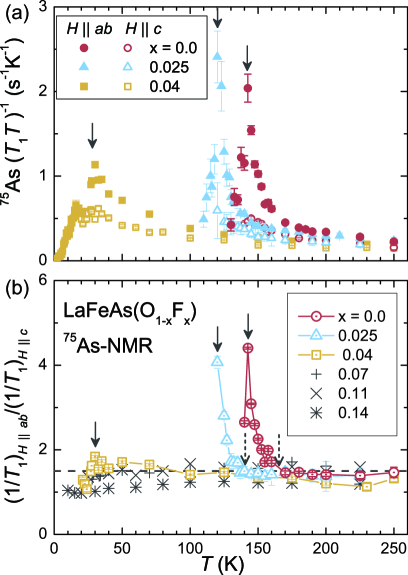
Similar anisotropic behavior of was observed for as shown in Fig. 5. A pronounced peak was observed for at 120 K for , and the anisotropy of starts to increase below approximately 140 K which we identified as for . In fact, previous specific heat measurements have detected an anomaly around 140 K. Kohama et al. (2008) By contrast, although a peak related to was observed in for at 30 K in , such a significant increase in the anisotropy of was not observed for , but the anisotropy increases very gradually on cooling, preventing us from determining . The absence of a pronounced signature of may be naturally understood by the distribution of because the sample locates at around the phase boundary. Lang et al. (2010)
Here, we analyze the data following previous studies. Kitagawa et al. (2008, 2010) Hyperfine fields at the 75As site, , can be described as the sum of contributions from the four nearest neighbor Fe spins,
| (1) |
where is the Fe electron spin at the -th Fe site, is the hyperfine coupling tensor to the electron spin at the -th Fe site, and is the hyperfine coupling tensor ascribed to the four nearest neighbor Fe electron spins. As shown previously, Kitagawa et al. (2008, 2010) can be described as follows in the orthorhombic notation:
| (5) |
originates from paramagnetic (PM) correlations along -axis. originates from the stripe (, 0) [(0, )] AF correlations and originates from the checkerboard (, ) AF correlations. As discussed in the previous papers, if the stripe correlations dominates the system like LaFeAsO, Ishikado et al. (2009) the ratio of can be written as,
| (6) |
where and denotes the power spectral density of a time-dependent random variable . The ratio becomes 1.5 if the Fe spin fluctuations are isotropic () while the ratio becomes much larger than 1.5 if Fe spin fluctuations are highly anisotropic (). Note that the ratio of 1.5 suggesting the presence of the stripe AF correlation has been reported in various iron-based superconductors, which seems to be a common feature of the superconductors. Kitagawa et al. (2010); Kitagawa et al. (2011a); Matano et al. (2009); Zhang et al. (2010); Li et al. (2010); Ma et al. (2010)
The anisotropy of is approximately 1.5 at high temperatures for all the samples, and increases suddenly below as shown in Fig. 5 (b). The above analysis indicates that the stripe AF fluctuations with the isotropic Fe spin component in the spin space are present above , and that the spin component becomes anisotropic below ; Fluctuations of Fe spins in the -plane become more significant than along -axis below . This indicates that the tetragonal-to-orthorhombic structural transition enhances the anisotropy of the spin space via strong magnetoelastic coupling and/or spin-orbit interaction.
A similar abrupt increase in the anisotropy of below a tetragonal-to-orthorhombic structural transition temperature was observed in NaFeAs with the “111” structure, Kitagawa et al. (2011b); Ma et al. (2011) which undergoes the structural transition followed by an AF transition at a lower temperature as in LaFeAsO. Thus, the sudden increase in the anisotropy of below , indicating the enhanced anisotropy in the spin space, can be observed in compounds with the separation of and . Indeed, the “122” parent compounds, where these two transitions take place simultaneously, do not exhibit such an abrupt increase in the anisotropy of . Kitagawa et al. (2009) We note that an enhancement of the anisotropy in the spin space was not observed but the anisotropy ratio of 1.5 was observed in the superconducting LaFeAs(O1-xFx) () with the tetragonal structure as shown in Fig. 5 (b). Kitagawa et al. (2010) This suggests that the stripe AF correlation is essential for superconductivity in iron-pnictide superconductors.Kitagawa et al. (2010)
In conclusion, we report 75As and 139La NMR results of the undoped and underdoped LaFeAs(O1-xFx) (0, 0.025, and 0.04). F-doping suppresses the AF and structural phase transition temperature very rapidly, and the first-order-like transition against F content is observed. Such a sudden disappearance of the ordered phases is in quite contrast with the Ba122-type iron-based superconductors such as Ba(Fe, Co)2As2 and BaFe2(As, P)2. Ning et al. (2010); Nakai et al. (2010) In the paramagnetic phase of and 0.025, becomes more anisotropic below the structural phase transition temperature. This indicates the presence of the strong magnetoelastic coupling and/or spin-orbit interaction in LaFeAs(O1-xFx).
We are grateful to S. Yonezawa, Y. Maeno and H. Ikeda for fruitful discussion. This work was supported by the Grants-in-Aid for Scientific Research on Innovative Areas “Heavy Electrons” (No. 20102006) from MEXT, for the GCOE Program “The Next Generation of Physics, Spun from Universality and Emergence” from MEXT, and for Scientific Research from JSPS. One of the authors(HH) acknowledges the support by the FIRST program, JSPS, JAPAN.
References
- Paglione and Greene (2010) J. Paglione and R. L. Greene, Nat. Phys. 6, 645 (2010).
- Kamihara et al. (2006) Y. Kamihara, H. Hiramatsu, M. Hirano, R. Kawamura, H. Yanagi, T. Kamiya, and H. Hosono, J. Am. Chem. Soc. 128, 10012 (2006).
- Fang et al. (2008) C. Fang, H. Yao, W.-F. Tsai, J. Hu, and S. A. Kivelson, Phys. Rev. B 77, 224509 (2008).
- Xu et al. (2008) C. Xu, M. Müller, and S. Sachdev, Phys. Rev. B 78, 020501 (2008).
- Lee et al. (2009) C.-C. Lee, W.-G. Yin, and W. Ku, Phys. Rev. Lett. 103, 267001 (2009).
- Krüger et al. (2009) F. Krüger, S. Kumar, J. Zaanen, and J. van den Brink, Phys. Rev. B 79, 054504 (2009).
- Chuang et al. (2010) T.-M. Chuang, M. P. Allan, J. Lee, Y. Xie, N. Ni, S. L. Bud’ko, G. S. Boebinger, P. C. Canfield, and J. C. Davis, Science 327, 181 (2010).
- Chu et al. (2010) J.-H. Chu, J. G. Analytis, K. D. Greve, P. L.McMahon, Z. Islam, Y. Yamamoto, and I. R. Fisher, Science 329, 824 (2010).
- Shimojima et al. (2010) T. Shimojima, K. Ishizaka, Y. Ishida, N. Katayama, K. Ohgushi, T. Kiss, M. Okawa, T. Togashi, X.-Y. Wang, C.-T. Chen, et al., Phys. Rev. Lett. 104, 057002 (2010).
- Kamihara et al. (2008) Y. Kamihara, T. Watanabe, M. Hirano, and H. Hosono, J. Am. Chem. Soc. 130, 3296 (2008).
- Kohama et al. (2008) Y. Kohama, Y. Kamihara, M. Hirano, H. Kawaji, T. Atake, and H. Hosono, Phys. Rev. B 78, 020512(R) (2008).
- Nomura et al. (2008) T. Nomura, S. W. Kim, Y. Kamihara, M. Hirano, P. V. Sushko, K. Kato, M. Takata, A. L. Shluger, and H. Hosono, Supercond. Sci. Technol. 21, 125028 (2008).
- Kitao et al. (2008) S. Kitao, Y. Kobayashi, S. Higashitaniguchi, M. Saito, Y. Kamihara, M. Hirano, T. Mitsui, H. Hosono, and M. Seto, J. Phys. Soc. Jpn. 77, 103706 (2008).
- Nakai et al. (2008) Y. Nakai, K. Ishida, Y. Kamihara, M. Hirano, and H. Hosono, J. Phys. Soc. Jpn. 77, 073701 (2008).
- Nakai et al. (2009) Y. Nakai, S. Kitagawa, K. Ishida, Y. Kamihara, M. Hirano, and H. Hosono, New J. Phys. 11, 045004 (2009).
- Kitagawa et al. (2008) K. Kitagawa, N. Katayama, K. Ohgushi, M. Yoshida, and M. Takigawa, J. Phys. Soc. Jpn. 77, 114709 (2008).
- Luetkens et al. (2008) H. Luetkens, H.-H. Klauss, R. Khasanov, A. Amato, R. Klingeler, I. Hellmann, N. Leps, A. Kondrat, C. Hess, A. Köhler, et al., Phys. Rev. Lett. 101, 097009 (2008).
- Luetkens et al. (2009) H. Luetkens, H.-H. Klauss, M. Kraken, F. J. Litterst, T. Dellmann, R. Klingeler, C. Hess, R. Khasanov, A. Amato, C. Baines, et al., Nat. Mater. 8, 305 (2009).
- Huang et al. (2008) Q. Huang, J. Zhao, J. W. Lynn, G. F. Chen, J. L. Luo, N. L. Wang, and P. Dai, Phys. Rev. B 78, 054529 (2008).
- Qureshi et al. (2010) N. Qureshi, Y. Drees, J. Werner, S. Wurmehl, C. Hess, R. Klingeler, B. Büchner, M. T. Fernández-Díaz, and M. Braden, Phys. Rev. B 82, 184521 (2010).
- de la Cruz et al. (2008) C. de la Cruz, Q. Huang, J. W. Lynn, J. Li, W. R. II, J. L. Zarestky, H. A. Mook, G. F. Chen, J. L. Luo, N. L. Wang, et al., Nature 453, 899 (2008).
- Lang et al. (2010) G. Lang, H.-J. Grafe, D. Paar, F. Hammerath, K. Manthey, G. Behr, J. Werner, and B. Büchner, Phys. Rev. Lett. 104, 097001 (2010).
- Kitagawa et al. (2010) S. Kitagawa, Y. Nakai, T. Iye, K. Ishida, Y. Kamihara, M. Hirano, and H. Hosono, Phys. Rev. B 81, 212502 (2010).
- Ishikado et al. (2009) M. Ishikado, R. Kajimoto, S. Shamoto, M. Arai, A. Iyo, K. Miyazawa, P. M. Shirage, H. Kito, H. Eisaki, S. Kim, et al., J. Phys. Soc. Jpn. 78, 043705 (2009).
- Kitagawa et al. (2011a) S. Kitagawa, Y. Nakai, T. Iye, K. Ishida, Y. F. Guo, Y. G. Shi, K. Yamaura, and E. Takayama-Muromachi, Phys. Rev. B 83, 180501(R) (2011a).
- Matano et al. (2009) K. Matano, Z. Li, G. L. Sun, D. L. Sun, C. T. Lin, M. Ichioka, and G. q. Zheng, Europhys. Lett. 87, 27012 (2009).
- Zhang et al. (2010) S. W. Zhang, L. Ma, Y. D. Hou, J. Zhang, T.-L. Xia, G. F. Chen, J. P. Hu, G. M. Luke, and W. Yu, Phys. Rev. B 81, 012503 (2010).
- Li et al. (2010) Z. Li, Y. Ooe, X.-C. Wang, Q.-Q. Liu, C.-Q. Jin, M. Ichioka, and G. q. Zheng, J. Phys. Soc. Jpn. 79, 083702 (2010).
- Ma et al. (2010) L. Ma, J. Zhang, G. F. Chen, and W. Yu, Phys. Rev. B 82, 180501 (2010).
- Kitagawa et al. (2011b) K. Kitagawa, Y. Mezaki, K. Matsubayashi, Y. Uwatoko, and M. Takigawa, J. Phys. Soc. Jpn. 80, 033705 (2011b).
- Ma et al. (2011) L. Ma, G. F. Chen, D.-X. Yao, J. Zhang, S. Zhang, T.-L. Xia, and W. Yu, Phys. Rev. B 83, 132501 (2011).
- Kitagawa et al. (2009) K. Kitagawa, N. Katayama, K. Ohgushi, and M. Takigawa, J. Phys. Soc. Jpn. 78, 063706 (2009).
- Ning et al. (2010) F. L. Ning, K. Ahilan, T. Imai, A. S. Sefat, M. A. McGuire, B. C. Sales, D. Mandrus, P. Cheng, B. Shen, and H.-H. Wen, Phys. Rev. Lett. 104, 037001 (2010).
- Nakai et al. (2010) Y. Nakai, T. Iye, S. Kitagawa, K. Ishida, H. Ikeda, S. Kasahara, H. Shishido, T. Shibauchi, Y. Matsuda, and T. Terashima, Phys. Rev. Lett. 105, 107003 (2010).