Collective Evidence for Inverse Compton emission from External Photons in High-Power Blazars
Abstract
We present the first collective evidence that Fermi-detected jets of high kinetic power () are dominated by inverse Compton emission from upscattered external photons. Using a sample with a broad range in orientation angle, including radio galaxies and blazars, we find that very high power sources ( 1045.5 erg s-1) show a significant increase in the ratio of inverse Compton to synchrotron power (Compton dominance) with decreasing orientation angle, as measured by the radio core dominance and confirmed by the distribution of superluminal speeds. This increase is consistent with beaming expectations for external Compton (EC) emission, but not for synchrotron-self Compton (SSC) emission. For the lowest power jets ( 1043.5 erg s-1), no trend between Compton and radio core dominance is found, consistent with SSC. Importantly, the EC trend is not seen for moderately high power flat spectrum radio quasars with strong external photon fields. Coupled with the evidence that jet power is linked to the jet speed (Kharb et al., 2010), this finding suggests that external photon fields become the dominant source of seed photons in the jet comoving frame only for the faster and therefore more powerful jets.
Subject headings:
galaxies: active — quasars: general — radiation mechanisms: non-thermal1. Introduction
The relativistic jets of radio-loud active galactic nuclei (AGN) are copious gamma-ray emitters, as was first discovered by EGRET (Hartman et al., 1992), and confirmed by the Fermi large area telescope (LAT), which has associated over 800 sources with radio-loud AGN in the second catalog (2LAC; Ackermann et al., 2011). Most of these are blazars, seen with the jet axis along the line of sight, though Fermi has also detected the jets of several radio galaxies (RG; Abdo et al., 2010; Kataoka et al., 2011), which are misaligned blazars under the standard unification scheme (Urry & Padovani, 1995).
The lower-energy peak in the jet spectrum is well-understood as synchrotron emission from relativistic electrons in the jet. The high-energy component, peaking from X-ray to TeV energies, is attributed to photons upscattered by the same relativistic electrons to higher energies via the inverse Compton (IC) process (see Böttcher 2007 for a review). These photons could arise from the jet synchrotron emission (synchrotron self-Compton emission, SSC; Maraschi et al., 1992; Marscher & Travis, 1996) or from external sources such as the accretion disk (Dermer et al., 1992), broad-line region (BLR; Sikora et al., 1994), or molecular torus (MT; Błażejowski et al., 2000; Sikora et al., 2009), i.e. external Compton (EC) emission. Identifying the IC emission mechanism is a diagnostic for the location of the gamma-ray emitting region, a currently open issue (e.g. Agudo et al., 2011). However, the spectral energy distributions (SEDs) of individual sources are rarely sufficiently constraining of the IC mechanism due to the number of free parameters (Sikora et al., 1997).
The beaming pattern (how apparent luminosity changes with orientation) is different for EC and SSC emission. Thus, a collective study using a sample of sources at different orientations can be used to identify the gamma-ray emission mechanism. In this letter we discuss the effect of jet power and orientation on the observed IC power in view of the recent suggestion of a dichotomy in radio-loud AGN (§2). We then show that the collective beaming pattern for a sub-set of high-power sources appears to support EC models rather than SSC for this population (§3), and discuss the implications for the gamma-ray emission region.
2. A Dichotomy in Radio-loud AGN
2.1. The Synchrotron Plane
Using a large sample of jets, we recently found evidence that radio-loud AGN form two populations in the plane of synchrotron peak luminosity () versus peak frequency (; Meyer et al., 2011, hereafter M11). A population of ‘weak’ jets consists of sources with low which appear to be most aligned at high (1017 Hz) and trace out a shallow track on the plane as they become less aligned (dropping more in than ). A separate population of ‘strong’ jets with higher and 1015 Hz appear to drop rapidly in luminosity with misalignment (as measured by radio core dominance). Importantly, the weak jets exhibit jet kinetic powers below 1044.5 erg s-1 while all sources with 1044.5 erg s-1 are on the strong-jet branch. The weak/strong divide in the synchrotron plane, which we associate with the morphological dichotomy in Fanaroff-Riley (FR) type 1 and 2 RG, may also be mapped to a critical transition in accretion efficiency (Ghisellini & Celotti, 2001; Ghisellini et al., 2009a; Georganopoulos et al., 2011).
2.2. The Blazar Envelope at High Energies
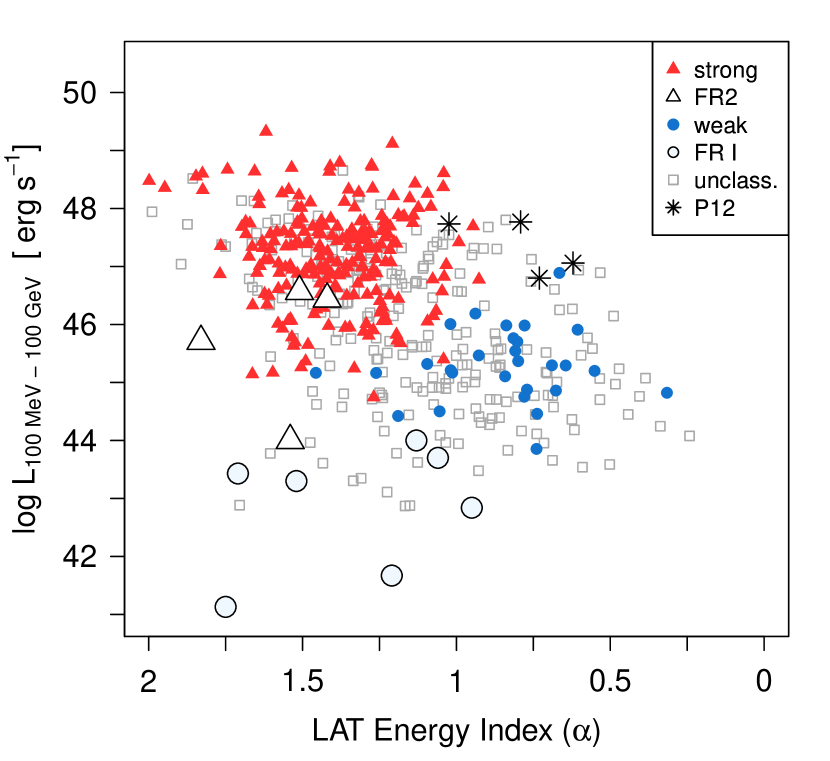
In light of the dichotomy discussed above, we present in Figure 1 the total LAT-band luminosity111 = 4 for power-law sources, where is the catalog integrated energy flux and = 1 using the published photon index . For sources fit with Log-Parabolic spectra, the integrated luminosity is calculated from the 2LAC fitted values with a k-correction. (a proxy for the IC peak luminosity, ), versus the LAT-band energy index (a proxy for peak frequency, ) for the entire Fermi-detected sample of radio-loud AGN of known redshift (data taken from the 2LAC). Sources with higher will have harder (smaller) values of , thus in the figure increases to the right.
An empty region at upper right appears analogous to that seen in the synchrotron plane. Giommi et al. (2012) have suggested that this is a selection effect due to a lack of redshifts for high-frequency-peaked, high-luminosity sources, and Padovani et al. (2012) discuss four such candidates. However, these candidates do not cross into the upper-right region in Figure 1 (black stars). These interesting sources appear to exhibit at or above 1015 Hz; however, the SED sampling is sparse, and it is difficult to rule out an alternative explanation for the soft X-ray spectra such as an extra emission component (see e.g., the case of BL Lacertae; Raiteri et al., 2010). Importantly, for the several hundred Fermi sources lacking identifications or redshifts, nearly all (99%) have soft spectra ( 1) or would require redshifts 2 or higher to cross into this region, making it unlikely to be empty due to selection effects.
The blazars in Figure 1 have been divided in an approximate way based on their synchrotron spectra into strong and weak jets. We take the former to be those defined by 1045 erg s-1, 1015 Hz, as well as flat spectrum radio quasar (FSRQ) type sources outside this area. For the weak jets, we take all sources outside this area, minus any FSRQ. While very rare cases of FR1-like (e.g., weak) FSRQs exist, their occurrence is negligible in the bright Fermi-detected population considered here (see e.g., Kharb et al., 2010, and references therein). The eleven Fermi-detected RG are also shown (data from Abdo et al., 2010). The FR1 in Figure 1 have much lower (larger ) compared with the weak-jet sources, while there is little difference between for FR2 and strong jets, tentatively matching the different misalignment paths for these populations that were found in the synchrotron plane.
2.3. The Importance of Jet Kinetic Power
In M11, we showed that is an important parameter in classifying RL AGN. We have selected from the 2LAC a subset of 152 blazars (as well as the detected radio galaxies) with estimates of the 300 MHz isotropic lobe emission, which is scaled to estimate as in M11. For 46 sources with adequate coverage of the high-energy SED, we estimated from a two-sided parabolic fit to the 2LAC data in combination with X-ray data taken from NED222NASA Extragalactic Database: http://ned.ipac.caltech.edu/ and/or Swift/BAT (Cusumano et al., 2010). For an additional 106 sources, is scaled from the rest-frame luminosity at 1 GeV estimated from the 2LAC fitted spectrum: log = log + , where =1.5 if , otherwise. The difference between the two estimates is typically less than 0.2 decades in log .
We use the radio core dominance log (/) as a tracer of the orientation angle, where the core luminosity is measured at 1.4 GHz and the extended at 300 MHz (see M11). As discussed in M11, the absolute normalization between orientation angle and depends on , with decreasing with increasing orientation angle for a given .
In Figure 2 we show the 145 sources which have a known redshift. is positively correlated with both and . The OLS bisector fits to the combined blazar-RG sample shown have slopes of 1.1, 1.5, 1.4, 1.3, 1.5 (0.1) from lowest to highest bin in . The correlation between and in each group is significant and positive (R values from 0.37 to 0.89); the apparent gamma-ray output of a blazar is therefore a strong function of both and the orientation angle.
2.4. Emission Mechanisms and Their Beaming Patterns
For both synchrotron and SSC, the beaming pattern is (Dermer, 1995), where assumes isotropic emission in the galaxy frame, is the solid-angle integrated luminosity in the comoving jet frame, is the Doppler factor, and the spectral index. For the exponent p+, p=3 for a ‘moving blob’, or p=2 for a stationary feature in a continuous jet (Lind & Blandford, 1985), with the possibility of different values for different emitting regions. For the EC case, the pattern is (Dermer, 1995; Georganopoulos et al., 2001).
| index values | SSC | EC | ||||
|---|---|---|---|---|---|---|
| 3 | 3 | 3 | 1.11.3 | 0 | 1.72 | 0.60.7 |
| 2 | 3 | 3 | 1.62 | 0 | 2.43 | 0.81 |
| 2 | 2 | 3 | 1.62 | 0 | 2.43 | 1.21.5 |
| 2 | 2 | 2 | 1.21.5 | 0 | 1.72.5 | 0.81 |
The slope of versus depends on the gamma-ray emission process. From the synchrotron beaming,
| (1) |
where the factors depend on the unbeamed luminosity and jet power, but do not affect the slope. We take = 1 for the peaks, and eliminating we obtain:
| (2) |
where b = 1 + (SSC) or b = 3 + (EC). For reference we list in Table 1 the expected slopes for various cases of values assuming typical values of (00.5). The slopes in Figure 2 appear to be more consistent with SSC under a , =3 or , =2 scenario. However, the lack of Fermi-detected misaligned FR2 sources (particularly, with 0.5) is likely to affect the slope for the two highest bins in in Figure 2; we show for reference the upper limits to 333From the flux limit ( 100 MeV): log = 8.3 + (5/6)(1.2), with average 1.3 for our sample and scaled from (Section 2.3). for four RG in the M11 sample. We take the rightmost of these points as the most constraining: including it in the fit for the log = 4545.5 bin increases the slope to 1.50.2, and for the highest bin to 1.70.3. These slopes, and our assumption that the Lorentz factor () of the gamma-ray emitting plasma is similar to that in radio, are discussed below.
3. The Compton Dominance in Fermi Blazars
3.1. EC in powerful FSRQ
For sources with a high-energy component dominated by SSC, the Compton dominance () should remain constant over all orientations (no correlation between and expected). For the EC case,
| (3) |
Using Equation 1 we have the relation
| (4) |
As shown in Table 1, we expect a correlation with a slope from 0.61.5 under the simplest assumptions for sources emitting gamma-rays by EC.

Figure 3 shows versus for the sample discussed in Section 2.3. Sources are divided into broad bins of . These bins include a mix of sources in terms of optical type (FSRQ or BL Lac); however all the very high power (VHP, 1045.5) are ‘strong-jet’ types in our classification due to their and position in the synchrotron plane, including many apparent BL Lacs, which likely suffer dilution of their broad lines by the jet emission (Georganopoulos & Marscher, 1998; Ghisellini et al., 2011). For the moderate-power sources, the division into strong/weak roughly follows the FSRQ/BL Lac divide.
No trend between and is evident for blazars overall. However, when VHP sources are selected, a positive correlation emerges. We also show the upper limits on for VHP sources from the sample of M11 not detected by Fermi444See previous footnote, with index estimated from the relation for detected sources: =0.2+ 3.9. VHP sources from the 2LAC and M11 with upper limits on 555Estimated at 300 MHz from the lowest-frequency SED point with spectral index . are also shown; because of the binning on which is scaled from , we also show as connected gray points the maximum such that 1045.5 erg s-1. The OLS bisector fit through all VHP points (including upper/lower limits) gives a slope of 1.10.1; this is a lower limit since most of the upper limits are on the lower half of the correlation. A sub-sample of sources with values contemporaneous to Fermi, calculated from the average 15 GHz666scaled to 1.4 GHz by 1.2 in log L flux over the time-frame of the 2LAC as measured by the Owens Valley Radio Observatory (OVRO, Richards et al., 2011), gives an identical slope.

The non-zero slope suggests EC emission in VHP sources; however, when taken together the slopes in Figures 2 and 3 are inconsistent with a simple EC scenario, as seen from Table 1. We have assumed that is the same for all energies; if the radio-emitting plasma is slower, then the expected slopes above will increase from the quoted ranges for both figures. Assuming truly higher slopes for the VHP sources in Figure 2, concordance can be achieved with a general =3 model with a slower in the radio.
3.2. The Test of Superluminal Motions
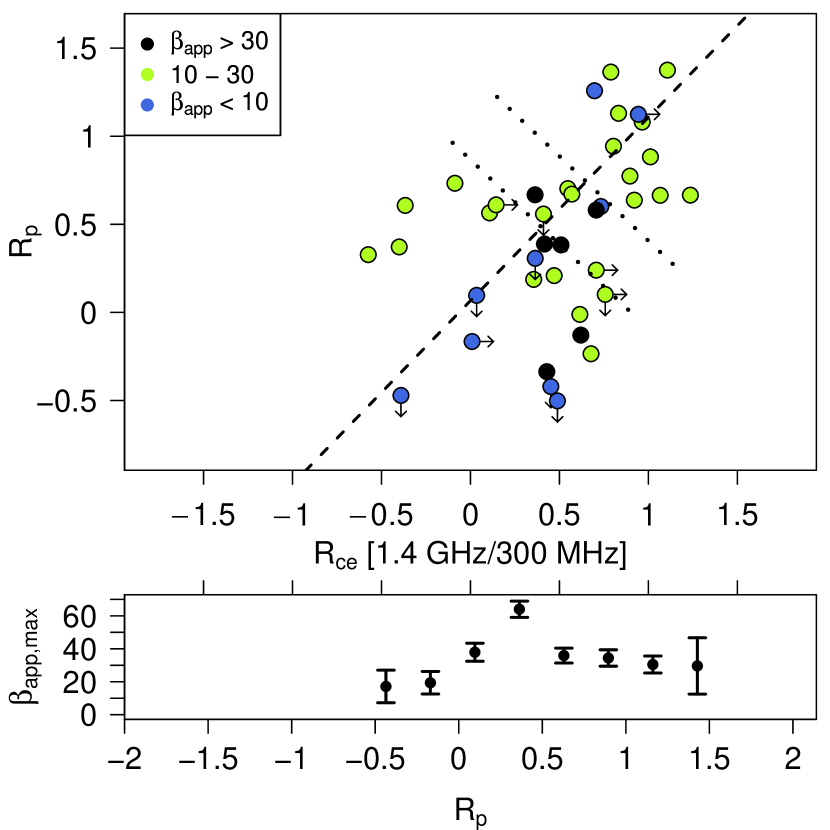
As shown by Lister & Marscher (1997), a substantial number of sources are expected to be seen at orientation angles smaller than that of which maximizes the superluminal speed . We therefore expect the highest values at () values less than the maximum. Indeed if the highest () sources are most aligned (within 1/), their values should be relatively small (noting that these may be under-represented as their are difficult to measure). In Figure 4 (upper panel) the VHP sources are plotted as in Figure 3, colored according to . The highest are observed in the middle of the correlation, as expected. This is also seen in the lower panel, where we have estimated the maximum in bins of width 0.25 in , running parallel to the correlation line.777The estimator for is derived from the order statistic =max() for a bin of size n using the estimator for the unknown upper bound of a uniform distribution with variance (e.g. Casella, 2001).
3.3. Why is EC Only Apparent in Powerful Jets?
What is apparently depicted in Figure 3 is that strong jets at high are EC dominated, while lower strong jets are not. However, the typical error in log of 0.7 is a significant factor, as it may be the case that the restriction 1045.5 erg s-1 is simply that which is high enough to avoid any contamination with SSC sources. Thus the true boundary for the SSC to EC transition is probably lower than 1045.5 (indeed, a few FSRQ of moderate are co-spatial in Figure 3 with the VHP sources). However, our findings imply that (a) VHP sources are dominated by EC, and (b) many lower strong jets appear at a similar (low) regardless of , suggesting that EC is not important for some part of the population.
Which emission mechanism dominates is related to how fast the flow is: assuming the gamma-ray emission of strong jets is inside the BLR or MT, the comoving energy density of the external photon field is . The synchrotron energy density is , where is the observed variability timescale in hours, the synchrotron luminosity, and we have assumed =. EC will dominate over SSC provided , or for greater than a transition value
| (5) |
Typical estimates of in the BLR and MT differ by ( erg cm-3 and erg cm-3; Ghisellini et al., 2009b). In the MT we have 14.4, higher by a factor of than in the BLR, where 8.1.
However, VLBI studies indicate that for most FSRQ (e.g. Jorstad et al., 2005); if the GeV emission site is in the BLR, it is difficult to explain the lack of EC signature for some strong jets. It has also been found that sources with higher produce on the average faster superluminal motions (Kharb et al., 2010). The connection between and , and an emitting region in the MT, can then explain a transition to EC at high : Strong jets at lower are also slower and as long as they are SSC emitters, exhibiting a Compton dominance independent of radio core dominance. As increases, also increases and once , the photon field of the MT begins to dominate, producing a Compton dominance that increases with increasing radio core dominance, as seen in Figure 3. If we adopt longer , both and decrease, requiring that essentially all strong jets are EC emitters, which our data does not support. On the other hand, with a shorter 1 hr (see e.g. Foschini et al., 2011) we obtain = 12.7 for the BLR and = 22.5 for the MT, making either location plausible.
4. Conclusions
The gamma-ray luminosities of Fermi-detected radio-loud AGN have been shown to depend strongly on both and the orientation angle. We find the first collective evidence for external Compton emission in high-power jets ( erg s-1): as can be seen in Figure 3, the Compton dominance of these sources increases with radio core dominance, a measure of orientation. This requires that the beaming pattern of the gamma-ray emission is more focused than that of synchrotron, as is the case for EC scattering. A confirmation that increases with decreasing orientation angle comes from the fact that the apparent superluminal speeds are observed to increase along the correlation to a maximum at moderate values of , before decreasing towards the highest values (Figure 4), as expected since we anticipate a significant number of sources at angles smaller than the maximum superluminal speed angle . The fact that strong jets of lower do not show an increase of Compton dominance with alignment suggests that their gamma-ray emission is due to SSC. Because more powerful jets appear to be faster (Kharb et al., 2010), a transition to EC at high can be explained by a transition Lorentz factor above which the external photons dominate.
References
- Abdo et al. (2010) Abdo, A. A., et al. 2010, ApJ, 720, 912
- Ackermann et al. (2011) Ackermann, M., et al. 2011, ApJ, 743, 171
- Agudo et al. (2011) Agudo, I., et al. 2011, ApJ, 735, L10
- Błażejowski et al. (2000) Błażejowski, M., Sikora, M., Moderski, R., & Madejski, G. M. 2000, ApJ, 545, 107
- Böttcher (2007) Böttcher, M. 2007, Ap&SS, 309, 95
- Casella (2001) Casella, G. Berger, R. 2001, Statistical Inference (Duxbury Press)
- Cusumano et al. (2010) Cusumano, G., et al. 2010, A&A, 510, A48
- Dermer (1995) Dermer, C. D. 1995, ApJ, 446, L63
- Dermer et al. (1992) Dermer, C. D., Schlickeiser, R., & Mastichiadis, A. 1992, A&A, 256, L27
- Foschini et al. (2011) Foschini, L., Ghisellini, G., Tavecchio, F., Bonnoli, G., & Stamerra, A. 2011, A&A, 530, A77
- Georganopoulos et al. (2001) Georganopoulos, M., Kirk, J. G., & Mastichiadis, A. 2001, ApJ, 561, 111
- Georganopoulos & Marscher (1998) Georganopoulos, M., & Marscher, A. P. 1998, ApJ, 506, 621
- Georganopoulos et al. (2011) Georganopoulos, M., Meyer, E. T., Fossati, G., & Lister, M. L. 2011, ArXiv:1111.4711
- Ghisellini & Celotti (2001) Ghisellini, G., & Celotti, A. 2001, A&A, 379, L1
- Ghisellini et al. (2009a) Ghisellini, G., Maraschi, L., & Tavecchio, F. 2009a, MNRAS, 396, L105
- Ghisellini et al. (2011) Ghisellini, G., Tavecchio, F., Foschini, L., & Ghirlanda, G. 2011, MNRAS, 414, 2674
- Ghisellini et al. (2009b) Ghisellini, G., Tavecchio, F., & Ghirlanda, G. 2009b, MNRAS, 399, 2041
- Giommi et al. (2012) Giommi, P., Padovani, P., Polenta, G., Turriziani, S., D’Elia, V., & Piranomonte, S. 2012, MNRAS, 420, 2899
- Hartman et al. (1992) Hartman, R. C., et al. 1992, ApJ, 385, L1
- Jorstad et al. (2001) Jorstad, S. G., Marscher, A. P., Mattox, J. R., Wehrle, A. E., Bloom, S. D., & Yurchenko, A. V. 2001, ApJS, 134, 181
- Jorstad et al. (2005) Jorstad, S. G., et al. 2005, AJ, 130, 1418
- Kataoka et al. (2011) Kataoka, J., et al. 2011, ApJ, 740, 29
- Kellermann et al. (2004) Kellermann, K. I., et al. 2004, ApJ, 609, 539
- Kharb et al. (2010) Kharb, P., Lister, M. L., & Cooper, N. J. 2010, ApJ, 710, 764
- Lind & Blandford (1985) Lind, K. R., & Blandford, R. D. 1985, ApJ, 295, 358
- Lister & Marscher (1997) Lister, M. L., & Marscher, A. P. 1997, ApJ, 476, 572
- Lister et al. (2009) Lister, M. L., et al. 2009, AJ, 138, 1874
- Maraschi et al. (1992) Maraschi, L., Ghisellini, G., & Celotti, A. 1992, ApJ, 397, L5
- Marscher & Travis (1996) Marscher, A. P., & Travis, J. P. 1996, A&AS, 120, C537
- Meyer et al. (2011) Meyer, E. T., Fossati, G., Georganopoulos, M., & Lister, M. L. 2011, ApJ, 740, 98
- Padovani et al. (2012) Padovani, P., Giommi, P., & Rau, A. 2012, MNRAS, L423
- Raiteri et al. (2010) Raiteri, C. M., et al. 2010, A&A, 524, A43
- Richards et al. (2011) Richards, J. L., et al. 2011, ApJS, 194, 29
- Sikora et al. (1994) Sikora, M., Begelman, M. C., & Rees, M. J. 1994, ApJ, 421, 153
- Sikora et al. (1997) Sikora, M., Madejski, G., Moderski, R., & Poutanen, J. 1997, ApJ, 484, 108
- Sikora et al. (2009) Sikora, M., Stawarz, Ł., Moderski, R., Nalewajko, K., & Madejski, G. M. 2009, ApJ, 704, 38
- Urry & Padovani (1995) Urry, C. M., & Padovani, P. 1995, PASP, 107, 803