Fundamental properties and atmospheric structure of the red supergiant VY CMa based on VLTI/AMBER spectro-interferometry ††thanks: Based on observations made with the VLT Interferometer (VLTI) at Paranal Observatory under programme ID 386.D-0012
Abstract
Aims. We investigate the atmospheric structure and fundamental properties of the red supergiant VY CMa.
Methods. We obtained near-infrared spectro-interferometric observations of VY CMa with spectral resolutions of 35 and 1500 using the AMBER instrument at the VLTI.
Results. The visibility data indicate the presence of molecular layers of water vapor and CO in the extended atmosphere with an asymmetric morphology. The uniform disk diameter in the water band around 2.0 m is increased by 20% compared to the near-continuum bandpass at 2.20–2.25 m, and in the CO band at 2.3–2.5 m it is increased by up to 50%. The closure phases indicate relatively small deviations from point symmetry close to the photospheric layer, and stronger deviations in the extended H2O and CO layers. Making use of the high spatial and spectral resolution, a near-continuum bandpass can be isolated from contamination by molecular and dusty layers, and the Rosseland-mean photospheric angular diameter is estimated to 11.30.3 mas based on a PHOENIX atmosphere model. Together with recent high-precision estimates of the distance and spectro-photometry, this estimate corresponds to a radius of 1420120 and an effective temperature of 349090 K.
Conclusions. VY CMa exhibits asymmetric, possibly clumpy, atmospheric layers of H2O and CO, which are not co-spatial, within a larger elongated dusty envelope. Our revised fundamental parameters put VY CMa close to the Hayashi limit of recent evolutionary tracks of initial mass 25 with rotation or 32 without rotation, shortly before evolving blueward in the HR-diagram.
Key Words.:
supergiants – Stars: atmospheres – Stars: fundamental parameters – Stars: mass-loss – Stars: individual: VY CMa1 Introduction
VY Canis Majoris (VY CMa) is one of the most luminous and most massive red supergiants, and thus most likely progenitors of a core-collapse supernova (SN) in our Galaxy. Because of its brightness and importance, it has traditionally been extensively observed at many wavelengths. Currently, VY CMa experiences a renewed and increased interest because of observations at new facilities including, for instance, the Herschel space observatory (Royer et al. 2010) and the submillimeter array (Fu et al. 2012), as well as because of new results regarding the complexity of its molecular envelope (e.g., Ziurys et al. 2007).
While is has been clear that VY CMa’s fundamental parameters are extreme, their exact values have been debated during the last decade with luminosities between and , effective temperatures between 2700 K and 3650K, radii between 600 and 3000 , and initial masses between 12 and 40 (Smith et al. 2001; Monnier et al. 2000, 2004; Massey et al. 2006). Very recently, precise parallax measurements by Choi et al. (2008) and Zhang et al. (2012) significantly improved the distance estimate to about 1.2 kpc, which together with recent accurate broad-band photometry by Smith et al. (2001) points to a luminosity of about .
VY CMa is embedded in a large optical nebula (Herbig 1972) and is also an extended object in the infrared (McCarthy & Low 1975). Several studies have investigated the asymmetric circumstellar environment in detail and revealed a complex asymmetric morphology (e.g. Wittkowski et al. 1998; Monnier et al. 1999, 2000, 2004; Smith et al. 2001; Muller et al. 2007; Humphreys et al. 2007; Jones et al. 2007). Recently, Smith et al. (2009) proposed a scenario of VY CMa’s circumstellar environment that consists of fast and dense CO/dust cloudlets that are ejected into a larger relatively slow and less dense asymmetric envelope due to a strong and variable mass loss.
2 Observations and data reduction
| Target | Date | Time | Mode | Baseline | PA |
|---|---|---|---|---|---|
| 2011-03 | UT | m | |||
| VY CMa | -06 | 1:42 | Low-JHK | 15.8/31.6/47.5 | 75 |
| VY CMa | -06 | 3:05 | MR-K 2.3 | 14.4/28.7/43.0 | 83 |
| VY CMa | -06 | 4:14 | Low-JHK | 11.8/23.6/35.4 | 90 |
| VY CMa | -07 | 0:55 | Low-JHK | 16.0/32.0/48.0 | 70 |
| VY CMa | -07 | 1:35 | Low-JHK | 15.9/31.7/47.6 | 75 |
| VY CMa | -07 | 3:02 | Low-JHK | 14.3/28.6/42.9 | 83 |
| VY CMa | -07 | 4:29 | MR-K 2.1 | 11.2/22.3/33.5 | 89 |
We observed VY CMa with the VLTI/AMBER instrument in visitor mode on 6 and 7 March 2011. Table 1 lists the details of our observations. We used the E0-G0-H0 configuration of the VLTI, providing projected baseline lengths between 11.2 m and 48.0 m. We obtained 5 observations using the low resolution mode with a spectral resolution of at different hour angles, thus different projected baseline lengths and angles. We also obtained one observation using each of the two -band medium resolution modes, together covering wavelengths between 1.92 m and 2.47 m at a spectral resolution of . All VY CMa observations are embedded between observations of an interferometric calibration star. We chose HR 3052 (spectral type K5 III, angular diameter 2.620.19 mas) and 1 Pup (K5 III, 3.850.28 mas) from the ESO Calibrator Selector CalVin based on the catalog by Lafrasse et al. (2010).
We obtained raw visibility and closure phase using the amdlib data reduction package (Tatulli et al. 2007; Chelli et al. 2009), version 3.0.3. We performed an absolute wavelength calibration as in Wittkowski et al. (2011). Calibrated visibility spectra were obtained by using an average of two transfer function measurements taken before and after each science observation.
Finally, we took into account that VY CMa shows an extended dust shell that exceeds the AMBER field of view (FoV). In this case, the calibrated visibility values are normalized to the flux within the AMBER FoV and not to the larger flux of the more extended target, which increases the fraction of the correlated flux and thus the visibility values (cf. Driebe et al. 2009). Here, this scaling factor was estimated using the results by Wittkowski et al. (2008) based on bispectrum speckle interferometry with a sufficiently large FoV. They obtained a relative flux contribution of an unresolved component of 9%/50% at wavelengths of 1.28 m/2.17 m. With our longer baselines, their extended component is fully resolved, and our visibility data describe their unresolved component. Thus, we used a model of a central uniform disk (UD) and a fully resolved component, and scaled our visibility values such that we obtained the same relative flux contribution of our central component. The resulting scale factor for the visibility modulus was 0.45/0.90 in the / bands, and we used an interpolated -band value of 0.65. We note that this procedure is applied in order to remove the instrumental signature of the limited FoV, which may be useful for a future combination of our data with data obtained by other instruments. However, the choice of the scaling factor does not affect the results presented in the following sections, except for the fraction of the flux that is attributed to the central stellar component, as the visibilities are fitted with a two-component model where the flux ration is a free parameter (see Sect. 4).
3 Atmospheric structure and morphology

2


3
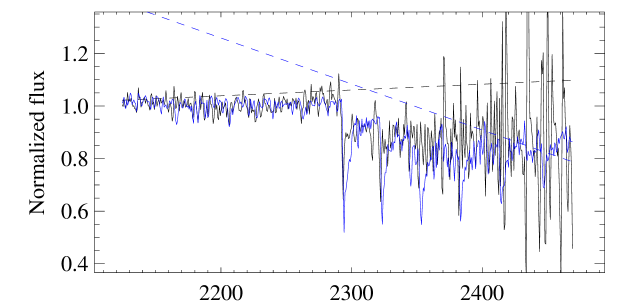
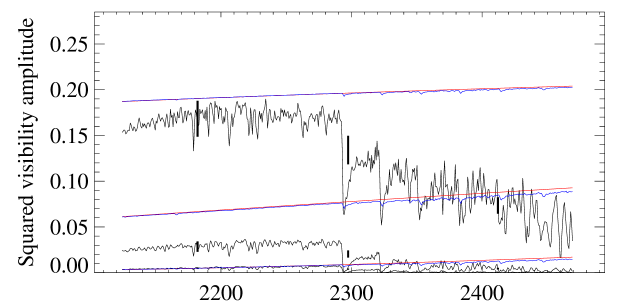

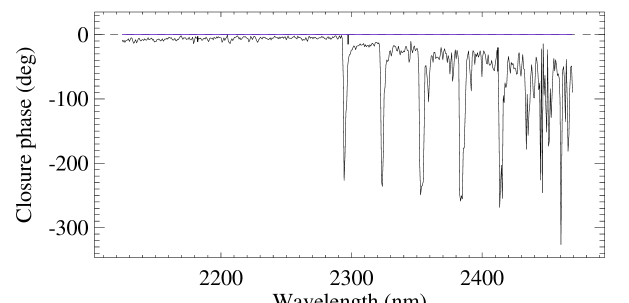
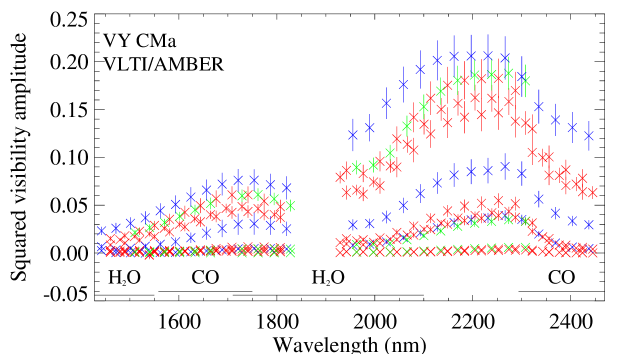
Figure 1 shows the resulting - and -band squared visibility amplitudes and closure phases of VY CMa obtained with the low resolution mode of the AMBER instrument. The -band values are not shown because of their lower quality. Also indicated are the positions of H2O and CO bands after Lançon & Wood (2000). The visibility curves show different heights, corresponding to the different projected baseline lengths. All curves exhibit a characteristic bumpy shape that resembles that of recent AMBER observations of Mira variables and that are interpreted as being indicative of the presence of molecular layers lying above the continuum-forming photosphere (Wittkowski et al. 2008, 2011). Our VY CMa visibility curves show maxima near 2.25 m and 1.70 m, where the intensity of molecular bands is lowest. The visibility decreases toward the water bands centered at 1.5 m and 1.9 m. It also exhibits a steep drop at the onset of the CO absorption feature at 2.3 m. The decrease of the visibility indicates an increased contribution from extended intensity at these molecular bands. The presence of molecular layers in the extended atmospheres of red supergiants is consistent with earlier observations of red supergiants such as Cep and Betelgeuse (Perrin et al. 2004, 2005; Tsuji 2006) and with the detection of warm water layers in the ISO and Herschel spectra of VY CMa (Polehampton et al. 2010; Royer et al. 2010).
Our VY CMa closure phases exhibit complex curves that correlate with the positions of the molecular bands and with the projected position angles of the observation. Non-0/non-180 closure phase values are indicative of deviations from point symmetry. At the near-continuum band close to 2.25 m all curves show relatively small closure phases with absolute values . This indicates relatively small deviations from point symmetry of atmospheric layers close to the photosphere. These deviations may be caused by photospheric convection cells or by asymmetric molecular emission that may not be completely absent at a near-continuum bandpass. At the molecular bands of H2O and CO, the closure phase values increase, which indicates a stronger deviation from point symmetry, and also show variations as a function of position angle. Along the EW orientation (PA ), the closure phase values remain at absolute values below within the CO band and the water band. Toward the NW-SE orientation (position angle ), they show a signal at the center of the water band at 1.9 m, and absolute values up to 40 at the CO band beyond 2.3 m. The increased asymmetry of the molecular layers from the E-W direction toward the NW-SE direction coincides with the larger-scale asymmetry of the dusty circumstellar envelope (PA 160 ) reported by Wittkowski et al. (1998) at a wavelength of 2.17 m. Along the PA of the stronger asymmetry, the sign of the closure phase differs between the H2O band CO band indicating that the H2O and CO regions are not co-spatial.
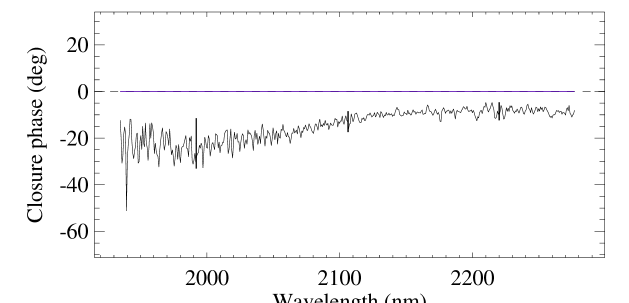
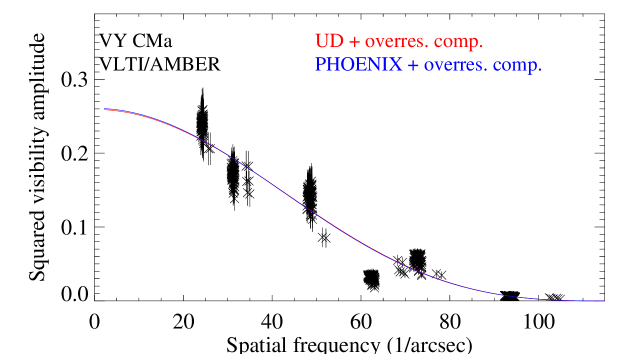
Figures 2 and 3 (electronic edition) show the results obtained with the medium resolution modes at PA and . These results are consistent with the low resolution results shown in Fig. 1. The visibility shows a maximum at the near-continuum bandpass at 2.20–2.25 m and decreases toward the water band centered at 1.9 m and the CO lines between 2.3 m and 2.5 m, in particular at the CO band-heads. The corresponding UD curve shows minimum extensions at 2.20–2.25 m and increases by about 20% at the water band near 2.0 m and by up to 50% at the CO band-heads. The closure phase shows relatively small absolute values of about 10 at the near-continuum bandpass, of 30–40 at the water and CO bands, and peaks at the CO band-heads, confirming asymmetric structures of extended CO band-head emission. Also shown in Figs. 2 and 3 are visibility fits of a UD model and a PHOENIX model atmosphere to the 2.20–2.25 m near-continuum band, as described in the following section.
Overall, our data may qualitatively be consistent with the scenario proposed by Smith et al. (2009), consisting of a cone-like envelope toward the SE direction that extends from a large-scale dusty envelope to a small-scale molecular water and CO envelope close to the photosphere, and additional close CO cloudlets that may not be co-spatial with the water envelope. However, for a definite and quantitative picture of the inner molecular envelope of VY CMa, an interferometric imaging campaign using a well-filled -plane will be required.
4 Fundamental parameters
5
The most direct method to derive the effective temperature is a measurement of the radius where the Rosseland-mean optical depth equals together with a measurement of the bolometric flux. The luminosity is most directly estimated by measurements of the bolometric flux and the distance. The bolometric flux of VY CMa can be well estimated using the high-precision photometry by Smith et al. (2001) complemented by the IRAS fluxes (Beichman et al. 1988), cf. also Jones et al. (2007) and Choi et al. (2008). We de-reddened these data using an value of 0.6 obtained from the COBE maps (Schlegel et al. 1998), and obtained an integrated bolometric flux of W/cm2. The distance estimate to VY CMa has recently been improved by high precision parallax measurements by Choi et al. (2008) and Zhang et al. (2012). Here we use the average of these two measurements, and adopt a distance of kpc. The classic distance used most often in the literature was 1.5 kpc going back to Lada & Reid (1978) and the suspected membership to the open cluster NGC 2362, but whose distance has also been revised from 1.5 kpc to 1.2 kpc (Mel’nik & Dambis 2009). Our adopted bolometric flux and distance correspond to a luminosity of . This value is slightly smaller than recent estimates by Choi et al. (2008) and Mauron & Josselin (2011), mostly because of the slightly larger adopted distance taking into account the additional measurement by Zhang et al. (2012), but otherwise well consistent. Choi et al. (2008) discussed that this value is also consistent with most earlier values available in the literature, if they are re-scaled to the same distance. We note that the error of is still dominated by the uncertainty of the distance.
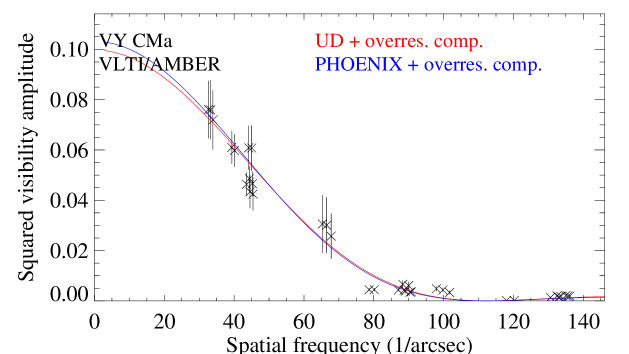
The angular diameter of VY CMa was measured by Monnier et al. (2004) in the -band (2.20.3 m) to (18.70.30.4) mas. They note that the relation of this diameter to a true photospheric diameter relies on additional assumption on the limb-darkening, and they also mention in Massey et al. (2006) that this value may overestimate the photospheric diameter because of a possible contamination by more extended molecular layers and dusty features. Our spectrally resolved visibility data in Figs. 1–3 confirm the presence of extended layers of H2O and CO, so that a broad-band diameter estimate is indeed significantly contaminated by extended molecular layers and thus overestimates the photospheric diameter. With our high spectral resolution, however, we are able to estimate a near-continuum diameter at 2.20–2.25 m that is largely free from contamination by molecular layers. With our longer baselines (up to 48 m compared to 38 m), our data also resolve out possible compact dusty features to smaller scales and probe spatial frequencies close to the visibility null, which significantly reduces calibration uncertainties. Figure 4 shows all our visibility data taken at spectral channels in the near-continuum bandpass between 2.20 m and 2.25 m as a function of spatial frequency, together with fits of a UD and a PHOENIX model atmosphere. The PHOENIX model was computed with version 16.03.01 of the PHOENIX code (Hauschildt & Baron 1999). We used solar metallicity, mass , K, 222We computed a large model grid for different values of , , and , which will be presented in detail in a forthcoming publication.. We used different outer pressure boundary conditions of dyn/cm2 and dyn/cm2, giving virtually identical results. The best-fit diameter using the UD model was mas, and using the PHOENIX model mas (corresponding to the model layer where ). Variations of the model mass, , and lead to diameter variations of less than 0.1 mas. The flux contribution of the stellar source was a free parameter resulting in a value of 51%. This parameter accounts for the fraction of an over-resolved flux component within our FoV and also for any residual of the uncorrelated flux outside the FoV (Sect. 2). The scatter of the visibility values in Fig. 4 may be caused by calibration uncertainties (in particular the points at 60–65/arcsec), or by different contributions of an over-resolved dusty component at different position angles. However, the diameter remains well constrained by the measurements close to the visibility null. Fig. 5 (electronic edition) shows the corresponding fit using a near-continuum bandpass in the -band at 1.70–1.75 m, resulting in a well consistent angular diameter of mas, which increases the confidence in our diameter estimate. Figs. 2 and 3 also indicate the UD and PHOENIX models compared to the spectrally resolved visibility data. The PHOENIX model curve is very close to a UD model, and does not predict the large extensions of the molecular layers. PHOENIX models predict near-infrared spectra of red supergiants reasonably well (Lançon et al. 2007, and Figs. 2 and 3), which likely means that opacities from molecular layers are reasonably well included, but that the extension of the model atmosphere is currently too compact. This effect is most likely caused by missing pulsation and/or wind acceleration. Since our estimate of is based on a near-continuum bandpass, where the contamination by molecular layers is small, we do not expect this to strongly affect our estimate of the photospheric diameter. However, we can not exclude that extended molecular layers also contribute at our near-continuum bandpass to a small extent, and that our estimate of may still overestimate the photospheric diameter to a small degree (of the order of 1 ), so that it may represent an upper limit of the true photospheric diameter. The resulting effective temperature, based on and , is K. Using the recent calibration by van Belle et al. (2009), this value corresponds to a spectral type of M4, which is consistent with the spectral classification as M3/M4 by Houk & Smith-Moore (1988) as used in the Simbad database. If is considered an upper limit, the estimate of is a lower limit.
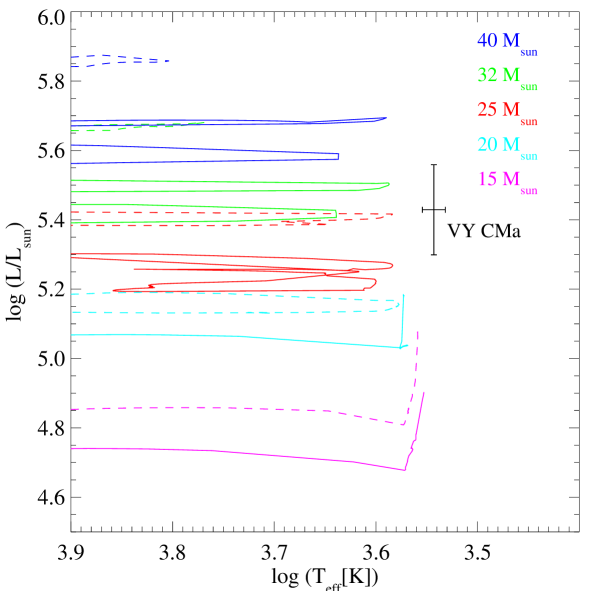
Figure 6 compares the resulting position of VY CMa in the Hertzsprung-Russell (HR) diagram to recent evolutionary sequences by Ekström et al. (2012). It is located close to the red limit of recent evolutionary tracks of initial mass 25 with rotation (current mass 15 ) or 32 without rotation (current mass 19 ). The position of VY CMa is drawn slightly to the right of the Hayashi limit. This may be caused by VY CMa not being in full hydrostatic equilibrium. However, a slight remaining underestimate of , which we can not fully exclude, could also explain this discrepancy.
| Parameter | Value | Reference |
|---|---|---|
| Distance (kpc) | 1.17 0.08 | 1 |
| Bolometric flux (10-13 W/cm2) | 6.3 0.3 | 2 |
| Rosseland angular diameter (mas) | 11.3 0.3 | 3 |
| Rosseland radius () | 1420 120 | 4 |
| Effective temperature (K) | 3490 90 | 5 |
| Spectral type | M4 (M3–M4.5) | 6 |
| Luminosity (10) | 2.7 0.4 | 7 |
| Initial mass () | 25 10 | 8 |
| Current mass () | 17 8 | 9 |
| Surface gravity (/ cgs) | 0.6 0.4 | 10 |
Table 2 summarizes our revised fundamental properties of VY CMa. With these parameters, VY CMa would most likely not explode at its current stage as a red supergiant, but be at a stage before moving blueward in the HR diagram.
Acknowledgements.
This research has made use of the AMBER data reduction package of the Jean-Marie Mariotti Center.References
- Beichman et al. (1988) Beichman, C. A., Neugebauer, G., Habing, H. J., Clegg, P. E., & Chester, T. J. 1988, Infrared astronomical satellite (IRAS) catalogs and atlases.
- Chelli et al. (2009) Chelli, A., Utrera, O. H., & Duvert, G. 2009, A&A, 502, 705
- Choi et al. (2008) Choi, Y. K., Hirota, T., Honma, M., et al. 2008, PASJ, 60, 1007
- Driebe et al. (2009) Driebe, T., Groh, J. H., Hofmann, K.-H., et al. 2009, A&A, 507, 301
- Ekström et al. (2012) Ekström, S., Georgy, C., Eggenberger, P., et al. 2012, A&A, 537, 146
- Fu et al. (2012) Fu, R., Moullet, A., Patel, N. A., et al. 2012, ApJ, 746, 42
- Hauschildt & Baron (1999) Hauschildt, P. H., & Baron, E. 1999, Journal of Computational and Applied Mathematics, 109, 41
- Herbig (1972) Herbig, G. H. 1972, ApJ, 172, 375
- Houk & Smith-Moore (1988) Houk, N., & Smith-Moore, M. 1988, Michigan Catalogue of Two-dimensional Spectral Types for the HD Stars. Volume 4,
- Humphreys et al. (2007) Humphreys, R. M., Helton, L. A., & Jones, T. J. 2007, AJ, 133, 2716
- Jones et al. (2007) Jones, T., Humphreys, R., Helton, L., Gui, C., & Huang, X. 2007, AJ, 133, 2730
- Lada & Reid (1978) Lada, C. J., & Reid, M. J. 1978, ApJ, 219, 95
- Lafrasse et al. (2010) Lafrasse, S., Mella, G., Bonneau, D., et al. 2010, Proc. SPIE, 7734, 140
- Lançon & Wood (2000) Lançon, A., & Wood, P. R. 2000, A&AS, 146, 217
- Lançon et al. (2007) Lançon, A., Hauschildt, P. H., Ladjal, D., & Mouhcine, M. 2007, A&A, 468, 205
- Massey et al. (2006) Massey, P., Levesque, E. M., & Plez, B. 2006, ApJ, 646, 1203
- Mauron & Josselin (2011) Mauron, N., & Josselin, E. 2011, A&A, 526, A156
- McCarthy & Low (1975) McCarthy, D. W., & Low, F. J. 1975, ApJ, 202, L37
- Mel’nik & Dambis (2009) Mel’nik, A. M., & Dambis, A. K. 2009, MNRAS, 400, 518
- Monnier et al. (1999) Monnier, J. D., Tuthill, P. G., Lopez, B., et al. 1999, ApJ, 512, 351
- Monnier et al. (2000) Monnier, J. D., Danchi, W. C., Hale, D. S., et al. 2000, ApJ, 543, 861
- Monnier et al. (2004) Monnier, J. D., Millan-Gabet, R., Tuthill, P. G., et al. 2004, ApJ, 605, 436
- Muller et al. (2007) Muller, S., Dinh-V-Trung, Lim, J., et al. 2007, ApJ, 656, 1109
- Perrin et al. (2004) Perrin, G., Ridgway, S. T., Coudé du Foresto, V., et al. 2004, A&A, 418, 675
- Perrin et al. (2005) Perrin, G., Ridgway, S. T., Verhoelst, T., et al. 2005, A&A, 436, 317
- Polehampton et al. (2010) Polehampton, E. T., Menten, K. M., van der Tak, F. F. S., & White, G. J. 2010, A&A, 510, A80
- Royer et al. (2010) Royer, P., Decin, L., Wesson, R., et al. 2010, A&A, 518, L145
- Schlegel et al. (1998) Schlegel, D. J., Finkbeiner, D. P., & Davis, M. 1998, ApJ, 500, 52
- Smith et al. (2001) Smith, N., Humphreys, R. M., Davidson, K., et al. 2001, AJ, 121, 1111
- Smith et al. (2009) Smith, N., Hinkle, K. H., & Ryde, N. 2009, AJ, 137, 3558
- Tatulli et al. (2007) Tatulli, E., Millour, F., Chelli, A., et al. 2007, A&A, 464, 29
- Tsuji (2006) Tsuji, T. 2006, ApJ, 645, 1448
- van Belle et al. (2009) van Belle, G. T., Creech-Eakman, M. J., & Hart, A. 2009, MNRAS, 394, 1925
- Wittkowski et al. (1998) Wittkowski, M., Langer, N., & Weigelt, G. 1998, A&A, 340, L39
- Wittkowski et al. (2008) Wittkowski, M., Boboltz, D. A., Driebe, T., et al. 2008, A&A, 479, L21
- Wittkowski et al. (2011) Wittkowski, M., Boboltz, D. A., Ireland, M., et al. 2011, A&A, 532, L7
- Zhang et al. (2012) Zhang, B., Reid, M. J., Menten, K. M., & Zheng, X. W. 2012, ApJ, 744, 23
- Ziurys et al. (2007) Ziurys, L., Milam, S., Apponi, A., & Woolf, N. 2007, Nature, 447, 1094